
Is Products Recommendation Good? An Experiment on User Satisfaction
Jaime Wojciechowski, Rafael Romualdo Wandresen, Rafaela Mantovani Fontana,
Jo˜ao Eugˆenio Marynowski and Alexander Robert Kutzke
Professional and Technological Education Department, Federal University of Paran´a,
R. Dr. Alcides Vieira Arcoverde 1225, Curitiba, Brazil
Keywords:
Recommendation Systems, E-commerces, Collaborative Filtering, Content-based Filtering.
Abstract:
Recommendation systems may use different algorithms to present relevant information to users. In e-
commerce contexts, these systems are essential to provide users with a customized experience. Several studies
have evaluated different recommendation algorithms against their accuracy, but only a few evaluate algorithms
from the user satisfaction viewpoint. We here present a study that aims to identify how different recommenda-
tion algorithms trigger different perceptions of satisfaction on users. Our research approach was an experiment
using products and sales data from a real small retailer. Users expressed their satisfaction perception for three
different algorithms. The study results show that the algorithms proposed did not trigger different perceptions
of satisfaction on users, giving clues of improvements to small retailers websites.
1 INTRODUCTION
Recommendation systems are widely used in on-line
environments. From news to products items, filtering
information is essential to provide users with a cus-
tomized experience (Liang et al., 2006; Thongpapanl
and Ashraf, 2011). In e-commerces, product recom-
mendation is part of the process needed to increase
customer loyalty and sales performance (Srinivasan
et al., 2002; Thongpapanl and Ashraf, 2011).
Several product recommendation algorithms have
been proposed and improved in the last years. Al-
though they have been extensively evaluated against
their accuracy (Bobadilla et al., 2013), accurate rec-
ommendations do not guarantee user satisfaction
(Herlocker et al., 2004). Evaluation of users aspects
on recommendation algorithms contributes to under-
standing whether the recommendations are useful and
help users to complete their tasks (Knijnenburg et al.,
2012).
Few studies compare real user satisfaction with
the recommendations of different algorithms (Knij-
nenburg et al., 2012). This study proposes a con-
tribution to the field by answering the following re-
search question: how do different recommendation
algorithms trigger different perceptions of satisfaction
on users? We compared users perceptions for three
different algorithms and our results show that user sat-
isfaction did not differ between algorithms.
This paper is organized as follows: Section 2
presents a brief conceptual explanation for recom-
mendation algorithms; Section 3 presents related
work; and Section 4 explains how this study was con-
ducted. Sections 5 and 6 present our results and dis-
cuss findings. Finally, Section 7 concludes and sug-
gests future work.
2 RECOMMENDATION
SYSTEMS
Recommendation systems are those responsible for
filtering information, mainly in online environments,
to help users find the information they need (Isinkaye
et al., 2015). One well-known example of recom-
mendation system is the Amazon e-commerce web-
site, which suggests products to the user that were
also bought by people with similar interests (Li and
Karahanna, 2015).
These systems implement a three-step computa-
tional process to identify the items to be presented to
users: 1) the user information collection, to under-
stand the user interests; 2) the learning, which filters
and explores related items; and 3) the recommenda-
tion per se, which predicts the items the user might
prefer.
(Isinkaye et al., 2015) describes that recommen-
dation systems can use different strategies to iden-
Wojciechowski, J., Wandresen, R., Fontana, R., Marynowski, J. and Kutzke, A.
Is Products Recommendation Good? An Experiment on User Satisfaction.
DOI: 10.5220/0006316307130720
In Proceedings of the 19th International Conference on Enterprise Information Systems (ICEIS 2017) - Volume 2, pages 713-720
ISBN: 978-989-758-248-6
Copyright © 2017 by SCITEPRESS – Science and Technology Publications, Lda. All rights reserved
713

tify items to present to users – the recommendation
filtering techniques – such as collaborative filtering,
content-based and hybrid ones. In any way that infor-
mation is selected, recommendation systems “try to
balance accuracy, novelty, dispersity and stability in
recommendations” (Bobadilla et al., 2013, p.109).
The “content-based recommendation systems an-
alyze items descriptions to identify items that are of
particular interest to the user”(Pazzani and Billsus,
2007, p.325). Systems that use this technique imple-
ment different types of algorithms to find similarities
between items to generate useful recommendations,
such as statistical analysis or machine learning tech-
niques (Isinkaye et al., 2015).
To understand user interests, recommendation
systems build user profiles based on the user’s choices
made in the past (Bobadilla et al., 2013). This profile
may include a model of the user preferences, predict-
ing the probability that the user gets interested in a
specific item; or a history of user’s interaction with the
recommendation system, storing the items that users
have viewed (Pazzani and Billsus, 2007).
Another strategy to identify the items to present
to users is collaborative filtering: “the process of fil-
tering or evaluating items using the opinions of other
people” (Schafer et al., 2007). Users give ratings
about a set of elements (Bobadilla et al., 2013) and the
system builds predictions or recommendations based
on a database built with preferences for items by users
(Isinkaye et al., 2015). These ratings may be gathered
explicitly, when users provide their opinions; or im-
plicitly, when users’ preferences are inferred based on
users’ actions (Schafer et al., 2007).
According to (Schafer et al., 2007), collaborative
and content-based filtering techniques differ in the
sense that the first is based on the assumption that
people with similar tastes rate items similarly; and the
second assumes that items with similar features will
be rated similarly.
Hybrid approaches are possible and improve
the recommendation systems results by combining
collaborative filtering and content-based techniques
(Isinkaye et al., 2015; Li and Karahanna, 2015).
(Isinkaye et al., 2015) suggests a combination by im-
plementing the algorithms separately and then com-
bining results; by using content-based filtering in col-
laborative approach or vice-versa; or creating a uni-
fied recommendation system with both approaches.
3 RELATED WORK
Evaluating the recommendation systems results is an
important step in the process of providing useful rec-
ommendations to users. Identifying how the recom-
mended products correspond to users’ needs enables
to gather data to improve the overall recommendation
process (Li and Karahanna, 2015).
Quality and evaluation metrics have been used
in recommendation systems research to acquire the
quality of techniques, methods, and algorithms for
predictions and recommendations (Bobadilla et al.,
2013). According to (Isinkaye et al., 2015), metrics
are classified into accuracy and coverage. While ac-
curacy verifies the proportion of correct recommen-
dations over all possible recommendations, coverage
measures the fraction of the search space for which
the system is able to build recommendations.
(Herlocker et al., 2004) states that recommenda-
tion systems evaluation is difficult for a number of
reasons. First, different algorithms might be better
for different data types. Second, the evaluation objec-
tives might differ (e.g., accuracy importance is giv-
ing space for customer decision support relevance).
Lastly, when comparing different algorithms, it is dif-
ficult to define measurements that will provide an ef-
fective comparison.
Some researchers state that user satisfaction is the
bottom-line success measure of recommendation sys-
tems (Herlocker et al., 2004). Algorithms accuracy is
only part of the users’ experience (Knijnenburg et al.,
2012). According to (Xiao and Benbasat, 2007), trust,
usefulness and usability compose the main elements
that support the customer decision-making.
Several studies relate user satisfaction with the use
of recommendation systems (Jiang et al., 2010), with
consumer participation (Dabholkar and Sheng, 2012),
and with personalized content (Liang et al., 2006),
among others. Yet, few studies investigate how dif-
ferent algorithms generate different user perceptions
(Knijnenburg et al., 2012). This study contributes to
this field by presenting a comparison of user satisfac-
tion among three different algorithms, as explained in
the next Section.
4 RESEARCH APPROACH
This study aims to identify how different recommen-
dation algorithms trigger different perceptions of sat-
isfaction on users. To accomplish that, we applied an
experiment as the research method, in November and
December, 2016. (Montgomery, 2009) states an ex-
periment is a test, “in which purposeful changes are
made to input variables of a process or system so that
we may observe and identify the reasons for changes
that may be observed in the output response” (Mont-
gomery, 2009, p.1). Our “input variables” are prod-
ICEIS 2017 - 19th International Conference on Enterprise Information Systems
714

uct recommendation algorithms and the “output re-
sponse” is user satisfaction.
We used three different product recommendation
algorithms in the context of a furniture e-commerce
website. The three algorithms shared the same private
database, from a real retailer website, with 270.000
records of products and sales data:
• Algorithm 1: implements a simple database query
that finds products based on the same category,
similar size and price. There is no computational
intelligence embedded.
• Algorithm 2: implements the slope one predictor
for collaborative filtering, based on the descrip-
tion provided by (Lemire and Maclachlan, 2005).
We built a model from all the sales performed in
2016. In this algorithm, once we have an item
as input, we recommend other items to user that
were bought before together with the input one,
regardless of their category or other attributes.
• Algorithm 3: implements another collaborative
filtering algorithm, now using Apache Mahout
(Apache, 2016). We implemented an API that
uses as input a file relating users, products, and
ratings.
Algorithm 1 restricts and focuses on showing sim-
ilar products. On the other hand, Algorithm 2 and 3
focus on showing different products, recommending
products of different types and categories based on
sales performed to other users. As we used an exten-
sive real sales database, collaborative filtering algo-
rithms worked on a relevant history of products sold.
Our data analysis focused on invalidating three
null hypothesis:
• H01: There is no significant difference in user sat-
isfaction by comparing the recommendations re-
ceived by Algorithm 1 with the ones received by
Algorithm 2;
• H02: There is no significant difference in user sat-
isfaction by comparing the recommendations re-
ceived by Algorithm 1 with the ones received by
Algorithm 3;
• H03: There is no significant difference in user sat-
isfaction by comparing the recommendations re-
ceived by Algorithm 2 with the ones received by
Algorithm 3;
According to the classification given by (Her-
locker et al., 2004), our study on evaluating rec-
ommendation systems is explicit, a laboratory study,
based on the outcome and on a short-term analysis, as
explained in the next subsections.
4.1 An Explicit Evaluation
We asked users to explicitly expose their perception
of the system. We provided users with a question-
naire for them to answer questions about their satis-
faction with the recommendation received. The ques-
tions were based on (Liang et al., 2006) and asked
users:
• whether the system finds the furniture the user
wants to view;
• whether the system filters out the furniture the
user does not want;
• whether the system captures the right category
(the one that is of interest to the user);
• whether the system captures the users interests;
• whether the system finds interesting furniture ef-
ficiently;
• overall satisfaction;
We also asked users, in an open-ended question,
to provide us their free perception about the recom-
mendations received.
4.2 A Laboratory Study
We performed a controlled experiment, asking under-
graduate students to search for products and to eval-
uate the recommendations provided. Students were
considered because they represent a usual Internet
shopping public (Dabholkar and Sheng, 2012).
The students were randomly divided into three
groups that accessed different websites, each web-
site implemented a recommendation algorithm. They
were given a scenario in which they were starting their
software developer careers and rented a workroom.
They should consider they had enough money to buy
one desk, one chair, and one bookcase. We asked
them to search once for each of these products and
to evaluate the products recommended (with no time
restriction).
The procedure was as follows: they should enter a
text-based search in the website. Once the search was
performed, the site would present the products. The
participant should click in the chosen product and, in
another page, view this product and a list of recom-
mended items. The list was differentdependingon the
product and on the algorithm being used. The users
evaluated this list of recommended products answer-
ing questions about their satisfaction with the recom-
mendation.
Is Products Recommendation Good? An Experiment on User Satisfaction
715
4.3 An Outcome Evaluation
As stated by (Herlocker et al., 2004), we evaluated the
effect of users action on the recommendation system.
Based on the recommendations received, participants
answered each of the questions in the questionnaire in
a 5-point Likert scale.
Based on the users responses, we applied the
ANOVA statistical test to verify whether there was
difference in the mean responses. The test was ap-
plied to compare evaluations between the three algo-
rithms. If a difference was found, the Tukey test was
applied to identify which one was different. Then, the
best one was inferred by the higher mean. For the
open-ended question analysis, we applied the The-
matic Network Analysis to code, group and analyze
the answers texts (Attridge-Stirling, 2001).
4.4 A Short-term Analysis
Our analysis is based on an evaluation performed im-
mediately after users received recommendations. We
did not include any post-sales analysis.
5 RESULTS
We applied the experiment described in Section 4
with 68 undergraduate students. Their ages ranged
from 18 to 41, 86% were men and 14% were women.
To understand their experience with e-commerce
websites, we asked them how many times they had
used the Internet for shopping in the last 6 months.
We identified that 39.7% of them had bought no to
two times; 32.2% of them, three to six times; and
27.9% used e-commerce for shopping more than six
times in the last six months. We thus consider that
our respondents had enough experience with Internet
shopping to provide their opinion.
Tables 1, 2 and 3 present descriptive statistics
for the responses obtained considering the products
recommended by Algorithms 1, 2, and 3, respectively.
Next, we analyze the answers of each question by
comparing the algorithms using ANOVA and Tukey
statistical tests. Later, we present our qualitative re-
sults and hypotheses analysis.
5.1 Analysis of Questions
5.1.1 The System Finds Furniture the User
Wants to View
We asked users whether the system showed furniture
they wanted to view. The mean evaluation for Algo-
rithms 1, 2, and 3, was 3.60, 3.38, and 2.70, respec-
tively.
By executing the ANOVA test, we verified sta-
tistically significant different means among all the
algorithms, since p was less than 0.05 (F(2, 65) =
3.75, p < 0.05). It means that algorithms triggered
different reactions from users regarding finding furni-
ture they wanted to view.
Then, we conducted the Tukey test and generated
the box plot graph of the answers. It provides data
to evaluate the statistically significant difference be-
tween means, pair by pair.
Algorithms 1 and 2 were not significantly different
according to the Tukey test (p > 0.1), and Algorithms
1 and 3 were significantly different (p < 0.05). This
information is confirmed by the box plot graph of the
answers to Question 1. (Figure 1).
Figure 1: Box Plot of the users’ answers regarding Question
1 and Algorithms 1, 2, and 3.
In this case, we can infer that Algorithms 2 is as
good as Algorithm 1, but Algorithm 3 is not as good
as Algorithm 1.
5.1.2 The System Filters Out Furniture the User
Does Not Want
Regarding the evaluation whether the system filters
out furniture that the user does not want, the means
for the Algorithms 1, 2, and 3 were 2.82, 2.71, and
2.83, respectively.
By executing the ANOVA test, we verified the
three algorithms were statistically similar (F(2, 65) =
0.07, p > 0.1), since p was greater than 0.1.
This result indicates that users do not feel any dif-
ference between the three algorithms regarding their
ability of filtering the products that users do not want.
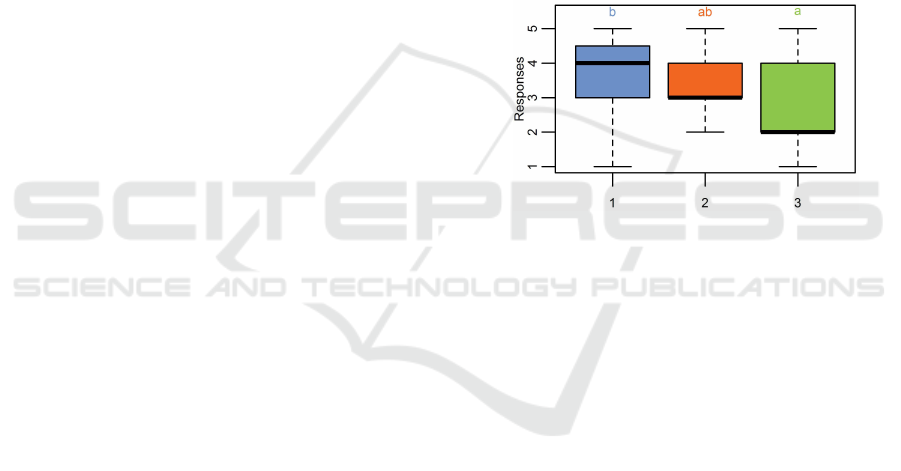
5.1.3 The System Captures the Right Category
The question that evaluated whether the system cap-
tures the category that is interesting to the user, the
mean of the answers for Algorithm 1 was 4.08, for
Algorithm 2 was 3.85 and for Algorithm 3 was 2.79.
ICEIS 2017 - 19th International Conference on Enterprise Information Systems
716
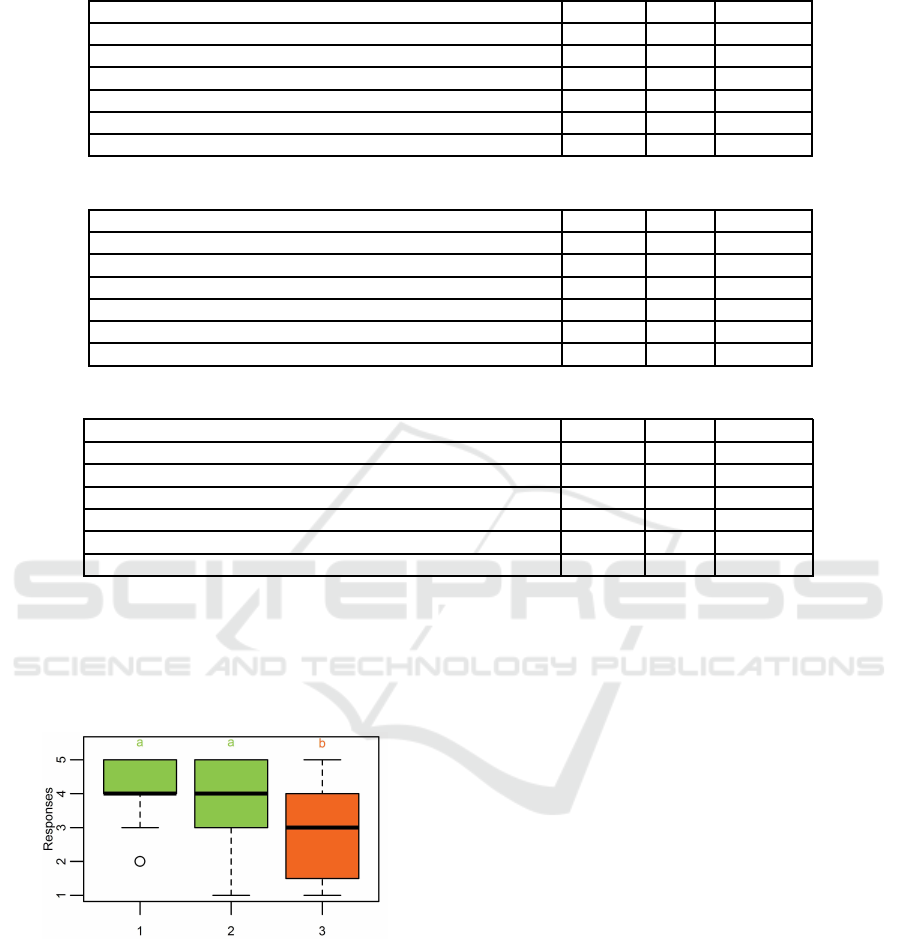
Table 1: Descriptive statistics of user satisfaction considering Algorithm 1.
Question Median Mean Std. Dev.
The system finds the furniture the user wants to view 4 3.60 1.19
The system filters out the furniture the user does not want 3 2.82 1.15
The system captures the right category 4 4.08 1.04
The system captures the users interests 4 3.52 0.99
The system finds interesting furniture efficiently 4 3.56 0.94
Overall satisfaction 3 3.10 1.15
Table 2: Descriptive statistics of user satisfaction considering Algorithm 2.
Question Median Mean Std. Dev.
The system finds the furniture the user wants to view 3 3.38 1.07
The system filters out the furniture the user does not want 3 2.71 1.18
The system captures the right category 4 3.85 1.06
The system captures the users interests 3 3.23 1.17
The system finds interesting furniture efficiently 4 3.52 1.07
Overall satisfaction 3 3.28 1.14
Table 3: Descriptive statistics of user satisfaction considering Algorithm 3.
Question Median Mean Std. Dev.
The system finds the furniture the user wants to view 2 2.70 1.07
The system filters out the furniture the user does not want 2.50 2.83 1.18
The system captures the right category 3 2.79 1.06
The system captures the users interests 3 2.70 1.17
The system finds interesting furniture efficiently 3 2.79 1.07
Overall satisfaction 2 2.50 1.14
The ANOVA test presented statistically significant
difference between means of the answers from the
three algorithms (F(2, 65) = 7.89, p < 0.001). Then,
we conducted the Tukey test and generated the box
plot graph of the answers (Figure 2).
Figure 2: Box Plot of the users’ answers regarding Question
3 and Algorithms 1, 2, and 3.
Algorithms 1 and 2 presented no significant dif-
ference according to the Tukey test (p > 0.1). How-
ever, Algorithms 2 and 3 were considered different
(p < 0.05); Algorithms 1 and 3 presented statistically
different means (p < 0.05), too. This information is
confirmed in the box plot in Figure 2. Algorithms 1
and 2 are grouped as a, separated from the answers to
Algorithm 3, which is in group b.
We hence conclude that Algorithm 1 performed as
good as Algorithm 2 regarding evaluating whether the
system captures the right category, but Algorithm 3 is
not as good as Algorithms 1 and 2.
5.1.4 The System Captures the User’s Interests
By analyzing the responses regarding the system abil-
ity to capture users’ interests, the mean of the re-
sponses for Algorithm 1 was 3.52, for Algorithm 2,
3.23, and for Algorithm 3, 2.70.
The ANOVA test resulted in no statistically sig-
nificant difference among algorithms (F(2, 65) =
3.01, p > 0.05). We thus consider that the three al-
gorithms generate a similar perception among cus-
tomers regarding capturing users’ interests.
5.1.5 The System Finds Interesting Furniture
Efficiently
We also analyzed whether the system efficiently finds
the products that are interesting to users (Question 5).
The mean of the values for Algorithm 1 was 3.56, for
Algorithm 2, 3.52, and for Algorithm 3, 2.79.
The ANOVA test showed significant difference
among means of the answers (F(2, 65) = 3.65, p <
0.05). The Tukey test showed no significant differ-
ence between Algorithms 1 and 2 (p > 0.1), and be-
Is Products Recommendation Good? An Experiment on User Satisfaction
717
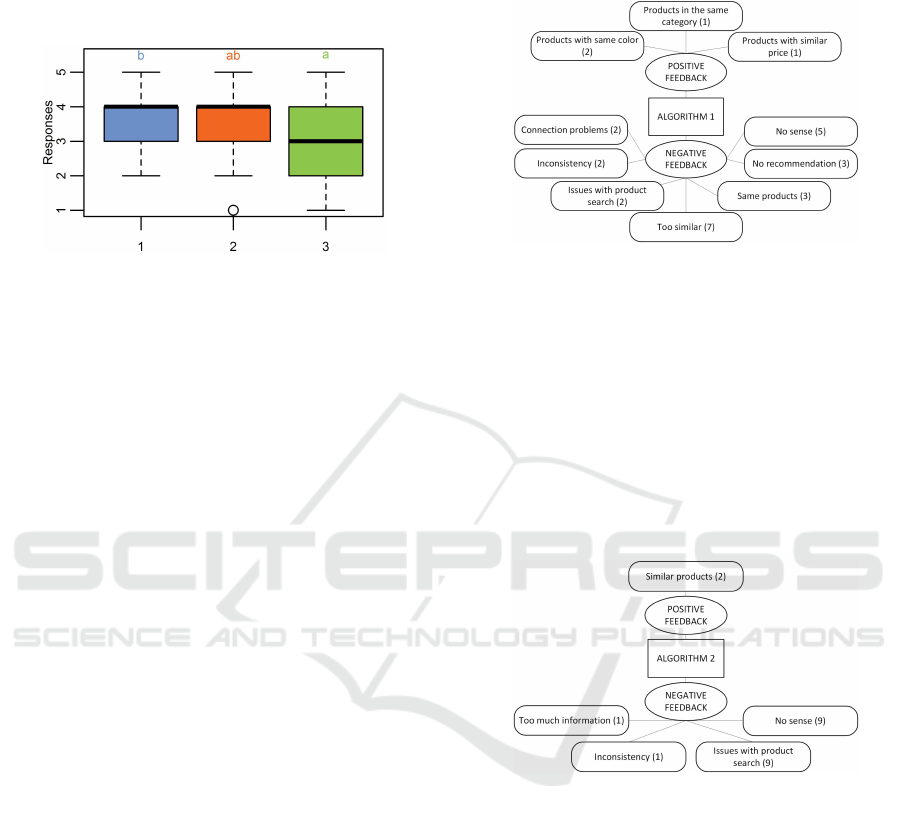
tween Algorithms 2 and 3 (p > 0.05). However, there
was a significant difference between Algorithms 1
and 3 (p < 0.05). The box plot graph in (Figure 3)
confirms this information.
Figure 3: Box Plot of the users’ answers regarding Question
5 and Algorithms 1, 2, and 3.
We hence conclude that Algorithm 2 was as good
as Algorithm 1 regarding finding interesting furniture
efficiently, but Algorithm 3 is not as good as Algo-
rithm 1.
5.1.6 Overall Satisfaction
Regarding the responses for overall satisfaction eval-
uation, Algorithm 1 presented a mean of 3.17, Al-
gorithm 2 presented 3.28 and Algorithm 3 presented
2.50.
The ANOVA test showed no significant difference
among the means of answers (F(2, 65) = 2.90, p >
0.05). We thus consider that there is no difference
between algorithms regarding the users’ overall sat-
isfaction.
5.1.7 Open-ended Question Analysis
The quantitative analysis of responses might be com-
plemented and explained by the qualitative analysis of
the open-ended question. For each algorithm, we cre-
ated a thematic network showing the codes obtained
directly from the answers. The numbers shown in the
rounded-corner rectangles show how many times the
theme appeared in the responses.
Figure 4 shows the thematic network for Algo-
rithm 1. We observed that users enjoyed receiv-
ing the recommendation of similar products (with
the same colors, prices or comprising the same cat-
egory). On the other hand, users complained that
products were too similar or equal to the one they
had searched. Algorithm 1 also presented connection
problems and, sometimes, did not recommend prod-
ucts. Users also complained that recommendations
were good for some products and bad for the oth-
ers (inconsistency). The “no sense” theme represents
users that pointed out that the recommended products
had nothing to do with their needs.
Figure 4: Thematic network of answers to open-ended ques-
tion and Algorithm 1.
When analyzing the positive and negative feed-
back for Algorithm 2 (Figure 5), we observed that
users also enjoyed receiving the recommendation of
similar products. Negative feedback was mainly re-
lated to products that made no sense to users. This ex-
periment showed an interesting result, as users com-
plained about the product search as if it were the prod-
uct recommendation. Users also pointed out that there
were recommendations that were inconsistent, as for
Algorithm 1.
Figure 5: Thematic network of answers to open-ended ques-
tion and Algorithm 2.
Algorithm 3 got positive feedback on similar
products and some positive feedback on comple-
mentary products recommendation (Figure 6). Most
users’ complaints concerned recommended products
that made no sense. There were also issues with
search – as for Algorithm 2. There were also themes
related to inconsistency and too much information
shown. Users also complained of having recommen-
dations that were not related to a category of the prod-
uct they sought.
5.2 Hypotheses Analysis
Aiming at comparing three different recommendation
algorithms regarding user satisfaction, we proposed
ICEIS 2017 - 19th International Conference on Enterprise Information Systems
718
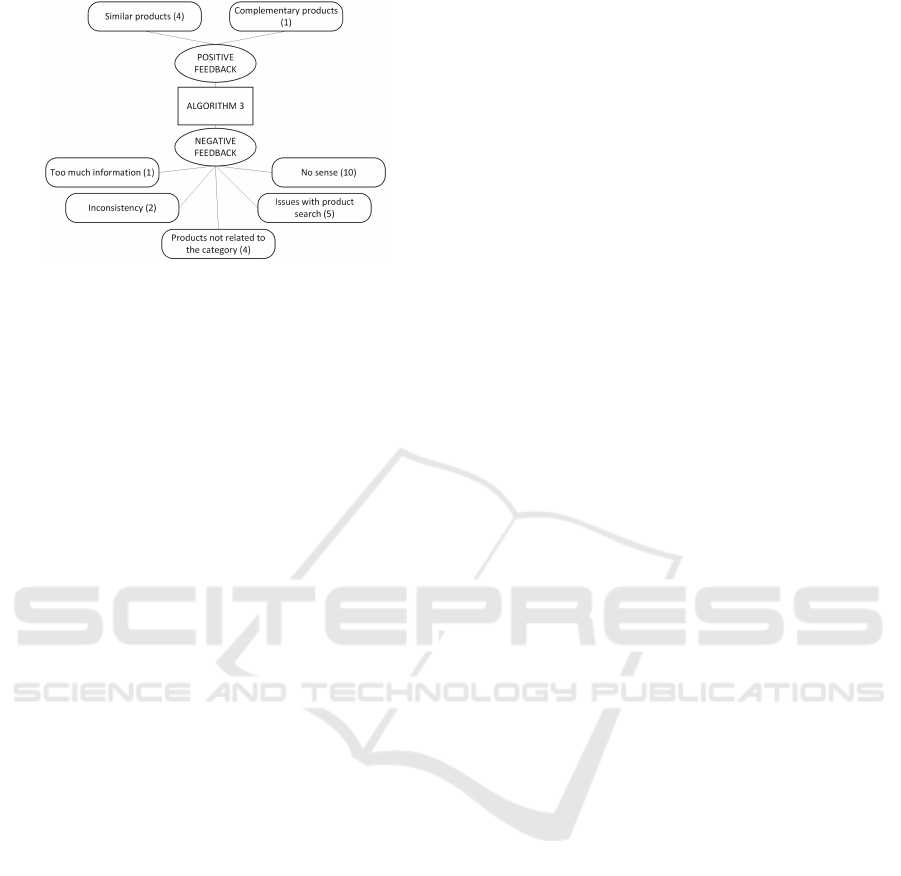
Figure 6: Thematic network of answers to open-ended ques-
tion and Algorithm 3.
to verify three hypotheses (see Section 4). In this sec-
tion, we combine quantitative and qualitative results
to confirm or not our hypotheses. Table 4 shows a
summary of the confirmation (or not) about the simi-
larity among algorithms, considering the satisfaction
aspects measured.
Our null hypothesis H01 stated that there is no sig-
nificant difference in user satisfaction by comparing
the recommendations received by Algorithm 1 with
the ones received by Algorithm 2. We consider we
confirmed this hypothesis since, for all the questions,
there was no significant difference between the an-
swers regarding Algorithms 1 and 2. By analyzing
our qualitative results, we observed that the main pos-
itive feedback for both algorithms was receiving sim-
ilar products as recommendation.
Our null hypothesis H02 stated that there is no sig-
nificant difference in user satisfaction by comparing
the recommendations received by Algorithm 1 with
the ones received by Algorithm 3. By analyzing our
summarized results in Table 4, we see that user satis-
faction was indeed different in three aspects: finding
products the user wants to view, capturing the right
category and finding interesting products efficiently.
This evidence refuses our hypothesis H02.
Qualitative data show that Algorithm 1 performed
better by presenting similar products and products re-
lated to the category. Users complained about the di-
versity of the recommendations of Algorithm 3.
For the null hypothesis H03, which stated that
there is no significant difference in user satisfaction
by comparing the recommendations received by Al-
gorithm 2 with the ones received by Algorithm 3, the
conclusion is the same as for hypothesis 2, as there is
difference when comparing Algorithm 2 to Algorithm
3. It refuses our third hypothesis.
The open-ended answers showed, however, that
both Algorithms 2 and 3 had problems when present-
ing products that made no sense to users and, also,
issues with product search and excessive information.
6 DISCUSSION
The objective of this study was to identify how differ-
ent recommendation algorithms trigger different per-
ceptions of satisfaction on users. We performed an ex-
periment with 68 undergraduate students, simulating
a three-item shopping transaction, and asking users to
evaluate the recommendations received. Users were
randomly assigned to one of three algorithms. Their
responses were statistically described and analyzed
using ANOVA and Tukey tests. All three algorithms
used the same database, with products and sales of a
small-retailer website.
We observed that, regarding overall satisfaction,
there was no difference on user satisfaction compar-
ing the three algorithms. When we tested each ques-
tion, we observed that Algorithm 1 performed better
for finding the furniture that the user wants to view,
for capturing the right category and for finding in-
teresting furniture efficiently. When analyzing the
open-ended question, we clearly see that users seem
to be more satisfied when similar products are recom-
mended, that is, our respondents did not value variety.
(Knijnenburg et al., 2012, p.450) state that “re-
searchers who do compare the user experience effects
of several algorithms find surprising results” – and
this was our case. We observed that although more
elaborate algorithms were compared to simple ones
(without computational intelligence), there was no ef-
fect on increasing user satisfaction. Our results con-
firm that – besides the algorithm implemented – there
are other subjective aspects comprising user satisfac-
tion (Xiao and Benbasat, 2007; Knijnenburg et al.,
2012).
Literature points that cold start is an issue to be
dealt with in small retailers websites. In these con-
texts, content-based recommendations are viable so-
lutions (Kaminskas et al., 2015). Our study confirms
this finding, by showing that our participants appre-
ciated receiving the recommendation of similar prod-
ucts.
We also observed that an expressive number of
participants – despite the instructions received to eval-
uate the products recommendation – also evaluated
the products search. For us, it is evidence that cus-
tomers might see search and recommendation as re-
lated functionalities. Developers should focus their
investment on improving both to increase user satis-
faction.
This study was performed in a context-specific
simulated environment, with undergraduate students,
which is a threat to validity. Although our participants
present a profile similar to that of Internet shoppers,
our results should be confirmed with real consumers.
Is Products Recommendation Good? An Experiment on User Satisfaction
719
Table 4: Summary of the similarity of user satisfaction perception among algorithms.
Question Algorithms considered similar
The system finds the furniture the user wants to view 1 and 2
The system filters out the furniture the user does not want 1, 2, and 3
The system captures the right category 1 and 2
The system captures the users interests 1, 2, and 3
The system finds interesting furniture efficiently 1 and 2
Overall satisfaction 1, 2, and 3
Nevertheless, this study still contributes to the litera-
ture on recommender systems evaluations that go be-
yond algorithmic accuracy, as claimed by (Konstan
and Riedl, 2012).
7 CONCLUSIONS
We presented the results of an experiment that aimed
at identifying how different recommendation algo-
rithms trigger different perceptions of satisfaction on
users. We tested three algorithms using the database
of a real furniture small-retailer.
Our results pointed out no significant difference in
user satisfaction regarding the compared algorithms.
Algorithms were found to be generally similar, al-
though some difference was observed in specific is-
sues. In this case, the algorithm which showed similar
products performed better.
Future studies should focus on including a
content-based algorithm in the experiment to be com-
pared with collaborative filtering algorithms. We also
plan to reduce our threat to validity, by including sat-
isfaction evaluation with on-line users in their real
context.
REFERENCES
Apache (2016). Apache Mahout: Scalable Machine Learn-
ing and Data Mining. http://mahout.apache.org/.
Attridge-Stirling, J. (2001). Thematic networks: an analytic
tool for qualitative research. Qualitative Research,
1(3):385–405.
Bobadilla, J., Ortega, F., Hernando, A., and Guti´errez, A.
(2013). Recommender systems survey. Knowledge-
Based Systems, 46:109–132.
Dabholkar, P. A. and Sheng, X. (2012). Consumer partici-
pation in using online recommendation agents: effects
on satisfaction, trust, and purchase intentions. Service
Industries Journal, 32(9):1433–1449.
Herlocker, J., Konstan, J. A., Terveen, L. G., and Riedl, J. T.
(2004). Evaluating collorative filtering recommender
systems. ACM Transactions on Information Systems,
22(1):5–53.
Isinkaye, F. O., Folajimi, Y. O., and Ojokoh, B. A. (2015).
Recommendation systems : Principles , methods and
evaluation. Egyptian Informatics Journal, pages 261–
273.
Jiang, Y., Shang, J., and Liu, Y. (2010). Maximizing cus-
tomer satisfaction through an online recommendation
system: A novel associative classification model. De-
cision Support Systems, 48(3):470–479.
Kaminskas, M., Bridge, D., Foping, F., and Roche, D.
(2015). Product recommendation for small-scale re-
tailers. Lecture Notes in Business Information Pro-
cessing, 239:17–29.
Knijnenburg, B. P., Willemsen, M. C., Gantner, Z., Soncu,
H., and Newell, C. (2012). Explaining the user expe-
rience of recommender systems. pages 441–504.
Konstan, J. and Riedl, J. (2012). Recommender systems:
From algorithms to user experience. User Modeling
and User-Adapted Interaction, 22:101–123.
Lemire, D. and Maclachlan, A. (2005). Slope One Predic-
tors for Online Rating-Based Collaborative Filtering.
Society for Industrial and Applied Mathematics, pages
471–475.
Li, S. S. and Karahanna, E. (2015). On line Recommen-
dation Systems in a B2C E-Commerce Context : A
Review and Future Directions . Journal of the Associ-
ation for Information Systems, 16(2):72–107.
Liang, T.-P., Lai, H.-J., and Ku, Y.-C. (2006). Personalized
Content Recommendation and User Satisfaction: The-
oretical Synthesis and Empirical Findings. Journal of
Management Information Systems, 23(3):45–70.
Montgomery, D. C. (2009). Design and Analysis of Exper-
iments. John Wiley and Sons Inc., New Jersey, 7th
edition.
Pazzani, M. J. and Billsus, D. (2007). Content-Based Rec-
ommendation Systems. The Adaptive Web, 4321:325–
341.
Schafer, J., Frankowski, D., Herlocker, J., and Sen, S.
(2007). Collaborative Filtering Recommender Sys-
tems. The Adaptive Web, pages 291–324.
Srinivasan, S. S., Anderson, R., and Ponnavolu, K. (2002).
Customer loyalty in e-commerce: An exploration of
its antecedents and consequences. Journal of Retail-
ing, 78(1):41–50.
Thongpapanl, N. and Ashraf, A. R. (2011). Enhancing on-
line performance through website content and person-
alization. Journal of Computer Information Systems,
Fall 2011:3–13.
Xiao, B. and Benbasat, I. (2007). E-Commerce Product
Recommendation agents :Use, Characteristics, and
Impact. MIS Quarterly, 31(1):137–209.
ICEIS 2017 - 19th International Conference on Enterprise Information Systems
720
