
Study on Depression Evaluation Indicator in the Elderly
using Sensibility Technology
Masakazu Higuchi
1
, Shuji Shinohara
1
, Mitsuteru Nakamura
1
, Yasuhiro Omiya
2
, Naoki Hagiwara
2
,
Shunji Mitsuyoshi
1
and Shinichi Tokuno
1
1
Verbal Analysis of Pathophysiology, Graduate School of Medicine, The University of Tokyo, Tokyo, Japan
2
Research and Product Development Department PST, Inc., Yokohama, Japan
Keywords:
Voice, Emotion Recognition, Depression, BDI.
Abstract:
Depression is important issue with aging of global population. Previously we have proposed a method to
evaluate the mental health status of a person by his or her voice and developed a smartphone-based system to
monitor mental health from voice during a call. Although the system has excellent continuous monitoring ca-
pability, it has not enough specificity for screening. Therefore, in this study we propose an evaluation indicator
to assess depression status in the elderly, based on multivariate analysis using the emotional components of
the voice data collected in the aforementioned system and the BDI score. The voice emotion data on subjects
was divided into two groups according to BDI score, one where doctor’s diagnosis was deemed necessary and
the other not so. A significant difference between the two groups was observed in t-test when the mean of the
evaluation indicator estimated using data of each group and applying logistic regression prediction equation
was compared. Moreover, a performance corresponding to AUC of approximately 0.75 was achieved in the
ROC curve of the derived evaluation indicator. The results suggest that a new method to evaluate depression
using voice has likely been developed.
1 INTRODUCTION
In recent years, the aging of popula-
tion has become remarkable in the world
(World Population Ageing: 1950–2050, nd).
A disease that is as prevalent as dementia in the
elderly is depression, which results from various fac-
tors such as declining physical abilities, anxiety about
health, bereavement with a friend, and loneliness due
to living alone (Beekman et al., 1999).
In screening patients with mental disorders, self-
administered psychological tests such as General
Health Questionnaire (GHQ) (Goldberg, 1978) and
Beck Depression Inventory (BDI) (Beck et al., 1961)
are generally used. Although self-administered psy-
chological tests are relatively easy because they are
non-invasive, the effect of reporting bias cannot be
eliminated. Reporting bias refers to the responder’s
tendency to selectively over- or under-evaluate certain
information, consciously or unconsciously (Delgado-
Rodriguez and Llorca, 2004).
On the other hand, as pioneer researchers the au-
thors have been developing methods to assess mental
health status such as depression or stress using voice
(Tokuno et al., 2014; Shinohara et al., 2016). Analy-
sis using voice has benefits such as, it is noninvasive,
does not need any specialized device, and can be con-
ducted remotely with ease. The authors focused on
the voice pattern in conversations in daily life during
telephone calls, and developed the Mind Monitoring
System (MIMOSYS) (Omiya et al., 2016) that can
monitor the mental health status based on voice dur-
ing telephone calls using smartphones equipped with
application implementing our voice analysis method
developed. It is expected to prevent occurrence of
mental health problems through monitoring of mental
health on a daily basis using the system. MIMOSYS
uses Sensibility Technology (ST) (Mitsuyoshi, 2015)
and generates output of quantified mental health sta-
tus from the voice. ST estimates utterer’s emotions
from change patterns of fundamental frequency of
voice during conversation, that is, ST analyzes change
patterns of fundamental frequency in voice and cal-
culates degrees of emotions, “Calmness”, “Anger”,
“Joy”, “Sorrow” and “Excitement,” included in the
voice. Based on ST analysis of emotions, MIMOSYS
outputs a number called “Vitality” that denotes the
health status immediately after the telephone call and
70
Higuchi, M., Shinohara, S., Nakamura, M., Omiya, Y., Hagiwara, N., Mitsuyoshi, S. and Tokuno, S.
Study on Depression Evaluation Indicator in the Elderly using Sensibility Technology.
DOI: 10.5220/0006316700700077
In Proceedings of the 3rd International Conference on Information and Communication Technologies for Ageing Well and e-Health (ICT4AWE 2017), pages 70-77
ISBN: 978-989-758-251-6
Copyright © 2017 by SCITEPRESS – Science and Technology Publications, Lda. All rights reserved

another number called “Mental Activity” that denotes
the mid- to long-term health status. By monitoring
of the change of Mental Activity, MIMOSYS will
give the user a warning to need medical consultation
at hospital. The user may perceive own health con-
dition and lead to self-recovery form the monitoring
data for MIMOSYS. In a previous study, it has been
reported (Hagiwara et al., 2016) that there is a corre-
lation between Mental Activity and BDI score, but in
a separate study (unpublished) by the authors it was
observed that the correlation is not always evident,
which calls for utmost care and improvement in ac-
curacy in operation.
2 PURPOSE
The purpose of this study is to propose a voice eval-
uation indicator that is different from Mental Activ-
ity, and enables more accurate screening of depres-
sion status in elderly patients.
3 METHOD
3.1 Target
3.1.1 Subjects
Subjects aged 65 years or older were selected from
the MIMOSYS users. This reason is that the World
Health Organization (WHO) defines people over 65
years old as the elderly.
MIMOSYS is a publicly available smartphone ap-
plication. In the current system, the participants are
anonymized and registered in a dedicated server with
individual IDs assigned after obtaining consent re-
garding participation in the study. The attribute data
such as age were recorded based on questionnaire re-
sponses. Whenever the participants use the smart-
phone for a call, the results of analysis are sent to the
server for consecutive recording. The analysis results
include the emotional component and Mental Activ-
ity. The voice data is temporarily stored in the smart-
phone during a call, and as soon as the call ends the
data are analyzed, and the voice data are immediately
deleted after sending the analysis results to the server.
In this study, the analysis was done using the data
collected from July 20, 2015, the day MIMOSYS was
publicly released, to July 20, 2016. During this pe-
riod, the application was downloaded approximately
3000 times, and there were 1456 users who consented
with participation in the study, completed the ques-
tionnaire during registration, and actually made more
Table 1: The detail of the whole valid user.
Male Female Total
Age
16–19 22 27 49
20-29 155 147 302
30-39 235 142 377
40-49 242 141 383
50-59 165 74 239
60-64 39 12 51
65-69 20 8 28
70-74 2 2 4
75-79 2 1 3
Total 882 554 1436
than one call. The number of users was 1436 exclud-
ing those for whom data could not be appropriately
collected because of call disturbances, or who used
a simplified questionnaire distributed as a part of as-
sistance after the Kumamoto earthquake. The reason
why users who answer the questionnaire to support
Kumamoto earthquake victims were excluded, is be-
cause the after-mentioned BDI questionnaire was not
carried out. Among these users, 35 were aged 65
years or older. Table 1 shows the detail of the whole
valid user.
With respective to age, the means of male and
female were 40.90(SD = 12.19) and 37.43(SD =
12.23), respectively. The youngest and eldest of male
were 16 and 76, respectively. The youngest and eldest
of female were 16 and 75, respectively.
3.1.2 BDI Score
In MIMOSYS, BDI questionnaire survey is under-
taken on the smartphone every three months after the
users start using the system, and the resulting scores
are also recorded in the same server. In the analysis
for the study, among the 35 users (aged 65 years or
older), only those who made a call within two weeks
after completing the BDI questionnaire were selected.
The reason why data was considered valid within two
weeks after the BDI questionnaire, is because it is
commonly believed that the depression state persists
for at least two weeks, according to the diagnosis cri-
teria for depression in DSM-IV (Diagnostic and sta-
tistical manual of mental disorders IV, 1994). For
users who undertook the BDI questionnaire several
times, the data collected within two weeks after each
questionnaire participation were analyzed. In the end,
valid BDI score data were collected 40 times from 32
Study on Depression Evaluation Indicator in the Elderly using Sensibility Technology
71

users.
The verification was conducted by dividing the
users into two groups: clinical depression group
where the BDI score was 17 or above suggesting a
state that necessitates diagnosis by a doctor, and the
normal group where the BDI score was less than 17.
This BDI score threshold is clinically considered to
be the boundary value for indicating depression state
(Beck’s Depression Inventory, nd). Four users were
in the former group, and 28 were in the latter.
3.1.3 Voice Data
From the aforementioned 32 users, 671 valid voice
data samples were collected within two weeks after
completing the BDI questionnaire. The data sam-
ples collected for the clinical depression group and
the normal group were 50 and 621, respectively.
3.2 Emotion Analysis
MIMOSYS estimates the mental health level based
on emotional components in the voice. The five emo-
tions analyzed in MIMOSYS are Calmness, Anger,
Joy, Sorrow, and Excitement calculated by ST, and the
degree of each component is estimated in real num-
bers with a range of [0, 1]. Value 0 means that an
input voice does not include the emotion at all. Value
1 means that an input voice includes the emotion most
certainly.
The minimum unit of voice emotion analysis by
MIMOSYS is an “utterance,” which means continu-
ous voice divided by breathing. Practically, start of
an utterance is detected when it changed from silent
state to uttering state and uttering state continued for
certain duration. End of utterance is detected when
it changed from uttering state to silent state for cer-
tain duration. Whether the state is silent or uttering is
decided by thresholding the amplitude of time wave-
form of an input voice.
3.3 Logistic Regression
In the logistic regression analysis (Agresti, 2012),
clinical depression group and normal group were rep-
resented using the qualitative numerical values of 1
and 0, respectively. These numerical values are like
labels for distinguishing between the two groups, and
they are assigned to the dependent variable when per-
forming logistic regression analysis.
Instead of a straight line, a logistic curve is fitted
to the model in logistic regression analysis. Assuming
the dependent variable to be Y, and the independent
variables as X
1
, X
2
, . . . , X
n
, the following prediction
equation is obtained:
Y =
1
1+ exp(−α
0
− α
1
X
1
− α
2
X
2
− ··· − α
n
X
n
)
(1)
In the present study, the following variables were
used:
Y = (Depression state),
X
1
= (Calmness), X
2
= (Anger),
X
3
= (Joy), X
4
= (Sorrow), X
5
= (Excitement)
(2)
where, depression state is the qualitative numerical
value obtained by thresholding the BDI score, and
Calmness / Anger / Joy / Sorrow / Excitement are
values obtained from analysis in MIMOSYS. In the
analysis, emotional data for each call along with BDI
score obtained within the immediate prior 2 weeks,
were combined into one data set.
The performance of the prediction equation ob-
tained from the analysis was evaluated using the sen-
sitivity, specificity, and area under the curve (AUC)
of the receiver operating characteristics (ROC) curve
where cutoff point for the BDI score was set to 17.
Free software R (version 3.3.2) was used in the
statistical analysis.
4 RESULTS
4.1 BDI Score and Number of Calls
The minimum and maximum of BDI scores were 0
and 28, respectively, with a mean of 8.53, and stan-
dard deviation of 6.50.
The average of number of calls per person within
2 weeks after completing BDI was 16.78, with a stan-
dard deviation of 25.66.
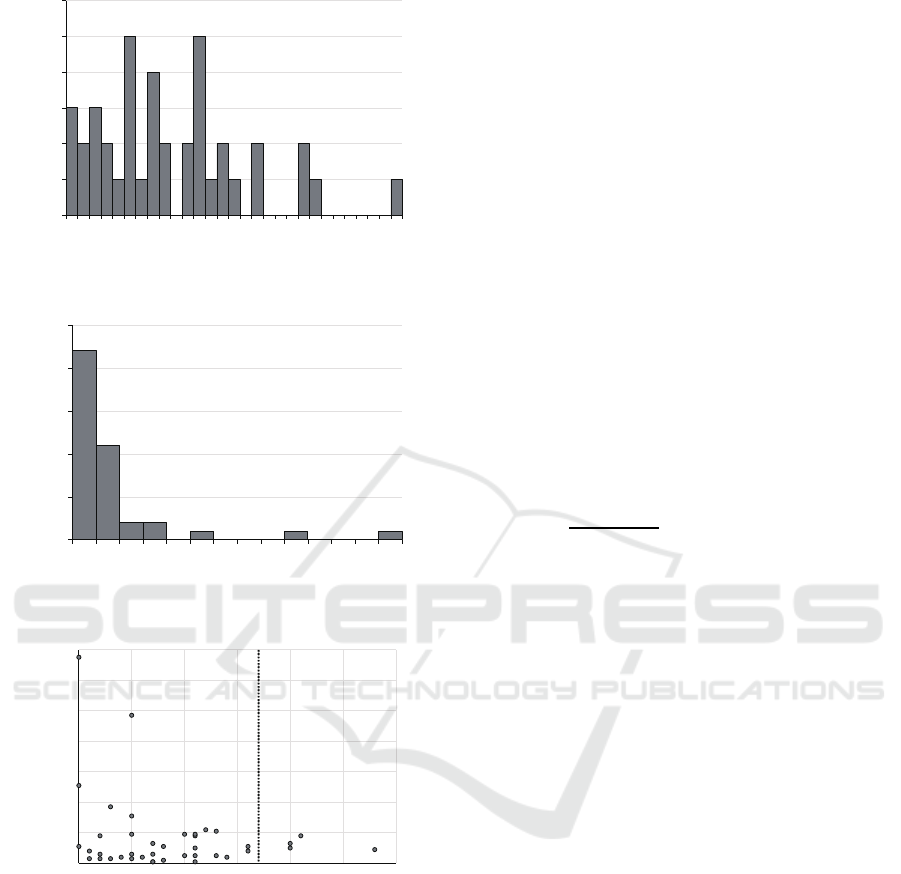
Figure 1 and 2 show histograms of the BDI score
and the number of calls, respectively. BDI scores less
than 17 were distributed uniformly in 28 users, but
BDI scores of 17 or above were distributed sparsely
since only 4 users had these scores (see in Figure 1).
The number of calls was concentrated from 0 to 20
(see in Figure 2).
Figure 3 shows the scatter plot of BDI score and
number of calls. The correlation coefficient between
the BDI score and the number of calls was −0.24, a
weak correlation was not found because significance
was not observed in the p value by using the t value
(t(38) = −1.55, p > 0.1).
4.2 Distribution of Emotional
Components
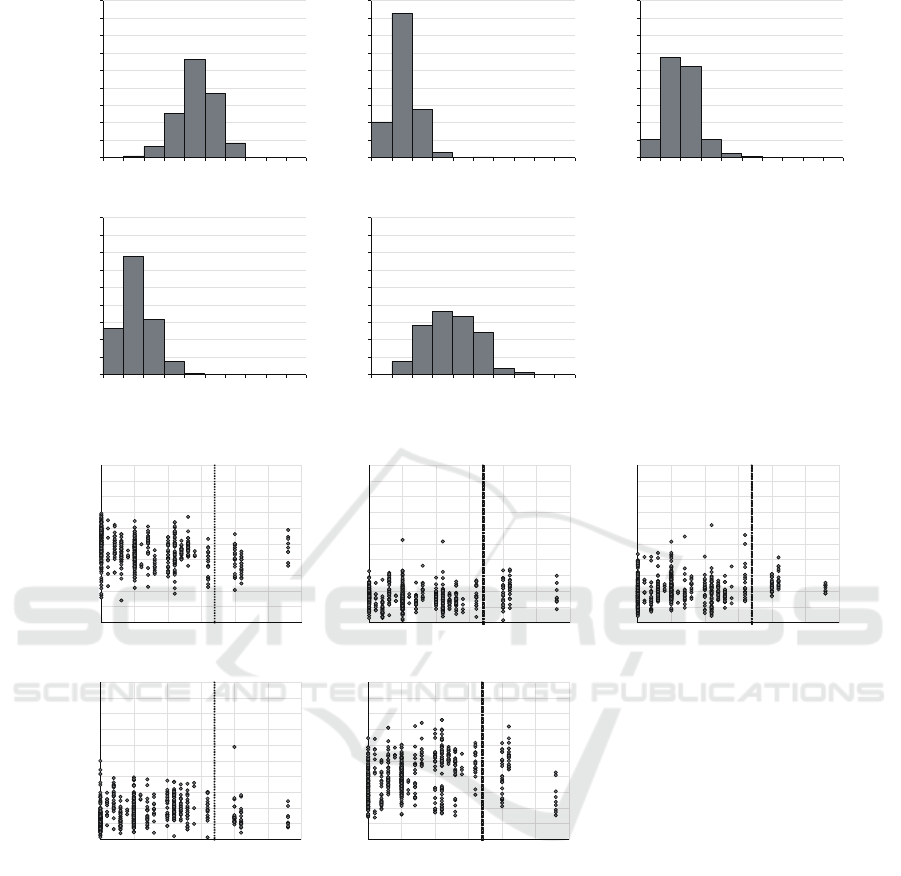
Figure 4 shows histograms of emotional components.
Voices used in this analysis tended to contain many
ICT4AWE 2017 - 3rd International Conference on Information and Communication Technologies for Ageing Well and e-Health
72
0
1
2
3
4
5
6
0 2 4 6 8 10 12 14 16 18 20 22 24 26 28
Frequency
BDI score
Figure 1: The histogram of BDI score.
0
5
10
15
20
25
10 20 30 40 50 60 70 80 90 100 110 120 130 140
Frequency
The number of calls
Figure 2: The histogram of number of calls.
0
20
40
60
80
100
120
140
0 5 10 15 20 25 30
The number of calls
BDI score
Normal
Clinical
depression
17
Figure 3: The scatter plot of BDI score and number of calls.
components of Calmness and Excitement, and to con-
tain less components of Anger, Joy and Sorrow.
Figure 5 shows scatter plots of BDI score and
emotional components. Correlation coefficients be-
tween the BDI score and emotional components
(Calmness, Anger, Joy, Sorrow and Excitement) were
−0.30, 0.042, 0.16, 0.17 and 0.31, respectively, and
weak correlations were found in all emotional compo-
nents except for Anger because significances were ob-
served in the p values by using the t values (Calmness:
t(669) = −8.21, p < 0.01, Joy: t(669) = 4.19, p <
0.01, Sorrow: t(669) = 4.42, p < 0.01, Excitement:
t(669) = 8.33, p < 0.01). For each emotional com-
ponent in Figure 5, the equality of variances and the
difference of means between the normal and clinical
depression groups were evaluated using F test and t-
test, respectively. The result is shown in Table 2. Sig-
nificant statistical differences were observed in evalu-
ation by t-test in all emotional components except for
Sorrow.
4.3 Regression Coefficient
Table 3 shows the results of logistic regression analy-
sis combined with selection of independent variables.
In the table, “Estimate” shows the coefficients
for the independent variables in the prediction equa-
tion (1). Using variable selection, the four vari-
ables X
2
(Anger), X
3
(Joy), X
4
(Sorrow), and
X
5
(Excitement) were selected, whereas the vari-
able, X
1
(Calmness) was removed because it did not
contribute to the prediction of Y (Depression state).
Therefore, the coefficient for X
1
is 0 and the predic-
tion equation is given by,
Y =
1
1+ exp(Z)
, where
Z = 6.52 − 13.04X
2
− 10.63X
3
− 6.67X
4
+ 4.35X
5
(3)
4.4 Distribution of Predicted Values
Applying the prediction equation (3), and using the
emotion components of voice, it is possible to esti-
mate the probability of being included in the group
requiring diagnosis by a doctor. This estimated value
is defined as the “Depression Evaluation Indicator
(DEI)” for the elderly. Figure 6 shows the mean of
the values estimated using the prediction equation (3)
with data for each group. The error bars in the chart
show the standard deviation.
Significant statistical difference was not observed
in evaluation of estimated values for each group using
F test of equality of variances. Regarding mean of the
estimated values, significant statistical difference was
observed in evaluation by t-test that assume equality
of variance. Table 4 shows the results of F test and
t-test for the data shown in Figure 6.
4.5 ROC curve
Figure 7 shows the ROC curves corresponding to DEI
and Vitality of MIMOSYS. In the Figure 7, the solid
line and the dot line show curves of DEI and Vitality
of MIMOSYS, respectively.
The AUCs for ROC curves of DEI and Vitality of
MIMOSYS were 0.76 and 0.64, respectively.
Study on Depression Evaluation Indicator in the Elderly using Sensibility Technology
73
0
50
100
150
200
250
300
350
400
450
0.1 0.2 0.3 0.4 0.5 0.6 0.7 0.8 0.9 1
Frequency
Calmness
0
50
100
150
200
250
300
350
400
450
0.1 0.2 0.3 0.4 0.5 0.6 0.7 0.8 0.9 1
Frequency
Anger
0
50
100
150
200
250
300
350
400
450
0.1 0.2 0.3 0.4 0.5 0.6 0.7 0.8 0.9 1
Frequency
Joy
0
50
100
150
200
250
300
350
400
450
0.1 0.2 0.3 0.4 0.5 0.6 0.7 0.8 0.9 1
Frequency
Sorrow
0
50
100
150
200
250
300
350
400
450
0.1 0.2 0.3 0.4 0.5 0.6 0.7 0.8 0.9 1
Frequency
Excitement
Figure 4: Histograms of emotional components.
0
0.1
0.2
0.3
0.4
0.5
0.6
0.7
0.8
0.9
1
0 5 10 15 20 25 30
Calmness
BDI score
Normal
Clinical
depression
17
0
0.1
0.2
0.3
0.4
0.5
0.6
0.7
0.8
0.9
1
0 5 10 15 20 25 30
Anger
BDI score
Normal
Clinical
depression
17
0
0.1
0.2
0.3
0.4
0.5
0.6
0.7
0.8
0.9
1
0 5 10 15 20 25 30
Joy
BDI score
Normal
Clinical
depression
17
0
0.1
0.2
0.3
0.4
0.5
0.6
0.7
0.8
0.9
1
0 5 10 15 20 25 30
Sorrow
BDI score
Normal
Clinical
depression
17
0
0.1
0.2
0.3
0.4
0.5
0.6
0.7
0.8
0.9
1
0 5 10 15 20 25 30
Excitement
BDI score
Normal
Clinical
depression
17
Figure 5: Scatter plots of BDI score and emotional components.
As shown in Figure 7, the sensitivity and speci-
ficity at the point at which the perpendicular line to
the ROC curve of DEI from the slope line correspond-
ing to AUC = 0.5 is the longest, are 0.64 and 0.78
respectively, and the DEI threshold at this point was
0.089. The confusion matrix corresponding to this
threshold is shown in Table 5.
5 DISCUSSION
One of the limitations of this study was the scarcity of
data for validation. The most likely reason is that the
proportion of smartphone users in the elderly was not
high to begin with, and the number of users decreased
considerably when installing the application was nec-
essary to use it. The authors believe that new ways of
collecting data from the elderly needs to be studied in
the future.
Since the p values of the coefficients for the in-
dependent variables (corresponds to Pr(> |z|) in Ta-
ble 3) were statistically significantly small for all the
ICT4AWE 2017 - 3rd International Conference on Information and Communication Technologies for Ageing Well and e-Health
74
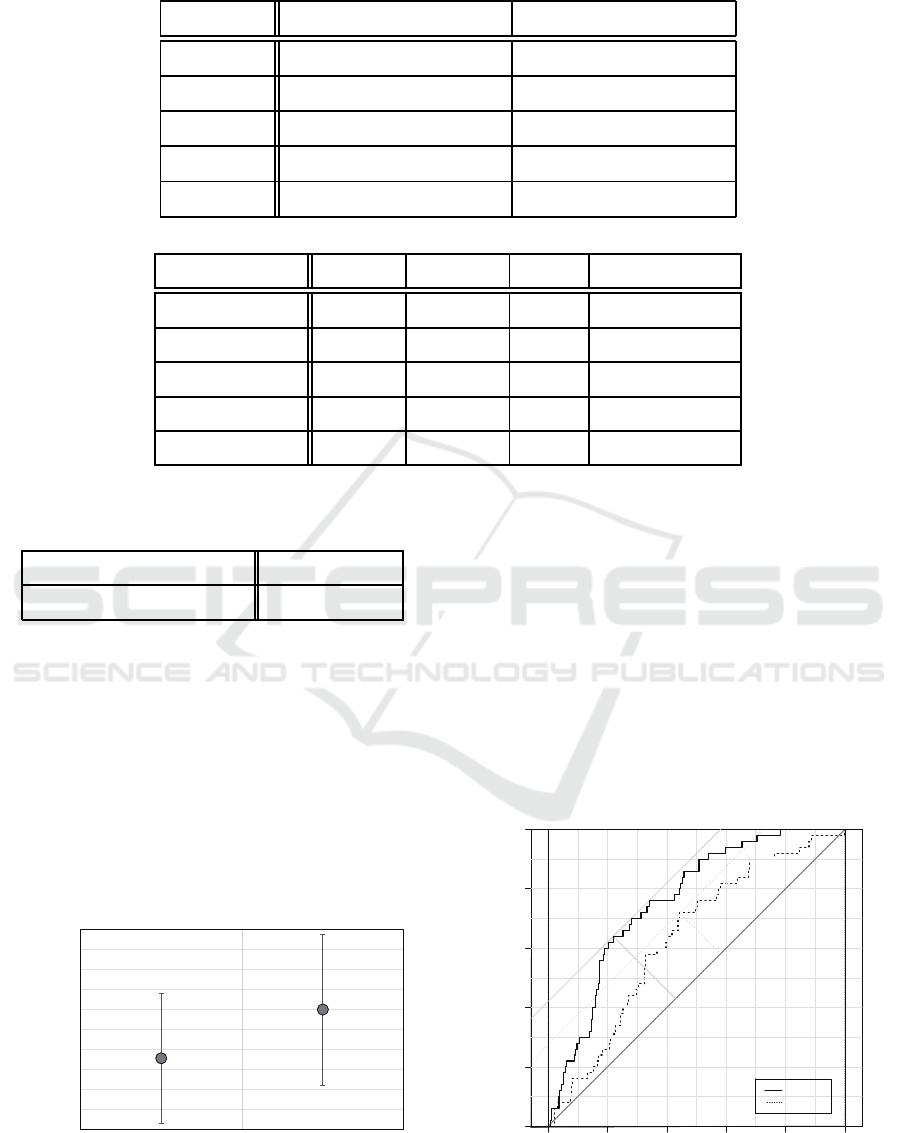
Table 2: P values for the F test and t-test between the normal and clinical depression groups in each emotional component.
P(F ≤ f) one-sided F test P(T ≤ t) two-sided t-test
Calmness 0.19 8.08× 10
−6
**
Anger 0.017 0.0012 **
Joy 6.41× 10
−5
9.85× 10
−8
**
Sorrow 0.28 0.062 n.s.
Excitement 0.10 0.044 *
Table 3: Logistic regression analysis results.
Estimate Std. Error z value Pr(> |z|)
Intercept −6.52 1.00 −6.53 6.62× 10
−11
**
X
2
(Anger) 13.04 3.21 4.06 4.84× 10
−5
**
X
3
(Joy) 10.63 2.55 4.17 3.00× 10
−5
**
X
4
(Sorrow) 6.67 3.06 2.18 0.029 *
X
5
(Excitement) −4.35 1.99 −2.19 0.029 *
Table 4: P values for the F test and t-test between the nor-
mal and clinical depression groups in depression evaluation
indicator.
P(F ≤ f) one-sided F test 0.057 n.s.
P(T ≤ t) two-sided t-test 6.01× 10
−7
**
selected variables (Anger / Joy / Sorrow / Excite-
ment), it was concluded that these were associated
with depression state in the elderly. Judging from the
magnitude of the coefficients, it is believed that Anger
and Joy components have strong effect on depression
state. Depression state is exhibited through symptoms
of being “anger prone and irritative”, and the obser-
vation that Anger component has a strong effect con-
curs with such symptoms. However, the observation
that Joy and not Sorrow has stronger effect on depres-
sion state does not concur with the usual symptoms
0
0.02
0.04
0.06
0.08
0.1
0.12
0.14
0.16
0.18
0.2
DEI
Normal
(BDI < 17)
Clinical depression
(BDI Ӎ 17)
Figure 6: Mean depression evaluation indicator in the two
groups.
of depression state. More validation in this regard is
necessary in the future.
The authors hypothesized that among the princi-
pal symptoms of depression state, Sorrow component
likely has the strongest association with depression
state, but the results obtained did not conform to this
hypothesis. A significant statistical difference in the
mean of Sorrow component was not also observed
between the clinical depression group and the nor-
mal group. One likely reason behind this may be the
lack of data on elderly users with a BDI score above
30. Since all the data for users in the doctor’s di-
agnosis required group was only about medium de-
gree of depression state, the Sorrow component effect
0.0 0.2 0.4 0.6 0.8 1.0
0.0 0.2 0.4 0.6 0.8 1.0
0.0 0.2 0.4 0.6 0.8 1.0
0.0 0.2 0.4 0.6 0.8 1.0
1 - Specificity
Sensitivity
DEI
Vitality
Figure 7: ROC curves for the depression evaluation indica-
tor and Vitality of MIMOSYS.
Study on Depression Evaluation Indicator in the Elderly using Sensibility Technology
75
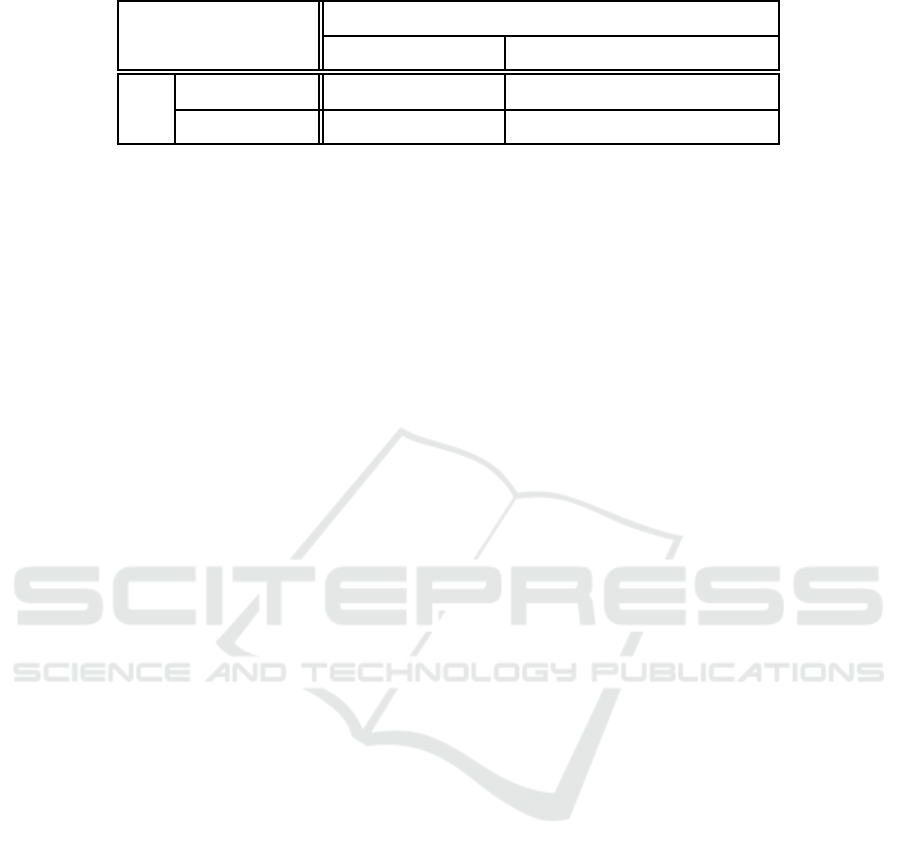
Table 5: Confusion matrix for DEI threshold.
BDI
Normal (BDI < 17) Clinical depression (BDI ≥ 17)
DEI
Low(< 0.089) 485 18
High(≥ 0.089) 136 32
may likely have been estimated to be low. This area
also needs further study in the future. In this anal-
ysis, it was judged that Calmness component did not
contribute to depression state despite a significant dif-
ference in the mean of the component was observed
between the clinical depression group and the normal
group. Because four emotions of Calmness / Anger /
Joy / Sorrow are outputted in percent, Calmness rises
relatively when emotions of Joy and Sorrow are sup-
pressed unless Anger changes. This factor may influ-
ence the judgment that Calmness component did not
contribute to depression state. This study is also a fu-
ture work.
It is observed that the prediction equation obtained
from the analysis did not exhibit a good fit with the
data. One likely reason behind this may be that the
BDI score used as the dependent variable in this study
was obtained from a self-administered psychological
test that reflected the users’ subjectivity, and the ef-
fects of reporting bias and subjective variation could
not be eliminated. However, as shown in Table 4,
since a significant statistical difference in the DEI
mean was observed between the clinical depression
group and the normal group, the authors believe that
this indicator may likely be used for screening elderly
patients with depression state. Further validation of
the accuracy of the prediction equation obtained from
this study by applying it to different sets of data, is
deemed necessary in the future.
It is also observed that the performance of DEI as
a classifier, based on sensitivity, specificity, and AUC
is not satisfactory. However, it showed higher classi-
fication performance than Vitality of MIMOSYS. In
the present study sensitivity refers to the proportion
of users with depression state predicted as depressed
based on DEI, and the specificity refers to the pro-
portion of healthy users predicted as healthy based on
DEI. Further studies to improve sensitivity and speci-
ficity are deemed necessary in the future.
There is a feature that emotional expression de-
creases in depression state. The authors have de-
veloped MIMOSYS based on the idea that the fea-
ture may be detected from emotional components
in the voice, and examined how emotional compo-
nents are involved in depression state in the present
study. The authors are considering collecting not only
voice but also action data and so on by using smart-
phones equipped with an acceleration sensor and in-
vestigating the relationship between depression state
and these data in the future.
On the other hand, voice features other than emo-
tional components may be also involved in depres-
sion state. OpenSMILE(Eyben et al., 2010) and
Praat(Boersma, 2001) are powerful tools for detecting
voice features, and they extract very many features
from voice in real time. It is also one of the future
works to select voice features related to depression
state by using these tools.
As conventional depression state detection ap-
proach using biometric information other than voice
obtained from various sensors, there are methods us-
ing heartbeat(Garcia et al., 2015), electroencephalo-
gram(Acharya et al., 2015), facial expression(Jan
et al., 2014), and so on. There are also methods using
saliva(Izawa et al., 2008) and blood(Sekiyama, 2007)
as invasive methods. It is also necessary to incorpo-
rate knowledge from these studies in the future.
6 CONCLUSION
This study proposed an evaluation indicator for esti-
mating the state of depression in the elderly, based
on multivariate analysis of BDI score and voice emo-
tion data collected from users registered in a system
that monitored the mental health based on voice data
from calls made using smartphones. Logistic regres-
sion analysis was performed by dividing the data for
the elderly subjects into two groups based on the BDI
score, one where doctor’s diagnosis was deemed nec-
essary and the other not so, and in t-test significant
statistical difference was observed between the two
groups regarding the mean of the evaluation indicator
calculated by applying the prediction equation to the
data of users in each group. Moreover, a performance
with AUC of approximately 0.75 was obtained in the
ROC curve for the estimated evaluation indicator.
These results suggest that the proposed evaluation
indicator may likely be effective in screening for de-
pression in the elderly.
ICT4AWE 2017 - 3rd International Conference on Information and Communication Technologies for Ageing Well and e-Health
76

ACKNOWLEDGEMENTS
This research is (partially) supported by the Center of
Innovation Program from Japan Science and Technol-
ogy Agency, JST.
REFERENCES
Acharya, U. R., Sudarshan, V. K., Adeli, H., Santhosh, J.,
Koh, J. E. W., Puthankatti, S. D., and Adeli, A. (2015).
A novel depression diagnosis index using nonlinear
features in eeg signals. European Neurology 2015,
74(1–2):79–83.
Agresti, A. (2012). Categorical Data Analysis. Wiley-
Interscience, New Jersey, 3rd edition.
Beck, A. T., Ward, C. H., Mendelson, M., Mock, J., and Er-
baugh, J. (1961). An inventory for measureing depres-
sion. Archives of General Psychiatry, 4(6):561–571.
Beekman, A. T., Copeland, J. R., and Prince, M. J.
(1999). Review of community prevalence of depres-
sion in later life. The British Journal of Psychiatry,
174(4):307–311.
Boersma, P. (2001). Praat, a system for doing phonetics by
computer. Glot International, 5:341–345.
Delgado-Rodriguez, M. and Llorca, J. (2004). Bias. Journal
of Epidemiology and Community Health, 58(8):635–
641.
Diagnostic and statistical manual of mental disorders IV
(1994). American Psychiatric Association.
Eyben, F., Wollmer, M., and Schuller, B. (2010). opens-
mile – the munich versatile and fast open-source au-
dio feature extractor. In Proceedings of the 18th ACM
international conference on Multimedia, pages 1459–
1462, Firenze.
Garcia, R. G., Valenza, G., Tomaz, C. A., and Barbieri, R.
(2015). Instantaneous bispectral analysis of heartbeat
dynamics for the assessment of major depression. In
Computing in Cardiology 2015, pages 781–784, Nice.
Goldberg, D. P. (1978). Manual of the General Health
Questionnaire. NFER Publishing, Windsor.
Hagiwara, N., Omiya, Y., Shinohara, S., Nakamura, M., Ya-
sunaga, H., Higuchi, M., Mitsuyoshi, S., and Tokuno,
S. (2016). Validity of the mind monitoring system as a
mental health indicator. In Proceedings of IEEE 16th
International Conference on BioInformatics and Bio-
Engineering, Taichung.
Izawa, S., Sugaya, N., Shirotsuki, K., Yamada, K. C.,
Ogawa, N., Ouchi, Y., Nagano, Y., Suzuki, K., and
Nomura, S. (2008). Salivary dehydroepiandrosterone
secretion in response to acute psychosocial stress
and its correlations with biological and psychological
changes. Biological Psychology, 79(3):294–298.
Jan, A., Meng, H., Gaus, Y. F. A., Zhang, F., and
Turabzadeh, S. (2014). Automatic depression scale
prediction using facial expression dynamics and re-
gression. In Proceedings of the 4th International
Workshop on Audio/Visual Emotion Challenge, pages
73–80, Orlando.
Beck’s Depression Inventory (n.d.). UC Davis Hu-
man Resources, ASAP Resources - Information
Sheets, <http:://www.hr.ucdavis.edu/asap/pdf
files/
Beck
Depression Inventory.pdf>.
World Population Ageing: 1950–2050 (n.d.). United Na-
tions Population Division.
Mitsuyoshi, S. (2015). Development of verbal analy-
sis pathophysiology. Econophysics, Sociophysics &
Other Multidisciplinary Sciences Journal, 5(1):11–
16.
Omiya, Y., Hagiwara, N., Shinohara, S., Nakamura, M.,
Mitsuyoshi, S., and Tokuno, S. (2016). Development
of mind monitoring system using call voice. In Pro-
ceedings of Neuroscience 2016, San Diego.
Sekiyama, A. (2007). Interleukin-18 is involved in alter-
ation of hipothalamic-pituitary-adrenal axis activity
by stress. In Society of Biological Psychiatry Annual
Meeting, San Diego.
Shinohara, S., Mitsuyoshi, S., Nakamura, M., Omiya,
Y., Tsumatori, G., and Tokuno, S. (2016). Valid-
ity of a voice-based evaluation method for effective-
ness of behavioural therapy. In Parvasive Comput-
ing Paradigms for Mental Health, 5th International
Conference, MindCare 2015, Milan, Italy, Septem-
ber 24–25, 2015, Revised Selected Papers, volume
604, pages 43–51. Springer International Publishing,
Switzerland.
Tokuno, S., Mitsuyoshi, S., Suzuki, G., and Tsumatori, G.
(2014). Stress evaluation by voice: a novel stress eval-
uation technology. In 9th International Conference on
Early Psychosis, pages 17–19, Tokyo.
Study on Depression Evaluation Indicator in the Elderly using Sensibility Technology
77
