
Sentinel-1 for Urban Areas
Comparison between Automatically Derived Settlement Layers from Sentinel-1
Data and Copernicus High Resolution Information Layers
Arthur Lehner
1,2
, Vahid Naeimi
3
and Klaus Steinnocher
1
1
AIT – Austrian Institute of Technology, Energy Department, Giefinggasse 2, 1210 Vienna, Austria
2
Department of Geoinformatics –Z_GIS, University of Salzburg, Schillerstraße 30, 5020 Salzburg, Austria
3
Department of Geodesy and Geoinformation, Vienna University of Technology, Research Group Remote Sensing E120.1,
Gußhausstraße 27–29, 1040 Vienna, Austria
Keywords: Remote Sensing, Sentinel-1, Impervious Surface, Copernicus.
Abstract: This work deals with the development of automatically derived settlement layers from Sentinel-1 data. The
produced layers allow differentiation between built-up and non-built-up area. The results are visually
compared with a standardized product of the Copernicus earth observation program, the Copernicus High
Resolution Layer Imperviousness Degree. For evaluation of the accuracy, the European Settlement Map 2016
was chosen as a reference data set. In this study the ISODATA unsupervised classification algorithm is used
for generating two layers that allow differentiation between built-up and non-built up area. The results reveal
the suitability of Sentinel-1 data for urban areas mapping. The quality of the produced settlement layers are
comparable to standardized products that are based on data from optical sensors e.g. Copernicus High
Resolution Layer Imperviousness Degree or European Settlement Map 2016 respectively.
1 INTRODUCTION
Land monitoring within Europe and the European
Union based on Earth Observation systems is
fundamental regarding its scientficial, cultural and
environmental impacts. With the agreement in 1985
to produce the first CORINE (EEA, 2000) land cover
(CLC), the foundation for a European land
monitoring program was laid. The programme
maintains a number of databases including an
inventory of land cover\land use (LCLU), produced
operationally for most areas of Europe on a 6 to 10
year cycle (Ben-Asher, 2013). The CLC program
later was incoporated in the European earth
observation program “Copernicus”. Founded in the
year 1998, Copernicus, previously known as GMES
(Global Monitoring for Environment and Security),
represents the European Programme for the
establishment of a European capacity for Earth
Observation.
Pan-European High Resolution Layers (HRLs)
provide information on specific land cover
characteristics, and are complementary to LCLU
mapping such as in the CORINE land cover (CLC)
datasets. The HRLs are generated from 20 m
resolution satellite imagery through a combination of
automatic processing and interactive rule based
classification (Sannier et al., 2016). Out of five layer
themes, the imperviousness layer presents the degree
of sealed soil as it captures the spatial distribution of
artificially sealed areas, including the level of sealing
of the soil per area unit. The layer represents in this
way a base map for various fields of research
(Ciobotaru et al., 2016; Lefebvre et al., 2015; Mücher
et al., 2015). Different applications using the
Copernicus Imperviousness Layer (Hennig et al.,
2015; Steinnocher et al., 2011) reveal its basic
necessity and usability.
Another available data product is the European
Settlement Map (ESM) 2016 that represents
percentage of built-up area coverage per spatial unit
using SPOT5 and SPOT6 satellite imagery from the
year 2012 (European Commission, 2017). The ESM
is a map expressing the proportion of the pixel area
covered by buildings, and it was produced in
2013/2014 (Florczyk et al., 2016). In addition to these
developments, the European commission recently
announced the provision of an information layer on
built-up presence. This information layer will be
Lehner, A., Naeimi, V. and Steinnocher, K.
Sentinel-1 for Urban Areas - Comparison between Automatically Derived Settlement Layers from Sentinel-1 Data and Copernicus High Resolution Information Layers.
DOI: 10.5220/0006320800430049
In Proceedings of the 3rd International Conference on Geographical Information Systems Theory, Applications and Management (GISTAM 2017), pages 43-49
ISBN: 978-989-758-252-3
Copyright © 2017 by SCITEPRESS – Science and Technology Publications, Lda. All rights reserved
43

derived from Sentinel-1 image collections (2016) and
resolution will be about 20 meters. Since these data
has not been available yet, it could not be considered
for a visual comparison nor an accuracy assessment
in this study.
By launching the Sentinel mission in 2014, the
European Space agency ESA aimed to satisfy the
need of the Copernicus program. Sentinel-1 is the first
of five missions that ESA developed for the
Copernicus initiative. Sentinel-1 comprises a
constellation of two polar-orbiting satellites
(Sentinel-1A, Sentinel-1B), operating day and night
performing C-band synthetic aperture radar imaging,
enabling them to acquire imagery regardless of
weather conditions or light conditions (D’Aria et al.,
2016).
This work presents the comparison of Sentinel-1
data used for the development of two automatically
derived settlement layers differentiating between
built-up and non-built up area and the Copernicus
high-resolution layer ‘Imperviousness Degree’ and
the European Settlement Map (ESM) 2016. In
contrast to CLC data that are confined for Europe,
satellites of the Sentinel mission collect data globally.
The Sentinel-1 data coverage makes it possible to
establish a global settlement layer.
2 DATA
This study uses Sentinel-1 image data, collected from
the first 7 months of the year 2016, the Compernicus
HRL imperviousness for the year 2012 and European
Settlement Map 2016. Additionally a Sentinel-2A
scene (date of acquisition: 02.07.2016) is used for
visual interpretation of the results.
2.1 Sentinel-1 Data
The Sentinel program is the most comprehensive and
ambitious European Earth Observation program. The
Sentinel satellites provide unique operational sensing
capabilities across the whole measurement spectrum,
covering a broad range of applications. Thanks to
their advanced sensing concepts and outstanding
spatio-temporal sampling characteristics, the Sentinel
satellites will collect more data than any earth
observation program before (Attema et al., 2007).
The first of the Sentinel satellite series, Sentinel-1A
was launched on 3 April 2014. Seninel-1 (S-1) is a
Synthetic Aperture Radar (SAR) mission for ocean
and land monitoring. S-1 is the continuity mission to
the SAR instruments flown on board of ERS and
ENVISAT. The S-1 mission is implemented through
a constellation of two satellites. The S-1B was
launched on 25 April 2016. The S-1 data over the land
masses are mainly acquired in Interferometric Wide
swath (IW) mode. The S-1 Level-1 Ground Range
Detected (GRD) products, which are suitable for the
most of the land applications, consist of focused SAR
data that has been detected, multi-looked and
projected to ground range using an Earth ellipsoid
model such as WGS84. The IW GRD products are
provided in two High (20 m x 22 m) and Medium (88
m x 87 m) spatial resolutions resampled to 10 m and
40 m pixel spacing grids respectively (European
Space Agency, 2013, p. 1).
Despite all corrections from Level-0 up to Level-1
data, the GRD data still need to be processed further
before generating level-2 products. The S-1 Level-1
GRD data used in this study were pre-processed using
the TU Wien SAR Geophysical Retrieval Toolbox
(SGRT) (Naeimi et al., 2016). The pre-processing
workflow include calibration, noise removal,
georeferencing and terrain correction using a Digital
Elevation Model (DEM), shadow mask generation,
data conversions, and data resampling and tiling to a
regular grid using an appropriate cartographic map
projection. For the calibration, georeferencing and the
terrain correction, the ESA’s Sentinel-1 toolbox
(S1TBX) is employed. The S1TBX operators are
called via SGRT to perform the georeferencing using
the S-1 precise orbit files provided externally by ESA.
In this study the S1TBX Range Doppler algorithm
and SRTM digital elevation data are used for terrain
correction of the SAR scenes. After some further
preprocessing steps like thermal noise removal, data
format conversion and shadow mask generation the
geocoded SAR scenes are resampled to the TU Wien
Equi7 Grid. The TU Wien Equi7 Grid is designed to
minimize the oversampling rate of the high resolution
satellite data globally, while keeping its structure
simple (Bauer-Marschallinger et al., 2014). After the
pre-processing step, the S-1 backscatter time series
were used to generate composites of monthly mean of
backscatter for each polarization separately over the
test site. In this study high resolution S-1 image stacks
collected from 7 months (January – July) of the year
2016 are used.
2.2 Copernicus High Resolution Layer
Imperviousness Degree
The HRL imperviousness is produced using an
automatic algorithm based on calibrated NDVI.
Similar to other HRLs of the Copernicus program, the
imperviousness HRL is derived from 20 m resolution
optical satellite imagery. The layer has 20 m
GISTAM 2017 - 3rd International Conference on Geographical Information Systems Theory, Applications and Management
44
geometric resolution and provides 101 classes of
imperviousness while:
0: all non-impervious areas
1-100: imperviousness values
254: unclassifiable (no satellite image available,
or clouds, shadows, or snow)
255: outside area (Langanke, 2013)
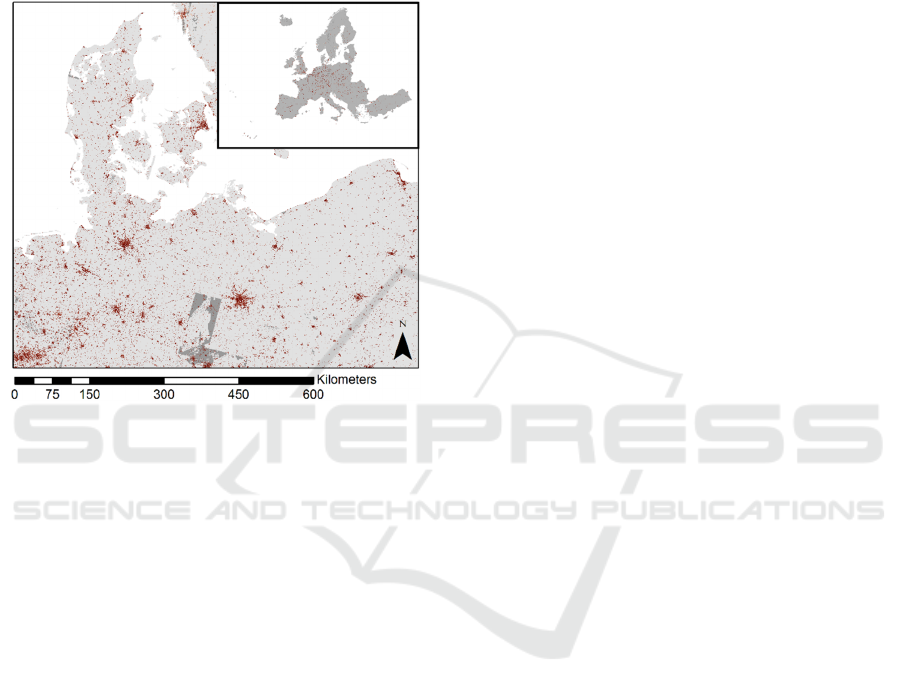
Figure 1: Coverage of the Copernicus HRL Imperviousness
degree, red = impervious surface, grey = no satellite image
available.
It is produced in a three years cycle and covers all
28 EU members (including United Kingdom) and 11
additional countries (Figure 1). The imperviousness
layer contains two products: a 2012 status layer
(degree of imperviousness 2012), as well as an
imperviousness density change layer (2009-2012),
based on the existing imperviousness product for
2009 (Langanke, 2013). In the presented study, we do
not consider the imperviousness density change layer.
2.3 European Settlement Map 2016
The European Settlement Map is a spatial raster
dataset with 10 meters resolution; an aggregated
version with 100 meters resolution is also available.
The ESM is mapping human settlements in Europe
based on SPOT5 and SPOT6 satellite imagery from
the year 2012. Similar to the Copernicus HRL it
covers all 28 EU members (including United
Kingdom) and 11 additional countries. For the ESM
a 95% accuracy for the built-up class is stated
(European Commission, 2017). Based on the
accuracy and its other properties, the ESM was
chosen as reference data for the accuracy assessment
of the automatically derived settlement layer (S-1
USC II).
2.4 Study Area
The selected test site is the city of Vienna
(coordinates: 48°12′N 16°22′E), the capital of
Austria. The terrain ranges from hilly in the west to
flat in the east of the city. Forest areas predominate
the west and agricultural areas are mainly found in the
east and southeast. The urban spectrum ranges from
single-family houses to high-rise buildings, covers
green houses and industrial areas.
3 METHODOLOGY
The objective of this study is to automatically derive
two settlement layers using Sentinel-1 image stacks.
The chosen method for this study is the ISODATA
unsupervised classification algorithm. The
ISODATA unsupervised classification algorithm
clusters many-variable data around points in the
data's original high- dimensional space and by doing
so provides a description of the data (Ball and Hall,
1965). In other words, the cluster analysis groups data
into objects – in our case pixel values – based only on
information found in the data that describes the
objects and their relationships. The objective is that
the pixel values within a group be similar (or related)
to one another and different from (or unrelated to) the
pixel values in other groups. The greater the similarity
(or homogeneity) within a group and the greater the
difference between groups, the better or more distinct
the clustering (Tan, 2006). In our case, a complete
clustering is performed since every pixel value is
assigned to a cluster.
The ISODATA unsupervised classification is
performed on a single image composite representing
the monthly mean of backscatter for a particular
polarization. Parameters used for the unsupervised
classification were:
no. of iterations: 20,
max. no. of clusters: 100,
initial no. of clusters: 10,
min. cluster size: 10 pixels.
This procedure is repeated for a stack of 5, 9 and 17
S-1 image composites. A final ISODATA
unsupervised classification is performed again on 17
S-1 image composites but changing the number of
iterations from 20 to 80 (S-1 USC). The result of the
classification/clustering does not lead to the creation
of a layer consisting of two classes, e.g. built-up and
Sentinel-1 for Urban Areas - Comparison between Automatically Derived Settlement Layers from Sentinel-1 Data and Copernicus High
Resolution Information Layers
45
non-built-up area, but instead an image layer is
created, where values correspond to a cluster ID. In
this way all pixels having the same value belong to
the same class/cluster (eCognition Developer 9.2,
2016).
This allows distinguishing of the pixels that have
values with high variance (non-built-up) from those
with low variance (built-up). Depending on the
parameters and the input S-1 image composites,
different numbers of clusters are generated. The
resulting clustered pixels are visually assigned to
classes “non-built up”, “impervious” and “built-up”.
The interim results are compared with each other
and the classification results are compared with the
Copernicus HRL Imperviousness degree of the year
2012. In order to classify and to quantitatively
compare the results from the clustering process with
the European Settlement Map 2016, a threshold is
definded. A Multi-Threshold Segmentation algorithm
is chosen to split the domain based on pixel values
(eCognition Developer 9.2, 2016). Image objects are
created and classified as “built-up”- and “non-built-
up” area respectively (Figure 6). A final layer (S-1
USC II) is created. Further the ESM layer is
aggregated to a 20 meters’ resolution. 500 points
randomly distributed across the study area are used to
assess the accuracy of the classes “built-up” and
“non-built-up”. The authors are aware of the fact that
the comparison of layers from different acquisition
years can be seen critically. However, the areas that
were selected for this study did not face severe
changes over the last 10 years. Furthermore, changes
in the buildings type (e.g. loft/attic conversion) within
the urban landscape do not impact the comparison.
4 RESULTS
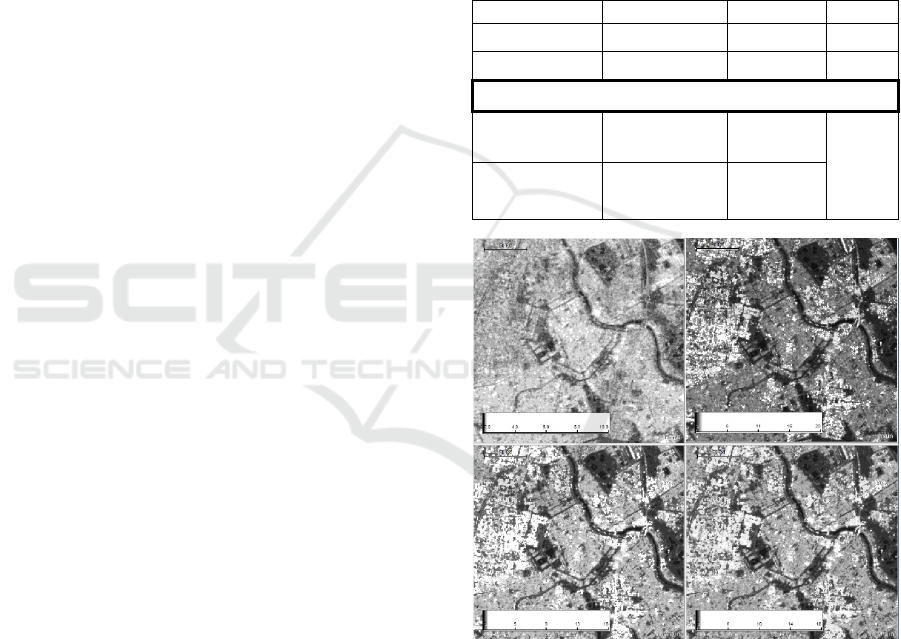
The objective of this research was to enhance the
differentiation between built-up and non-built-up
areas by including more S-1 image composites in the
analysis (Figure 2). In Figure 2., steady values are
represented by light gray while variant values are
represented by dark gray values.
By adding more input S-1 images the separation
between the built-up area class, impervious surface
and non-built area become more visable. The
ISODATA unsupervised classification (ICA) was
performed on an image stack consisting of 17 S-1 data
composites and resulted in a layer (S-1 USC) of 39
clusters (1-38). Each cluster was then assigned to a
certain class (built-up, impervious surface, non-built-
up) with a particular degree of imperviousness or
perviousness respectively using an optical Sentinel-
2A image as reference.
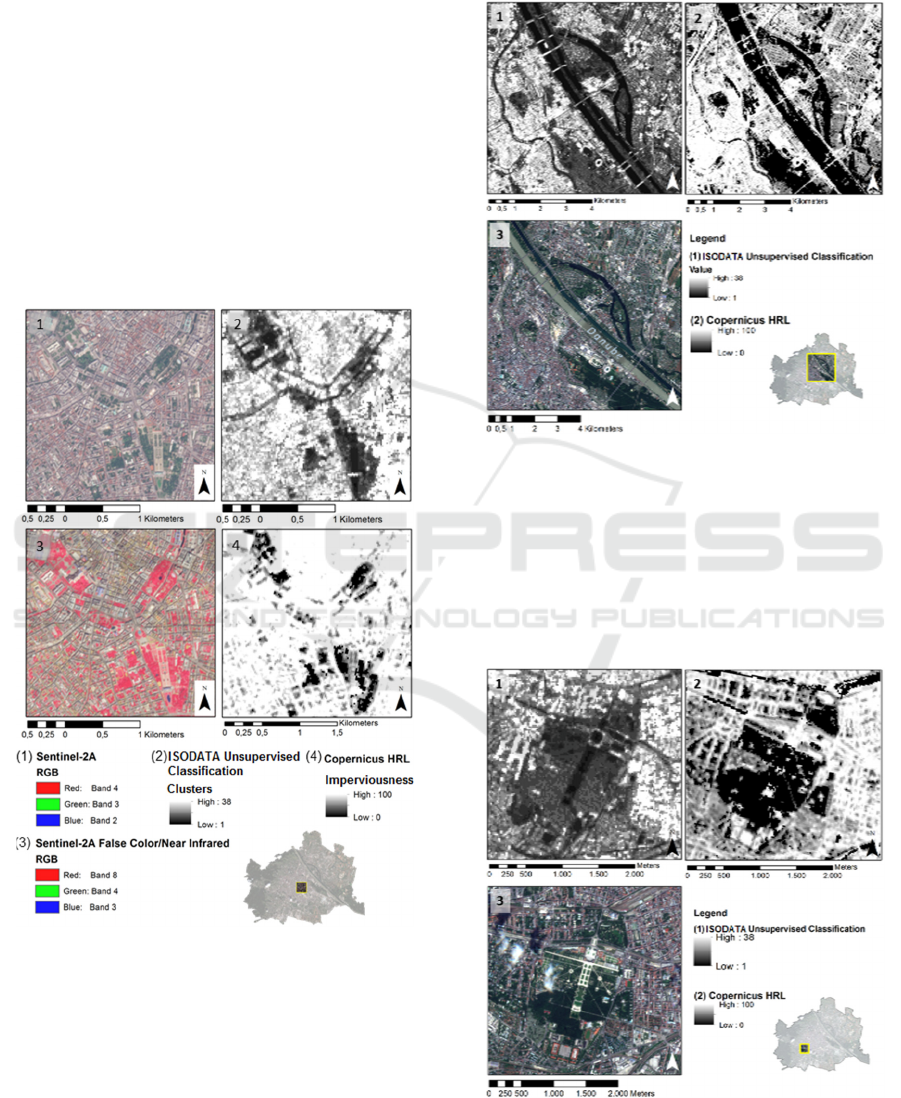
In Figure 3, the
produced layer S-1 USC and the
Copernicus HRL are visually compared. Figure 4 and
Figure 5 allows the comparison of the ISO-Clustering
results, the Copernicus HRL and the optical image
from Sentinel-2A. The results of the Multi-Threshold
Segmentation (S-1 USC II) are quantitatively
compared with the European Settlement Map 2016
(European Commission, 2017) that was used as
reference data. (Figure 6). The overall accuracy (OA)
of the final layer (S-1 USC II) is 78,2% (Table 1).
Table 1: Accuracy Assessment (S1- USC II).
Classification
Non Built-up Built-up
Totals
Non Built-up 272 69 341
Built-up 40 119 159
Totals
312 188 500
Producers
Accuracy
87,2% 63,3%
OA:
78,2%
Users Accuracy 79,8% 74,8%
Figure 2: Increasing of the contrast between steady (light
gray) and variant backscatter values (dark gray) by adding
more layers to the analysis. a) ISODATA unsupervised
classification (ICA) on 1 layer, polarization VH; b) ICA on
5 layers, mixed polarization (VH/VV); c) ICA on 9 layers,
mixed polarization (VH/VV); d) ICA on 17 layers, mixed
polarization (VH/VV).
GISTAM 2017 - 3rd International Conference on Geographical Information Systems Theory, Applications and Management
46
5 DISCUSSION
The results from the ISODATA unsupervised
classification reveal the possibility of mapping built-
up areas. In the produced layer S-1 USC, different
non-built up classes like urban parks, forest,
cemeteries and other spacious vegetated areas are
grouped and can particularly be distinguished from
built-up areas. Agricultural fields are also related
more acurately to non-built up areas, independent
from their degree of vegetation cover. Furthermore,
water bodies are classified as non-built-up areas
independent from its amount of algae, depth, water
quality or ground conditions. The “separation”
between built-up and non-built up areas is improved
by using more number of S-1 image composites.
Figure 3: Visual comparison of S-1 USC and Copernicus
HRL, Vienna, Austria 1) Sentinel-2A image, “true color”
image, R (4) G (3) B (2), 2) S-1 USC, 3) “False Color/Near
Infrared” image from Sentinel-2A, R (8) G (3) B (2), 4)
Copernicus HRL.
In comparison to Copernicus HRL
Imperviousness Degree, the produced layer S-1 USC
shows generally a finer representation of the urban
inventory. Green and (pervious) open spaces are
visually easier to distinguish from built-up areas such
as buildings, bridges and railroads (Figure 4, Figure
5).
Figure 4: Danube River, Vienna, and crossing bridges
depicted in (1) S-1 USC, (2) Copernicus HRL (some of the
bridges captured by S-1 are missing in this image), (3)
Sentinel-2A “true-color” image.
The shape of buildings appear sharper. The
outlines of rivers and channels are more exact and
bridges are depicted as built-up area in detail (Figure
5).
Figure 5: Schönbrunn palace and surrounding castle
grounds (1) S-1 (2) Copernicus HRL (3) Sentinel-2A “true-
color” image.
Sentinel-1 for Urban Areas - Comparison between Automatically Derived Settlement Layers from Sentinel-1 Data and Copernicus High
Resolution Information Layers
47
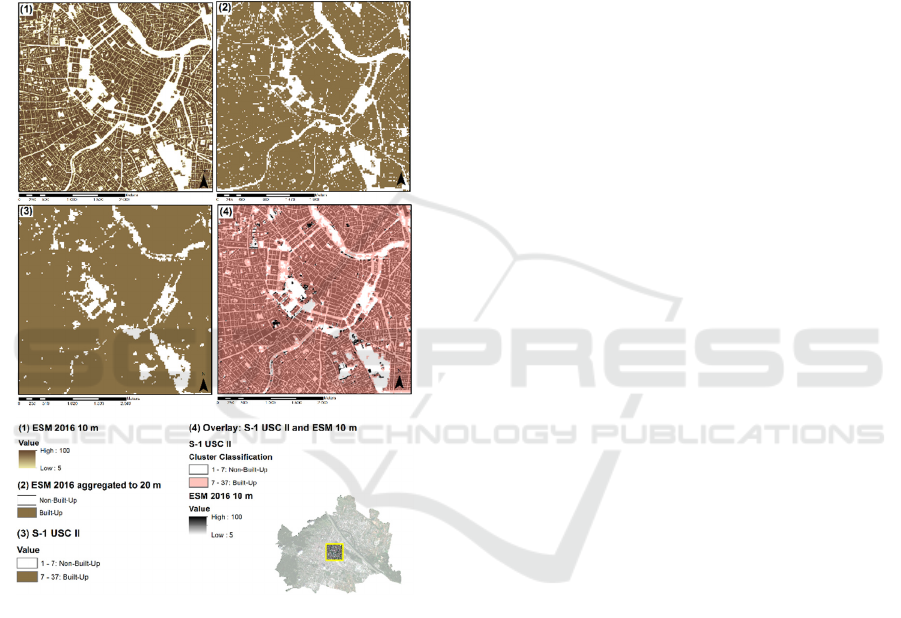
In comparison to European Settlement Map 2016,
bridges crossing the Danube River are represented in
the final produced layer S-1 USC II. Urban structures
such as courtyards or street canyons are represented
in greater detail within the ESM layer (Figure 6). This
richness of detail leads back to fact that the ESM 2016
itself has a higher geometric resolution. The data set
used for compiling the ESM 2016 has a higher
geometric resolution (SPOT 5 and SPOT 6 data of
2.5m pixel size) and includes use of ancillary datasets
(e.g. OpenStreetMap) (Florczyk et al., 2016).
Figure 6: Vienna Downtown, Comparison of (1) ESM
2016, Copyright European Commission, European
Settlement Map 2016, (2) ESM 2016 aggregated to 20 m
and (3) S-1 USC II, (4) Overlay between ESM 2016 and S-
1 USC II.
Although the results are overall promising, some
challenges remain regarding the accuracy of the
classification. High pixel values that indicate built-up
area are found within forest areas, mainly in steep
slopes. We attribute this to the fact that the
backscatter measured by S-1 sensor is influenced by
the terrain. Such areas with complex topography
could be masked using a digital elevation model.
Alternatively, the introduction of an object-based
approach allows for defining certain areas as
unsuitable for built-up area.
6 CONCLUSIONS
This study could demonstrate the value of Sentinel-1
data for mapping built-up areas. The preliminary
results revealed that pixel based unsupervised
classification of S-1 stacked backscatter composites
allows to differentiate between built-up and non-
built-up area within the urban landscape. The quality
of the automatically derived settlement layers (S-1
USC and S-1 USC II) is comparable to standardized
products based on optical sensors e.g. Copernicus
HRL Imperviousness Degree or European Settlement
Map 2016 respectively. The S-1 data available for this
study were limited to a half year from 2016.
Differentiation between built-up and non-built-up
area based on the presented methodology can be
enhanced by using more data covering the full year or
multiple years.
The introduction of object-based methodologies
where classification will not only depend on single
pixel values but also on relation between objects may
help to correct misclassifications. Certain terrain may
be defined as inappropriate for built-up area or
distance to other built-up area may be (more) relevant
for classification. Finally, another proposal for a
solution is the use of additional input data (composite
monthly mean single band images) in order to
enhance the differentiaton between built-up area (low
variance) and non-built-up area (high variance).
REFERENCES
Attema, E., Bargellini, P., Edwards, P., Levrini, G., Lokas,
S., Moeller, L., Rosich-Tell, B., Secchi, P., Torres, R.,
Davidson, M., 2007. Sentinel-1-the radar mission for
GMES operational land and sea services. ESA Bull.
131, 10–17.
Ball, G.H., Hall, D.J., 1965. ISODATA, a novel method of
data analysis and pattern classification. DTIC
Document.
Bauer-Marschallinger, B., Sabel, D., Wagner, W., 2014.
Optimisation of global grids for high-resolution remote
sensing data. Comput. Geosci. 72, 84–93.
Ben-Asher, Z., 2013. HELM-Harmonised European Land
Monitoring: Findings and Recommendations of the
HELM Project. Tel-Aviv, Israel.
Ciobotaru, N., Laslo, L., Matei, M., Muşat, C., Lupei, T.,
Boboc, M., Deák, G., 2016. Mapping Romanian
Wetlands – a Geographical Approach. Presented at the
Conference: 3rd International Conference Water
resources and wetlands, Tulcea, Romania, p. 14.
D’Aria, D., Piantanida, R., Valentino, A., Riva, D., 2016.
Freesar, an innovative SAR data processing framework,
in: Geoscience and Remote Sensing Symposium
GISTAM 2017 - 3rd International Conference on Geographical Information Systems Theory, Applications and Management
48

(IGARSS), 2016 IEEE International. IEEE, pp. 1214–
1216.
eCognition Developer 9.2, T., 2016. eCognition®
Developer Version 9.2.1 Reference Book.
EEA, E.E.A., 2000. Corine Land Cover. Eur. Environ.
Agency Cph. 163.
European Commission, E. S. M. 2016 (2017) ‘European
Settlement Map’. Copernicus. Available at:
http://land.copernicus.eu/pan-european/GHSL/EU%20
GHSL%202014. Copyright European Commission,
European Settlement Map 2016
European Space Agency, 2013. Sentinel-1 User Handbook,
GMES-S1OP-EOPG-TN-13-0001,
https://sentinel.esa.int/.
Florczyk, A.J., Ferri, S., Syrris, V., Kemper, T., Halkia, M.,
Soille, P., Pesaresi, M., 2016. A new european
settlement map from optical remotely sensed data.
IEEE J. Sel. Top. Appl. Earth Obs. Remote Sens. 9,
1978–1992.
Hennig, E.I., Schwick, C., Soukup, T., Orlitová, E.,
Kienast, F., Jaeger, J.A., 2015. Multi-scale analysis of
urban sprawl in Europe: Towards a European de-
sprawling strategy. Land Use Policy 49, 483–498.
Langanke, T., 2013. GIO land (GMES/Copernicus initial
operations land) High Resolution Layers (HRLs) –
summary of product specifications, version 7 of 2013-
10-14, European Environment Agency, GIO land team
at the EEA, 2013.
Lefebvre, A., Picand, P.-A., Sannier, C., 2015. Mapping
tree cover in European cities: comparison of
classification algorithms for an operational production
framework, in: 2015 Joint Urban Remote Sensing Event
(JURSE). IEEE, pp. 1–4.
Mücher, C.A., Hennekens, S.M., Schaminee, J.H.J.,
Halada, L., Halabuk, A., 2015. Modelling the spatial
distribution of EUNIS forest habitats based on
vegetation relevés and Copernicus HRL. European
Topic Centre Biological Diversity.
Naeimi, V., Elefante, S., Cao, S., Wagner, W., Dostalova,
A., Bauer-Marschallinger, B., 2016. Geophysical
parameters retrieval from sentinel-1 SAR data: a case
study for high performance computing at EODC, in:
Proceedings of the 24th High Performance Computing
Symposium. Society for Computer Simulation
International, p. 10.
Sannier, C., Gallego, J., Dahmer, J., Smith, G.,
Dufourmont, H., Pennec, A., 2016. Validation of
Copernicus high resolution layer on imperviousness
degree for 2006, 2009 and 2012, in: Proceedings of the
International Symposium on Spatial Accuracy
Assessment in Natural Resources and Environmental
Sciences, Montpellier, France. pp. 5–8.
Steinnocher, K., Köstl, M., Weichselbaum, J., 2011. Grid-
based population and land take trend indicators–new
approaches introduced by the geoland2 core
Information Service for Spatial Planning, in: NTTS
Conference, Brussels.
Tan, P.-N., 2006. Introduction to data mining. Pearson
Education India.
Sentinel-1 for Urban Areas - Comparison between Automatically Derived Settlement Layers from Sentinel-1 Data and Copernicus High
Resolution Information Layers
49
