
Smart Lifelogging: Recognizing Human Activities using PHASOR
Minh-Son Dao
1
, Duc-Tien Dang-Nguyen
2
, Michael Riegler
3
and Cathal Gurrin
2
1
Universiti Teknologi Brunei, Gadong, Brunei Darussalam
2
Dublin City University, Dublin, Ireland
3
Simula Research Laboratory, Oslo, Norway
minh.son@utb.edu.bn, {duc-tien.dang-nguyen, cathal.gurrin}@dcu.ie, michael@simula.no
Keywords:
Lifelog, Human Activity Recognition, Smartphones, Embedded Sensors, Smart-City, Heterogeneous Sensory
Data Analytics.
Abstract:
This paper introduces a new idea for sensor data analytics, named PHASOR, that can recognize and stream
individual human activities online. The proposed sensor concept can be utilized to solve some emerging
problems in smartcity domain such as health care, urban mobility, or security by creating a lifelog of human
activities. PHASOR is created from three ‘components’: ID, model, and Sensor. The first component is to
identify which sensor is used to monitor which object (e.g., group of users, individual users, type of smart-
phone). The second component decides suitable classifiers for human activities recognition. The last one
includes two types: (1) physical sensors that utilize embedded sensors in smartphones to recognize human
activities, (2) human factors that uses human interaction to personally increase the accuracy of the detection.
The advantage of PHASOR is the error signal is inversely proportional to its lifetime, which is well-suited
for lifelogging applications. The proposed concept is evaluated and compared to de-facto datasets as well as
state-of-the-art of Human Activity Recognition (HAR) using smartphones, confirming that applying PHASOR
can improves the accuracy of HAR.
1 INTRODUCTION
Nowadays, everything and everybody with network
connectivity can be turned into sensors that con-
tinuously generate data reflecting how human inter-
act with the physical world(Sowe and Zettsu, 2015).
Thus, linking people, devices, and data to monitor
human activities continuously and precisely can be
seen as one of the important factors that contributes to
the development of health care, security, transporta-
tion, and safety (Semanjski and Sidharta, 2016)(Lara
and Labrador, 2013). In this context, on-line hu-
man activities recognition (HAR) utilizing wearable
sensors has attracted researchers for years (Lara and
Labrador, 2013). These approaches aim to analyze
data gathered from wearable devices to semantically
describe human activities. Among types of wearable
sensors, smartphones are preferred as the most con-
venient equipment that can monitor human activities
because of its mobility, user-friendly interface, long-
time attachment, and available resources such as vari-
ous embedded sensors, strong CPU, memory, and bat-
tery (Shoaib et al., 2015). According to (Lara and
Labrador, 2013)(Shoaib et al., 2015), existing chal-
lenges include in-sufficient (standard) training data
(Vavoulas et al., 2016)(Ojetola et al., 2015), varying
positions and orientations of smartphones on the hu-
man body (Miao et al., 2015), resource consumption
and privacy (Siirtola and Roning, 2012), dynamic and
adaptive sensor selection (Capela et al., 2016) and
online versus offline training for classification meth-
ods (Shoaib et al., 2015)(Google Activity Recogni-
tion API, 2016), etc. Nevertheless, none of the re-
lated work discusses the human factor in Internet of
Everything (IoE) systems. In other words, users of
these systems play a passive role but not an active role
(Sowe et al., 2016). Some of these challenges have
been solved partially but not completely, especially in
the field of smart-city where results from HAR sys-
tems should be on-line and frequently streamed to a
smart-city center system in order to make suitable de-
cisions. In addition, a large and heterogeneous num-
ber of users in the smart-city system raise a difficult
challenge of having an adaptive model training com-
ponent that can update and re-train efficiently to cope
with the volume and variety of users.
In order to tackle these problems, we propose a
new idea for sensor data analytics, named PHASOR
(Phycial - HumAn SenOR) that can on-line moni-
tor (i.e., recognize and stream) individual human ac-
Dao, M-S., Dang-Nguyen, D-T., Riegler, M. and Gurrin, C.
Smart Lifelogging: Recognizing Human Activities using PHASOR.
DOI: 10.5220/0006320907610768
In Proceedings of the 6th International Conference on Pattern Recognition Applications and Methods (ICPRAM 2017), pages 761-768
ISBN: 978-989-758-222-6
Copyright
c
2017 by SCITEPRESS – Science and Technology Publications, Lda. All rights reserved
761

tivities to related components of smart-city scheme.
PHASOR is created from three components: ID,
Model, and Sensor. The first component identifies
which sensor is used to monitor a specific object like
a group of users, individual user, or a type of a smart-
phone. The second component contains the general
model and the individual model that aim to generate
suitable classifiers for HAR. The last component in-
cludes two types of “sensors”: (1) physical sensors
that utilizes embedded sensors in smart-phones to rec-
ognize human activities, (2) and human factors that
use human interaction to personally increase the ac-
curacy of activities detection. The advantage of PHA-
SOR is the accuracy will be increased during the run-
time. Therefore it suits for lifelogging applications,
which analyze and give insights from captured data
from wearable devices, in the domain of smart-city.
The major contributions of this work are: 1. En-
hance Human Factors: as discussed in (Sowe and
Zettsu, 2015)(Sowe et al., 2016), human factor can
contribute to the success of IoE. Unfortunately, it is
difficult to know how a human entity interacts with
IoE. This work can model human’s involvement (i.e.,
passive and active roles) in IoE to enhance the ac-
curacy of HAR. The users can flexibly change their
role from passive (i.e., users’ activities are recorded
by smart-phones), to active (i.e., users correct the rec-
ognized results). 2. Adapting: using users’ feed-
back to increase individual human activity recogni-
tion, bringing the ability to be adapted to specific
users. 3. Global Working Scope: less lead time to
detect human activities of a new user at the beginning
of lifelog monitoring process with an acceptable ac-
curacy of HAR detection by taking into account the
common information sharing among a group of peo-
ple.
2 RELATED WORK
In general, most smart-phone based HAR systems
are built with three major components: sensory data
acquisition, model training, and activity recognition
(Capela et al., 2016). The first component utilizes
accelerometer, gyroscope, and barometer sensors to
gather data from human activities. These sensors can
be used alone (Siirtola and Roning, 2012)(Bayat et al.,
2014), or combined together (Shoaib, 2013)(Chetty et
al., 2015)(Capela et al., 2016). The second compo-
nent is built by using different classification methods
such as Support Vector Machine (SVM), k-Nearest
Neighbour (k-NN/IBk), or others (Lara and Labrador,
2013)(Shoaib et al., 2015). The last component uses
these trained models to classify data gathered from
the first component to recognize human activities.
In earlier proposed methods, e.g., (Siirtola and
Roning, 2012) and (Bayat et al., 2014), only ac-
celerometer information was exploited. In (Siirtola
and Roning, 2012), the authors used two classifiers,
namely quadratic discriminant analysis and k-NN, to
recognize human activities. The main contribution of
this work is how to deploy the components on the
smartphone and server, so that the system can work
optimally. However, their method requires the phone
to be in a fixed position, e.g., in trousers front pockets
which limits their application range. In (Bayat et al.,
2014) the authors used several classifiers and in order
to overcome the difficulty of the phone position, they
introduced a strategy to select a suitable classifier for
recognizing some activities depending on the kind of
activity and the position of the smartphone. In (Miao
et al., 2015), the authors also discussed the impact of
varying positions and orientations of smartphones on
the qualification of HAR. They overcame this prob-
lem by developing an orientation-independent fea-
tures so that the system can work with acceptable ac-
curacy at any pockets. In (Chetty et al., 2015), the au-
thors exploited information not only from accelerom-
eter but also from gyroscope sensors to build classi-
fiers. Data mining approaches were utilized to build
classifiers with an information theory based rank-
ing of features as the pre-processing step. Recently,
Capela et al. in (Capela et al., 2016) proposed a new
method that can take into account different types of
users who have differences in walking biomechanics.
This system is considered as more affordable-price
and convenient solution than using wearable sensors.
The proposed system extracted 5 features from ac-
celerometer and gyroscope data and built classifiers
using decision tree. These activities are tested on both
able-bodied and stroke participants whom have differ-
ent treatment policies from medical perspective. Ac-
cording to the experimental results, the hypothesis of
differences in walking biomechanics influences on the
identification of human activities is confirmed.
In (Vavoulas et al., 2016; Ojetola et al., 2015), the
authors discussed the insufficient and non-standard of
training data for human activities recognition and in-
troduced their shared database collected from volun-
teers with a set of basic features and baseline methods
for further comparison with other methods. The vari-
ety of users and positions of smartphones were also
considered in these studies.
In our study, we proposed a method that not only
improve the accuracy, but also taking into account the
human factors impact. We also exploit the data col-
lected in (Vavoulas et al., 2016) and compare their
approach with the proposed method.
ICPRAM 2017 - 6th International Conference on Pattern Recognition Applications and Methods
762
Activity Detection
Result Visualization
Preprocessing
Feature vectors
Data Gathering
Raw sensory signal data
User Interaction
WALKING
90%
CYCLING
15%
RUNNING
25%
STANDING
60%
Labels
Validation
2
6
6
6
4
F
t
1
= {S
|t
1
E,t
1
|
,label
t
1
}
F
t
2
= {S
|t
2
E,t
2
|
,label
t
2
}
.
.
.
F
t
n
= {S
|t
n
E,t
n
|
,label
t
n
}
3
7
7
7
5
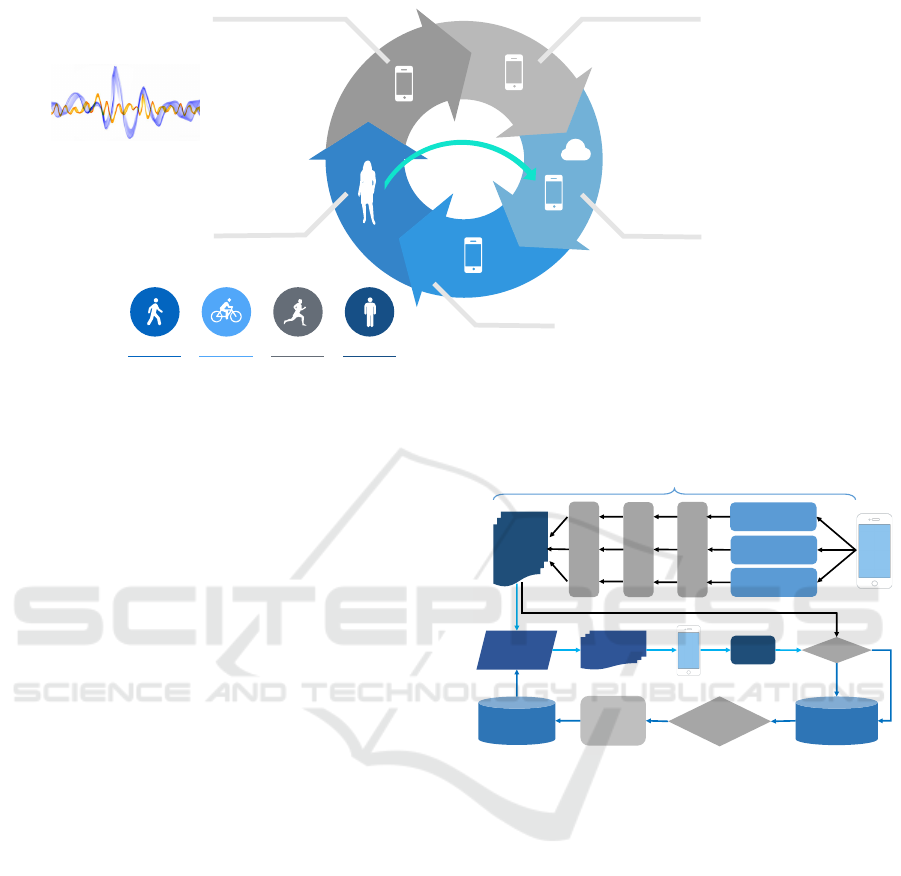
Figure 1: A general view of PHASOR.
3 METHODOLOGY
As introduced in Section 1, PHASOR is created from
three components: ID, Model, and Sensor, in this sec-
tion we describe how to apply PHASOR to recog-
nize different types of activities by exploiting the data
gathered from embedded sensors of smartphones: ac-
celerometer, gyroscope, and orientation (AGO)).
Shown in Figure 1 is a general view of PHASOR.
Generally, it acts as a small application that first cap-
tures signals from the AGO sensors. These raw data
are then pre-processed and converted into meaningful
features. These features are then analyzed in order to
recognize the activity of the user. Finally, the appli-
cation visualizes the results to the user. At this stage,
the users can validate for the most appropriate activ-
ity, and send back the validated activity label to the
application, together with the AGO signals.
3.1 Definitions
We define a PHASOR and its components as follows:
1. PHASOR = {ID, Device, Sensor}
2. ID = {Individual-ID = {Smartphone-ID, User-ID},
General-ID}
3. Sensor = {Physical Sensor, Human Factor}
4. Model = {General Model, Individual Model}
5. Storage = {{feature → label} Storage, activity
models Storage}
6. Function = {Signal Symbolizing, Feature Extrac-
tion, Activity Labeling, Activity Modeling, Activ-
ity Recognition}
Accelero-meter*
sensor
Gyroscope*sensor
Orientation*sensor
Encoding*
(SAX)
Features*Extracting
Features
{feature*->*label}
Storage
(Re)Training*
Trigger?
Training*
(Association*
Rule*Mining)
Activity*Models
Detected*
Activities
Time%window
+
Voting*
data
Vote?
Detector
+
-
Signal*Ingesting
Figure 2: Activity recognition from signals.
The inputs of a PHASOR are a user and his/her smart-
phone, whereas the outputs are user’s activities.
3.2 Functions Definitions
Shown in Figure 2 is the schema of the proposed
framework, containing five functions as follows:
• Signal Symbolizing: This function acts as the
first step of the process, which automatically sym-
bolizes signals collected from AGO sensors using
Symbolic Aggregate Approximation (SAX) (Lin et
al, 2003). Signals are first converted into time-
series format, then symbolized using SAX. The
SAX algorithm is known as a good method to sym-
bolize a time-series data to a symbolic sequence
while retaining the principal characteristics of the
original data and a high correlation between SAX-
encoded data and the original data.
• Feature Extraction: By defining a time win-
Smart Lifelogging: Recognizing Human Activities using PHASOR
763
dow (i.e., spatio-temporal constraint), this function
grouped all SAX subsequences inside a time win-
dow to create a feature vector. We define an activity
pattern as a pair of feature vector and its activity la-
bel (i.e., {feature → label}). At this state, all labels
are assigned a negative value; and all patterns are
considered as negative patterns.
• Activity Labeling: The target of this function is
to assign activity labels to related patterns gener-
ated by the previous step (feature extraction). The
labels are selected from training datasets (offline
mode), classifiers (online mode), or users (feed-
back mode). Patterns after updated labels are stored
in the {feature → label} Storage.
• Activity Modeling: An appropriate supervised
learning scheme such as association rule mining, or
support vector machine, is used to create an activ-
ity model from the patterns stored in the {feature →
label} Storage. A trigger is designed to determine
if the activity models should be updated, e.g., when
a new activity instance is detected. The results of
this function are stored in the Activity Models Stor-
age .
• Activity Recognition: Negative patterns are also
treat as inputs of the activity model stored in the
Activity Model Storage. If the patterns trigger pass
a detection, a new activity’s instance is detected,
and alerted to actuators. In parallel, the negative
label of this pattern is replaced by the label of de-
tected activity.
In the following subsections, we describe important
definitions and components of PHASOR.
3.3 Parameters Definitions
1. A time-series of the data recorded from the signal
j
th
of the sensor i
th
is denoted as s
i j
. Its SAX code
is denoted as S
i j
.
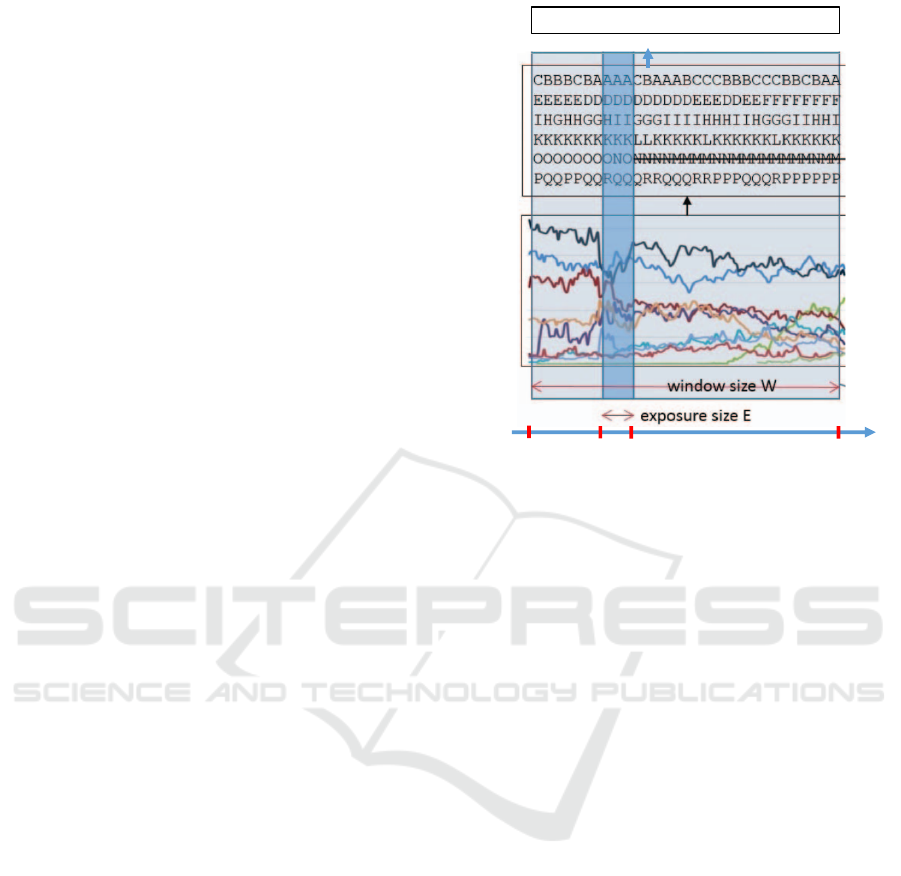
2. A time slider window is denoted as T SW =
{W, E, J}, where W is a window size by which his-
torical data are aggregated, E is an exposure (i.e.,
interval time looked back at the current time), and
J is a jump step (i.e., an interval time T SW has to
move for the next processing). Depending on the
value of J, a time slider window can be shifted in
overlap or non-overlap modes.
3. F
t
: a feature vector created by collecting S
i j
extracted from the interval time [t − E, t] (i.e.,
the extracting window), and assigned a label
(e.g., jogging, walking, negative, or null). F
t
=
{S
[t−E,t]
i j
, label
t
}, where S
[t−E,t]
i j
is a sub-sequence
of S
i j
extracted within an interval time [t − E, t].
F
t
=${(AAA,$DDD,$HII,$KKK,$ONO,$RQQ)$->$jogging}
t
start
t
current
t
Sensory$data
SAX$code
t-E
Figure 3: An example of how to extract features. In
this case, we have 2 sensors, each sensor has 3 signals,
as shown in ‘sensory data’ block. E = 2. S
[t−2,t]
11
=
AAA, S
[t−2,t]
12
= DDD, S
[t−2,t]
13
= HII, S
[t−2,t]
21
= KKK,
S
[t−2,t]
22
= ONO, and S
[t−2,t]
23
= RQQ, and thus F
t
=
{(AAA, DDD, HII, KKK, ONO, RQQ) → jogging}.
Figure 3 illustrates T SW, S
i j
, and F
t
of “jogging”
activity.
3.4 Sensors Definitions
Physical Sensor: The purpose of the Physical Sensor
is to convert raw signals being gathered from smart-
phones to features and recognize user’s activities, as
described below:
1. Use Signal Symbolizing component to convert s
i j
to S
i j
.
2. Use Feature Extraction component to create F
t
,
where W is assigned as the time interval when the
activity A happened (the values of E and J are
empirically selected beforehand). The label of F
t
is assigned as the name of activity currently pro-
cessed, in this case A.
3. Use Activity Recognition function to recognize
user’s activities. Inform to users.
4. Repeat from step 1 until the stop condition is met.
Human Factor: The purpose of Human Factor is to
re-assign the right label to the activity with the wrong
label, as described below:
1. Use Activity Labeling with {F
t
} as the input to re-
assign the right label to {F
t
} that gave a wrong an-
ICPRAM 2017 - 6th International Conference on Pattern Recognition Applications and Methods
764

swer, according to the validated activity label in-
put by users. These {F
t
} will be stored in {feature
→ label} Storage with index of identified user and
related activity for the next re-training, when it is
required.
2. Send {F
t
} with updated label to Storage according
to Trigger’s commands.
3.5 Models Definitions
• General Model: Given a pre-defined training
dataset DA = F
t
of activity A, use Activity Model-
ing function to generate GM
A
with a suitable ma-
chine learning method such as SVM, J48, ANN, or
rule-based decision on F
t
to create a general model
GM
A
.
• Individual Model: The purpose of this component
is to generate an activity model using interactive
manner with users. In fact, this model works simi-
lar to the group model except the training dataset is
filtered by IDs (i.e., using data collected from the
same IDs).
Both models are re-trained periodically or forcefully
according to triggers’ commands.
3.6 Installations and Trigger
PHASOR can be installed in both clouds and smart-
phones, as follows:
• Clouds: The Storage and Model components are
deployed. Models are generated on the clouds, and
ready for being downloaded and updated accord-
ing to users’ requirements. Individual Models are
either copied from General Models for the first in-
stallation or replaced by new Individual Models for
the re-training process.
• Smartphones: The Model and Device components
are installed. At the first time of use, a user will
download a General Model from Activity Models
Storage deployed in the clouds. Then, these models
will be treat as Individual Model with user’s ID. In
on-line mode (i.e., activity recognizing), the phys-
ical device detects activities. The results will be
displayed on the user’s monitor. If the user does
not agree the results, he/she can re-label the results.
Right after, the human factor will send F
t
with new
labels to { f eature → label} Storage stored in the
clouds with proper information of identified user
immediately and/or periodically.
The Trigger is designed to activate the re-training
stage for updating Models. When the number of re-
labeled features of one model is large enough, the
trigger will activate the Activity Modeling function to
re-train a proper model. There are two options: (1)
automatically updating, and (2) periodically updating
only after evaluating by system administrators. The
former does not guarantee if the new model works
better than the old one. Fortunately, users can undo
and re-activate the old model when they want. The
latter needs time due to the cross-validation will be
carried on by system administrators to evaluate which
model is better. The better model will be asked for
updating to a smartphone.
4 EXPERIMENTAL RESULTS
In order to evaluate the proposed method, we define
three criteria: (1) arbitrary parameters (e.g., time-
series data, datasets, re-training times, methods), (2)
personalized accuracy, and (3) heterogeneous sensors.
4.1 Dataset, Parameters, and Cloud
Environment
We use the “the MobiAct dataset”(Vavoulas et al.,
2016) for training general models. This dataset con-
tains signals gathered from accelerometer, gyroscope,
and orientation sensors of a Samsung Galaxy S3
smartphone. We also created another dataset, named
PHASOR-dataset, by requesting 10 volunteers to cre-
ate and re-train 10 different individual models us-
ing Samsung Galaxy S3 smartphone. They attached
with their smartphones during their daily actitivies
for 3 days. We focus on recognizing following ac-
tivities:standing, walking, jogging, up-stairs, down-
stairs, sitting.
SAX-generating functions parameters are set as:
the number of alphabet = three (i.e., low, medium,
and high), breakpoints = Gaussian, and the PPA
number is set so that each symbol representing for
one time-unit (e.g., one-symbols/one-second, one-
symbols/fifty-milliseconds). Signals of each param-
eter of each sensor are encoded by different range of
the alphabet characters, as an example illustrated in
Figure 3.
We use the cloud system, namely UIT-Cloud, that
is based on IBM cloud computing solution to simulate
the cloud environment
1
. The clouds hardware infras-
tructure consists of twelve computing nodes, and 3TB
RAM is available for computation. The capacity of
its storage devices reaches 10TB. UIT-Cloud now has
five Tflops of computing power.
1
mmlab.uit.edu.vn
Smart Lifelogging: Recognizing Human Activities using PHASOR
765
4.2 Results and Comparisons
In order to evaluation the accuracy performance,
we compared the proposed method with the ones
in (Vavoulas et al., 2016) using both the MobiAct
dataset, and the PHASOR-dataset.
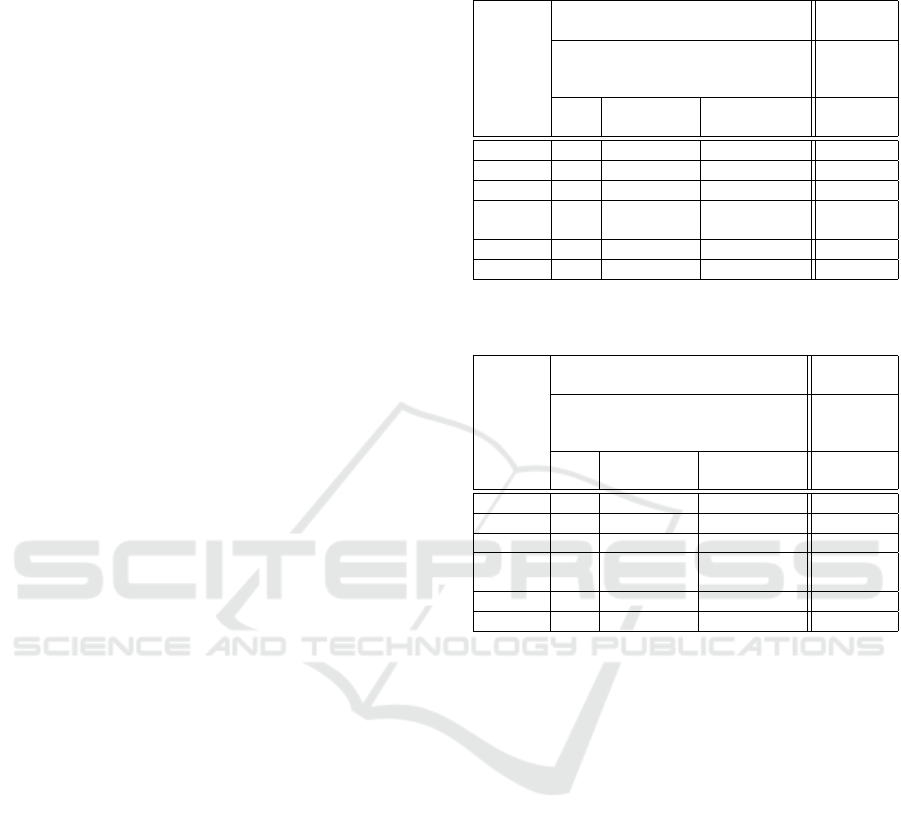
First, we use the MobiAct dataset and conduct ex-
periments using 10-fold cross-validation. We use the
general model trained by using the MobiAct dataset
for the proposed method. We reproduce methods dis-
cussed in (Vavoulas et al., 2016) with Feature Set B
(43 features). Table 1 denotes the results of this ex-
perience. The accuracy of the proposed method al-
most equals to the method in (Vavoulas et al., 2016).
Second, we ask volunteers to manually re-assign a
right label for activity which has a wrong label.
Then, we re-train individual models with the update
{ f eature → label} set. We run these steps for five
time, and select the best one to report. We reproduce
methods described in (Vavoulas et al., 2016) with Op-
timal Feature Set (64 features). Table 2 denotes the
new comparison between the method of Vacoulas et
al. and the proposed method with updated individual
models. The results confirm that changing only phys-
ical factor (e.g., feature sets) cannot gain significantly
better result comparing to taking into account the hu-
man factor (e.g., users’ feedback).
We carry on the second experiment to evaluate the
adaptation of proposed method when being deployed
into a new environment. Here, we use the whole Mo-
biAct dataset as a pre-training data to generate gen-
eral models. Then, we deploy these models to ten
Samsung G3 smartphones. Ten volunteers use these
smartphones, and give feedback to the system. We
run five times re-training tasks, then select the best
one to report. Table 3 describes the comparison of
classification results made by method introduced in
(Vavoulas et al., 2016), and the proposed method. We
can see that, both methods explained in (Vavoulas et
al., 2016), and the proposed method do not gain the
good results comparing to cross-validation tests men-
tioned above. The reason of having low accuracy here
can be because the training and testing datasets come
from different groups of users and devices. Table 4
shows the better results of the proposed method after
updating individual models. We can see the big gaps
between the accuracy of two approaches. Meanwhile
methods introduced in (Vavoulas et al., 2016) can not
improve much their accuracy even though using opti-
mal feature set, the proposed method can gain the bet-
ter results. This results emphasize the quick adaption
of PHASOR. Thanks to the human factor and indi-
vidual model component, PHASOR can re-train with
user’s support and the lifelog-style of data (i.e., data
Table 1: Results (F-score) on MobiAct dataset. Cross-
Validation (10s window size, no overlap).
Activity
Reproduced Methods described in
(Vavoulas et al., 2016)
Proposed
Method
Feature Set B (43 features) SAX-
based
feature
J48 Logistic
Regression
Multi-layer
Perceptron
General
Model
Walking 90.6 93.9 95.5 95.2
Jogging 98.2 98.5 99.0 98.7
Upstairs 65.8 54.9 79.3 80.0
Down-
stairs
55.7 49.3 69.6 70.1
Sitting 97.2 93.9 94.8 93.5
Standing 96.9 94.7 90.7 91.1
Table 2: Results (F-score) on MobiAct dataset. Cross-
Validation (10s window size, no overlap).
Activity
Reproduced Methods described in
(Vavoulas et al., 2016)
Proposed
Method
Optimal Feature Set (64 features) SAX-
based
feature
J48 Logistic
Regression
Multi-layer
Perceptron
Individual
Model
Walking 99.5 98.3 99.8 99.2
Jogging 99.0 99.2 99.5 99.1
Upstairs 85.6 79.6 92.6 91.9
Down-
stairs
87.3 77.3 91.5 92.0
Sitting 97.1 97.6 98.1 98.2
Standing 99.3 89.8 99.3 99.1
from an individual user will be large enough to train
an individual model). In the third experiment, we
change the time-slider-window parameter, the most
important factor in time-series processing. In this ex-
perience, we set 5s window size, with 80% overlap
as used in (Vavoulas et al., 2016). We again use the
MobiAct to train the general model; and use 10-fold
cross-validation. Table 5 denotes the results of the
method introduced in (Vavoulas et al., 2016), and the
proposed method. Clearly, there is no significant dif-
ference between them.
The last experiment is carried on by applying in
real-time with 10 volunteers (as mentioned above),
with the same time-slider-window parameter, and the
general model as described in the third experience.
After the volunteers interact with their smartphones
and correct labels, the system is re-trained and up-
dated in individual models, and reported the best one.
Results are reported in Table 6, confirming that PHA-
SOR can improve the results during the run-time.
ICPRAM 2017 - 6th International Conference on Pattern Recognition Applications and Methods
766

Table 3: Results (F-score) on PHASOR-dataset. General
Model (10s window size, no overlap).
Activity
Reproduced Methods described in
(Vavoulas et al., 2016)
Proposed
Method
Feature Set B (43 features) SAX-
based
feature
J48 Logistic
Regression
Multi-layer
Perceptron
General
Model
Walking 80.2 82.9 85.6 89.6
Jogging 88.3 88.7 89.2 90.1
Upstairs 56.2 44.1 69.5 82.3
Down-
stairs
44.8 38.8 58.9 83.5
Sitting 87.1 84.7 84.5 87.0
Standing 87.0 84.8 81.1 91.2
Table 4: Results (F-score) on PHASOR-dataset. Individual
Model (10s window size, no overlap).
Activity
Reproduced Methods described in
(Vavoulas et al., 2016)
Proposed
Method
Optimal Feature Set (64 features) SAX-
based
feature
J48 Logistic
Regression
Multi-layer
Perceptron
Individual
Model
Walking 89.8 88.4 89.9 98.2
Jogging 89.2 89.2 89.7 98.5
Upstairs 75.4 69.1 82.8 95.6
Down-
stairs
77.3 67.8 80.9 95.8
Sitting 87.1 87.6 87.8 98.3
Standing 89.8 86.8 89.3 99.1
5 DISCUSSION
Since data, included features, labels, models, user’
profiles, and detected human activities are stored in
the cloud, the system suits for connecting to smart-
city schema where several departments can access
real-time information of human activities to serve
their own purposes. For example, a health-care de-
partments can monitor their patients’ statuses via ac-
tivities to give in-time ambulance service or security
departments can understand a crowd behavior at cer-
tain location by analyzing human activities to avoid
a harmful event. Moreover, other researchers can ex-
change data improve their classifiers due to volume
and variety of data offered by this system.
Although the proposed method gains some good
results comparing to existing methods, improvements
can be made in the future. First, we need to under-
stand whether we can get the convergence for indi-
vidual model, or find the way to calculate the optimal
re-training times to get the optimal personal model.
Second, we have not yet clustered users into vari-
Table 5: Results (TP-rate) on MobiAct dataset. General
Model (5s window size, 80% overlap).
Activity
Reproduced Method
described in (Vavoulas
et al., 2016)
Proposed Method
Optimal Feature Set
(64 features)/IBk
SAX-based feature
/General Model
Walking 1.000 1.000
Jogging 0.998 0.999
Upstairs 0.992 0.990
Down-
stairs
0.983 0.991
Sitting 0.998 1.000
Standing 1.000 1.000
Table 6: Results (TP-rate) on PHASOR-dataset. Individual
Model (5s window size, 80% overlap).
Activity
Reproduced Method
described in (Vavoulas
et al., 2016)
Proposed Method
Optimal Feature Set
(64 features)/IBk
SAX-based feature
/Individual Model
Walking 0.989 1.000
Jogging 0.997 1.000
Upstairs 0.987 0.993
Down-
stairs
0.983 0.994
Sitting 0.995 1.000
Standing 0.998 1.000
ous groups, although we asked for personal informa-
tion when creating user profiles. This personal infor-
mation could help to increase the accuracy of gen-
eral/group/individual models designed to match users
activities individually. Third, the invariance of posi-
tions and orientations of smartphones should be ex-
amined carefully. At the moment we fix the smart-
phone’s positions as described in (Vavoulas et al.,
2016). Fourth, we will apply different supervised and
un-supervised methods on SAX-based features to see
which combination can give a better results. Fifth,
we will connect our system to smart-city scheme to
investigate how well the system can be immersed and
bring benefits, especially on health-care, urban mobil-
ity, and security areas. Finally, the sample rates, time
slider windows, overlap and other parameters should
be evaluated carefully to find the optimal set of pa-
rameters.
6 CONCLUSION
The paper introduces a new method to monitor daily
human activities using the physical-human sensor that
emphasize the active role of human factor in IoE
where people, devices, and data are semantically
linked together. In order to do that, PHASOR is de-
Smart Lifelogging: Recognizing Human Activities using PHASOR
767

signed with two major components Sensor and Mod-
els to capture users’ feedback and re-train the indi-
vidual models to personalize classifiers. The exper-
iment results confirm the major advantage of PHA-
SOR that is the error signal is inversely proportional
to the sensor’s lifetime. Therefore, PHASOR suits
for life-logging applications, especially applying to
smart-city schema, buy using it to stream human ac-
tivities regardless the problem of volume and variety
of users.
REFERENCES
I. Semanjski, G. Sidharta, Sensing Human Activity for
Smart Cities Mobility Management, Smart Cities
Technologies. Ed. Ivan Nunes Da Silva. Rijeka, Croa-
tia: InTech, 2016.
O.D. Lara, M.A. Labrador, A Survey on Human Activ-
ity Recognition Using Wearable Sensors, IEEE Com-
munications Surveys and Tutorials, 15(3):1192-1209,
2013.
M. Shoaib, S. Bosch, D. Incel, H. Scholten, P.J.M. Havinga,
A Survey of Online Activity Recognition Using Mobile
Phones, Journal of Sensors (Basel, Switzerland), vol.
15, no. 1, pp. 2059-2085, 2015.
P. Siirtola, J.Roning, Recognizing Human Activities User
independently on Smartphones Based on Accelerome-
ter Data, Special Issue on Distributed Computing and
Artificial Intelligence, pp. 38-45, 2012.
A. Bayat, M. Pomplun, D. A. Tran, A Study on Human
Activity Recognition Using Accelerometer Data from
Smartphones, Elsevier Procedia Computer Science -
MobiSPC, pp.1-8, 2014.
M. Shoaib, Human Activity Recognition Using Heteroge-
neous Sensors, ACM UbiComp, pp. 1-4, 2013.
G. Chetty, M. White, F. Akther, Smart Phone Based Data
Mining For Human Activity Recognition, Elsevier Pro-
cedia Computer Science - ICICT, vol. 46, pp. 1181-
1187, 2015.
N. A. Capela, E. D. Lemaire, N. Baddour, M. Rudolf,
N. Goljar, H. Burger, Evaluation of a smartphone hu-
man activity recognition application with able-bodied
and stroke participants, Journal of NeuroEngineering
and Rehabilitation, vol. 13, no. 5, pp. 1-10, 2016
G. Vavoulas, C. Chatzaki, T. Malliotakis, M. Pediadi-
tis, M. Tsiknakis, The MobiAct Dataset: Recogni-
tion of Activities of Daily Living using Smartphones,
ICT4AWE, pp. 143-151, 2016.
O. Ojetola, E. Gaura, J. Brusey, Data set for fall events and
daily activities from inertial sensors, ACM-MMSys,
pp. 243-248, 2015.
F. Miao, Y. He, J. Liu, I. Ayoola, Identifying typical physi-
cal activity on smartphone with varying positions and
orientations, BioMedical Engineering Online, pp. 14-
32, 2015.
Google Activity Recognition API. http://developer.
android.com/training/location/activity-
recognition.html, accessed November 2016.
J. Lin and E. Keogh and S. Lonardi and B. Chiu, A Symbolic
Representation of Time Series, with Implications for
Streaming Algorithms, 8th ACM SIGMOD Workshop
on Research Issues in Data Mining and Knowledge
Discovery, pp. 211, 2003.
M. Zhang and C. He, Survey on Association Rules Mining
Algorithms, LNCS Advancing Computing, Communi-
cation, Control and Management, vol. 56, pp. 111118,
2010.
S. Sowe and K. Zettsu, Human Factors in Cyber-Physical
Social Systems: Leveraging Social Sensor Data., EJC,
Vol. 280 of Frontiers in Artificial Intelligence and
Applications, IOS Press, pp. 157-165, 2015. Cyber-
Physical-Human Systems: Putting People in the Loop
S. Sowe and E. Simmon and K. Zettsu and F. deVaulx and
I. Bojanova, IT Professional, pp. 10-13, 2016.
ICPRAM 2017 - 6th International Conference on Pattern Recognition Applications and Methods
768
