
New Trends for Early Diabetic Retinopathy Diagnosis
Joana Tavares Ferreira
1, 2
and Luís Abegão Pinto
3, 4
1
Department of Ophthalmology, Central Lisbon Hospital Center, Lisbon, Portugal
2
NOVA Medical School, Universidade Nova de Lisboa, Lisbon, Portugal
3
Department of Ophthalmology, Northern Lisbon Hospital Center, Lisbon, Portugal
4
Visual Sciences Study Center, Faculty of Medicine, Lisbon University, Lisbon, Portugal
Keywords: Diabetic Retinopathy, Optical Coherence Tomography, Retinal Layers, Neurodegeneration, Choroidal
Thickness.
Abstract: Diabetes Mellitus is one of the most common chronic diseases in the world and is a critical public health
problem that could even be considered a pandemic. The diabetic retinopathy is the leading cause of blindness
in adults. Diabetic retinopathy is now considered to be a new neurodegenerative disease. In fact, retinal
neurodegeneration is present before any microcirculatory abnormalities can be detected in ophthalmoscopy.
Functional studies documenting electroretinogram abnormalities, loss of dark adaptation, contrast sensitivity
and colour vision and abnormal microperimetry that occur before any vascular abnormality. Novel imaging
optical devices have allowed that this pre-vascular damage to be quantified in a non-invasive and reproducible
way with retinal layer and choroidal thickness measurement.
1 INTRODUCTION
Diabetic retinopathy (DR) is the leading cause of
legal blindness among working-aged adults in the
United States (Klein, 2007). Of the 415 million
diabetic patients worldwide in 2015, over one-third
will develop DR in their lifetime (International
Diabetes Federation (IDF), 2015).
The RETINODIAB study, an epidemiologic
study that investigated the prevalence and
progression rates of DR based on a national screening
community program in Portugal, identified a 16.3%
prevalence rate of DR and a 4.6% incidence rate of
any DR within the first year in diabetic patients
without retinopathy at baseline (M. Dutra Medeiros et
al., 2015; Marco Dutra Medeiros et al., 2015).
The International Clinical Classification of DR is
based on the observation of microvascular retinal
changes (‘Grading diabetic retinopathy from
stereoscopic color fundus photographs--an extension
of the modified Airlie House classification. ETDRS
report number 10. Early Treatment Diabetic
Retinopathy Study Research Group.’, 1991).
However, diabetic neuroretinal degeneration has been
demonstrated in histological studies and through the
measurement of functional loss with a number of
functional tests, including contrast vision, color
vision, visual field, dark adaptation and
electroretinogram. These retinal neurodegenerative
changes include apoptosis of several populations of
retinal cells (e.g., photoreceptors, bipolar cells,
ganglion cells and astrocytes) with consequent effects
on the thickness of different retinal layers in the
earliest stages of DR or when DR cannot be detected
by ophthalmologic examination (Barber et al., 1998;
Carrasco et al., 2007, 2008; Garcia-Ramírez et al.,
2009). Furthermore, it has been hypothesized that
changes in the choriocapillaris may precede the
development of DR (Nagaoka et al., 2004). However,
the relationship between DR and diabetic
choroidopathy remains unclear.
Recently, optical coherence tomography (OCT)
has been introduced into clinical practice as the most
non-invasive and objective method to visualize the
retina, showing an amount of detail that resembles
histological specimens (Fischer et al., 2009; van Dijk
et al., 2011). Initially, OCT was applied to detect
complications of DR (edema macular or epiretinal
membrane) (Ceklic, Maár and Neubauer, 2008). Later
on, it allowed to perform quantitative and qualitative
measurements of retinal thickness and segmentation
of all intraretinal layers (van Dijk et al., 2009, 2010,
2012; Vujosevic and Midena, 2013; Tavares Ferreira
J et al., 2016), Figure 1. The new Spectralis Spectral
Tavares Ferreira J. and AbegÃ
ˇ
co Pinto L.
New Trends for Early Diabetic Retinopathy Diagnosis.
DOI: 10.5220/0006328304020406
Copyright
c
2017 by SCITEPRESS – Science and Technology Publications, Lda. All rights reserved
Domain-OCT automatic segmentation software
demonstrated excellent repeatability and
reproducibility of each of the eight individual retinal
layer thickness measurements (Ctori and Huntjens,
2015). Potentially, OCT might detect early retinal
changes, and thus help define which diabetic patients
may be at-risk to develop DR. Ultimately, it could be
used to plan preventive therapy before the
development of vascular lesions detectable by
ophthalmoscopy (Simó and Hernández, 2014).
However, up until now, the smaller scale, mostly pilot
studies or only focusing on specific retinal layers on
this topic in OCT image analysis did not show a
temporal relationship between DM duration or arising
DR and the changes observed in retinal layers.
Figure 1: Retinal layer segmentation. Figure adapted to
(Tavares Ferreira J, Alves M, Dias-Santos A, Costa L,
Santos BO, Cunha JP, Papoila AL, 2016)
.
This review aims to summarize recent literature
concerning retinal structure changes in diabetic
patients and its relationship with diabetic retinal
disease progression.
2 OPTICAL COHERENCE
TOMOGRAPHY IN EARLY
DIAGNOSIS OF DIABETIC
RETINOPATHY
Several studies using Spectral Domain (SD)-OCT,
showed a decreased retinal nerve fiber layer (RNFL)
or (ganglion cell layer) GCL thickness in diabetic
patients without DR (Vujosevic and Midena, 2013;
Chhablani et al., 2015; Carpineto et al., 2016).
However, Hille van Dijk et al. did not find differences
in any inner layer thickness between non-diabetic and
type 1 or type 2 diabetic patients even without DR
(van Dijk et al., 2010, 2012). Nevertheless, different
SD-OCT devices were used (Cirrus, Topcon or
Nidek) and the diabetic patient samples were very
small (30 (Vujosevic and Midena, 2013), 20
(Chhablani et al., 2015), 19 (van Dijk et al., 2010) or
39 (van Dijk et al., 2012) patients to perform a
reliable multivariable analysis. Only Carpineto et al.
studied 131 type 2 diabetic patients without DR using
Cirrus SD-OCT, and identified a reduced ganglion
cell-inner plexiforme layer (GC-IPL) and RNFL
thickness compared with healthy controls (Carpineto
et al., 2016). Vujosevic et al. studied both inner and
outer layers but in opposition to this work they did not
find any differences in the retinal pigment epithelium
(RPE) and photoreceptor (PR) layers thickness.
However, these authors have studied the RPE and PR
layers together not individualizing them in two
different layers.
Tavares Ferreira et al, used SD-OCT to compare
the retinal layers thickness between non-diabetic
subjects and type 2 diabetic patients without DR and
with different Diabetes Mellitus (DM) duration
(Tavares Ferreira J et al., 2016). In their multivariable
regression models, after adjusting for age, gender,
intraocular pressure (IOP) and axial length, and
correcting for multiple testing, no difference in the
overall retinal total (RT) thickness throughout the
Early Treatment Diabetic Retinopathy Study
(ETDRS) areas was found. Interestingly, the patterns
of layer distribution were not the same in the two
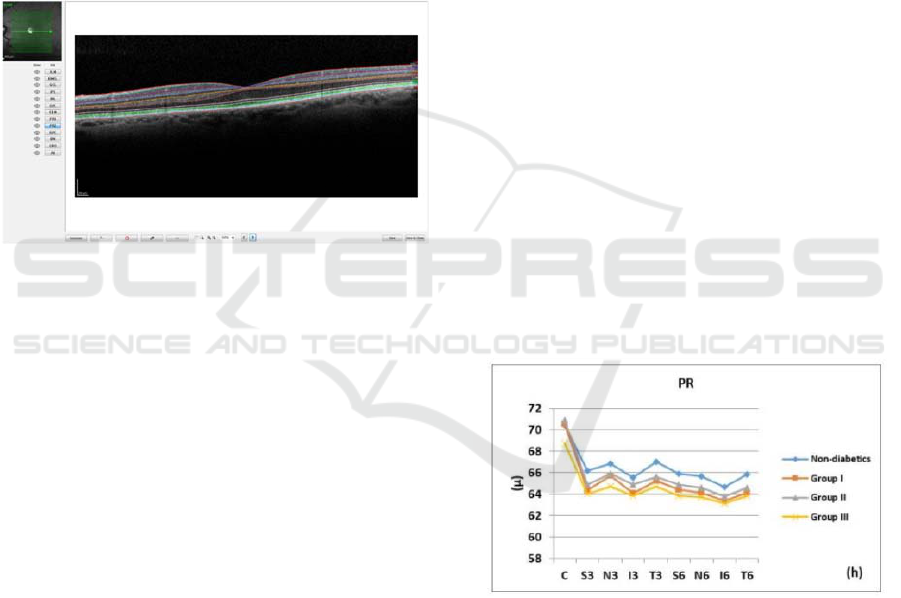
samples. The PR layer was the most consistent
finding, with a smaller thickness in diabetic patients
when compared to their non-diabetic controls, Figure
2.
Figure 2: Photoreceptor layer thickness in all groups,
determined automatically by SD-OCT in nine ETDRS areas
in the macula. Figure adapted to (Tavares Ferreira J, Alves
M, Dias-Santos A, Costa L, Santos BO, Cunha JP, Papoila
AL, 2016).
Nevertheless, the pattern of thickness in this layer
differs with disease duration. Once stratified diabetic
patients according to this parameter, the thinner
layers could be found in patients with both an early
(group I) and longer known diabetes diagnosis (group
III) (p<0.001). On the other hand, the thinning in PR
in diabetic patients with moderate duration (group II)

did not reach statistical significance when compared
to the healthy controls. The remaining layers (outer
nuclear layer - ONL, outer plexiform layer - OPL,
inner nuclear layer - INL and GCL) showed an overall
tendency towards a thicker layer in diabetic retinas
when compared to non-diabetic patients, but did not
reached statistical significance (Tavares Ferreira J et
al., 2016).
PR layer was not uniform throughout disease
duration. This could be interpreted as a temporary
cellular swelling due to a number of reasons, ranging
from the diabetic induced hypoxia (Kern and
Berkowitz, 2015), oxidative stress with increased
generation of superoxide and other reactive oxygen
species in the retina (Du et al., 2013) which induces
the release of pro-inflammatory molecules and
changes in retinal vasculature. Ultimately, the
continuous cellular swelling is known to lead to a
cellular atrophy (Kern and Berkowitz, 2015),
potentially explaining the thinnest PR layer in the
patients with longer disease duration. This non-linear
behaviour is important as it can explain the
contradictory results in this field, as each study may
be recruiting patients with a different disease
duration. Additionally, it could be clinically relevant
as studies have suggested the importance of the PR
layer in the development of DR, loss of PR reduced
the severity of vascular degeneration in DR (Arden,
2001; De Gooyer et al., 2006). Further studies would
be needed to interpret such findings.
These same authors did a longitudinal study,
based on the baseline study referred in which the aim
was to evaluate which diabetic patients without DR
would develop DR after one year and to use SD-OCT
to detect changes in retinal and choroidal layers over
a period of one year (Tavares Ferreira J et al., 2016).
These 125 type 2 diabetic patients without DR
showed that after one year, independent of the
development of DR, the choroidal thickness (CT)
increased between 10 and 17 µm (p<0001 to 0003),
and there was a decrease in the GCL (I3 and N6
sectors), IPL (S6 and N6 sectors), INL (T6 and N6
sectors), OPL (S6 sector) and overall RT (S3, N3, I3,
S6 and T6 sectors) (p<0.001). Interestingly, in this
study, the variable retinopathy was negatively
associated with the overall RT (central, S3, T3 I3 and
N3 sectors), ONL (T6 and I6 sectors) and PR layer
(N6 sector). In the span of just one year, the presence
of DR decreased the overall RT in the studied
locations between 13.04 and 16.63 µm (Tavares
Ferreira J et al., 2016).
Overall these results may be explained by a
process of inflammation which accompanies or
precedes the early cell apoptosis of the DR. Thus,
before there is a thinning of the different inner retinal
layers, there is a significant thickening compared to
non-diabetic patients. When some cells are in
apoptotic stage and others in inflammatory phase
probably we will not find any significant differences
in the thickness of the retinal layers. Further, when
analysing the RPE layer, a significant association
between the RPE thickness and the CT was noticed,
so it is important to include the variable CT in the
regression models. Ferreira et al. found that the CT in
diabetic patients without DR was increased in
comparison with non-diabetic subjects, (Ferreira et
al., 2015) and since the choroid supplies the RPE the
referred association between CT and RPE would be
expected.
This last study had some limitations (Tavares
Ferreira J et al., 2016). Firstly, despite including 125
diabetic patients without DR, when divided into
groups according to diabetes duration, their sample
sizes became small. However this is the first study
with a considerable sample that splits the diabetic
patients according to disease duration, and yet finding
differences in these subgroups compared to non-
diabetic subjects. Secondly, retinal measurements
were done with automatic software. The ideal retinal
layers segmentation is one that involves automatic
segmentation with supervision and manual correction
when necessary. In this way, a manual correction was
performed when the segmentation was inaccurate by
an ophthalmologist masked to the patients’ diagnosis.
Thirdly, all diabetic patients had type 2 DM meaning
that the onset of diabetes was self-reported and could
thus be underestimated.
3 CONCLUSIONS
In conclusion, diabetic patients without DR have a
thinning of some retinal layers (inner retinal and PR
layers), when compared to a non-diabetic group.
There are early changes in retinal layers of diabetic
patients even without clinical signs of DR that
probably correspond to an inflammatory and
apoptotic process of the retina as neurovascular unit.
In diabetic patients without DR at the one-year
follow-up point, was observed overall thickening of
the choroid and decreases in the thickness of the inner
retinal layers (GCL, IPL and INL) and overall retinal
thickness (RT). Thus, when patients develop DR, the
choroid begins to decrease along with the overall RT
and PR layer thickness.
The OCT is a new technology that allows the
diagnosis of early retinal and choroid structural

changes of diabetic patients before the onset of
diabetic retinopathy.
REFERENCES
Arden, G. B. (2001) ‘The absence of diabetic retinopathy in
patients with retinitis pigmentosa: implications for
pathophysiology and possible treatment.’, The British
journal of ophthalmology, 85(3), pp. 366–70.
Barber, A. J., Lieth, E., Khin, S. A., Antonetti, D. A.,
Buchanan, A. G. and Gardner, T. W. (1998) ‘Neural
apoptosis in the retina during experimental and human
diabetes. Early onset and effect of insulin.’, The Journal
of clinical investigation, 102(4), pp. 783–91.
Carpineto, P., Toto, L., Aloia, R., Ciciarelli, V., Borrelli, E.,
Vitacolonna, E., Di Nicola, M., Di Antonio, L. and
Mastropasqua, R. (2016) ‘Neuroretinal alterations in
the early stages of diabetic retinopathy in patients with
type 2 diabetes mellitus.’, Eye (London, England),
30(5), pp. 673–9.
Carrasco, E., Hernández, C., Miralles, A., Huguet, P.,
Farrés, J. and Simó, R. (2007) ‘Lower somatostatin
expression is an early event in diabetic retinopathy and
is associated with retinal neurodegeneration.’, Diabetes
care, 30(11), pp. 2902–8.
Carrasco, E., Hernández, C., de Torres, I., Farrés, J. and
Simó, R. (2008) ‘Lowered cortistatin expression is an
early event in the human diabetic retina and is
associated with apoptosis and glial activation.’,
Molecular vision, 14, pp. 1496–502.
Ceklic, L., Maár, N. and Neubauer, A. S. (2008) ‘Optical
coherence tomography fast versus regular macular
thickness mapping in diabetic retinopathy.’,
Ophthalmic research, 40(5), pp. 235–40.
Chhablani, J., Sharma, A., Goud, A., Peguda, H. K., Rao,
H. L., Begum, V. U. and Barteselli, G. (2015)
‘Neurodegeneration in Type 2 Diabetes: Evidence
From Spectral-Domain Optical Coherence
Tomography.’, Investigative ophthalmology & visual
science, 56(11), pp. 6333–8.
Ctori, I. and Huntjens, B. (2015) ‘Repeatability of Foveal
Measurements Using Spectralis Optical Coherence
Tomography Segmentation Software.’, PloS one, 10(6),
p. e0129005.
van Dijk, H. W., Kok, P. H. B., Garvin, M., Sonka, M.,
Devries, J. H., Michels, R. P. J., van Velthoven, M. E.
J., Schlingemann, R. O., Verbraak, F. D. and Abràmoff,
M. D. (2009) ‘Selective loss of inner retinal layer
thickness in type 1 diabetic patients with minimal
diabetic retinopathy.’, Investigative ophthalmology &
visual science, 50(7), pp. 3404–9.
van Dijk, H. W., Verbraak, F. D., Kok, P. H. B., Garvin, M.
K., Sonka, M., Lee, K., Devries, J. H., Michels, R. P. J.,
van Velthoven, M. E. J., Schlingemann, R. O. and
Abràmoff, M. D. (2010) ‘Decreased retinal ganglion
cell layer thickness in patients with type 1 diabetes.’,
Investigative ophthalmology & visual science, 51(7),
pp. 3660–5.
van Dijk, H. W., Verbraak, F. D., Kok, P. H. B., Stehouwer,
M., Garvin, M. K., Sonka, M., Hans Devries, J.,
Schlingemann, R. O. and Abràmoff, M. D. (2012)
‘Early neurodegeneration in the retina of type 2 diabetic
patients’, Investigative Ophthalmology and Visual
Science, 53(6), pp. 2715–2719.
van Dijk, H. W., Verbraak, F. D., Stehouwer, M., Kok, P.
H. B., Garvin, M. K., Sonka, M., DeVries, J. H.,
Schlingemann, R. O. and Abràmoff, M. D. (2011)
‘Association of visual function and ganglion cell layer
thickness in patients with diabetes mellitus type 1 and
no or minimal diabetic retinopathy.’, Vision research,
51(2), pp. 224–8.
Du, Y., Veenstra, A., Palczewski, K. and Kern, T. S. (2013)
‘Photoreceptor cells are major contributors to diabetes-
induced oxidative stress and local inflammation in the
retina.’, Proceedings of the National Academy of
Sciences of the United States of America, 110(41), pp.
16586–91.
Dutra Medeiros, M., Mesquita, E., Gardete-Correia, L.,
Moita, J., Genro, V., Papoila, A. L., Amaral-Turkman,
A. and Raposo, J. F. (2015) ‘First incidence and
progression study for diabetic retinopathy in Portugal,
the RETINODIAB study: Evaluation of the screening
program for Lisbon region’, Ophthalmology. Elsevier
Inc, 122(12), pp. 2473–2481.
Dutra Medeiros, M., Mesquita, E., Papoila, a. L., Genro, V.
and Raposo, J. F. (2015) ‘First diabetic retinopathy
prevalence study in Portugal: RETINODIAB Study--
Evaluation of the screening programme for Lisbon and
Tagus Valley region’, British Journal of
Ophthalmology, 99(10), pp.1328-33.
Ferreira, J., Vicente, A., Proença, R., Dias-Santos, A.,
Santos, B., Cunha, J. P. and Abegão Pinto, L. (2015)
‘Choroidal Thickness in Diabetic Patients without
Diabetic Retinopathy’, Acta Ophthalmologica,
93(S255). doi:10.1111/j.1755-3768.2015.0488.
Fischer, M. D., Huber, G., Beck, S. C., Tanimoto, N.,
Muehlfriedel, R., Fahl, E., Grimm, C., Wenzel, A.,
Remé, C. E., van de Pavert, S. A., Wijnholds, J., Pacal,
M., Bremner, R. and Seeliger, M. W. (2009)
‘Noninvasive, in vivo assessment of mouse retinal
structure using optical coherence tomography.’, PloS
one, 4(10), p. e7507.
Garcia-Ramírez, M., Hernández, C., Villarroel, M., Canals,
F., Alonso, M. A., Fortuny, R., Masmiquel, L., Navarro,
A., García-Arumí, J. and Simó, R. (2009)
‘Interphotoreceptor retinoid-binding protein (IRBP) is
downregulated at early stages of diabetic retinopathy.’,
Diabetologia, 52(12), pp. 2633–41.
De Gooyer, T. E., Stevenson, K. A., Humphries, P.,
Simpson, D. A. C., Gardiner, T. A. and Stitt, A. W.
(2006) ‘Retinopathy is reduced during experimental
diabetes in a mouse model of outer retinal
degeneration’, Investigative Ophthalmology and Visual
Science, 47(12), pp. 5561–5568.
‘Grading diabetic retinopathy from stereoscopic color
fundus photographs--an extension of the modified
Airlie House classification. ETDRS report number 10.
Early Treatment Diabetic Retinopathy Study Research

Group.’ (1991) Ophthalmology, 98 (5 Suppl), pp. 786–
806.
International Diabetes Federation (IDF) (2015) ‘IDF
Diabetes Atlas 7th edition’, idf.org.
Kern, T. S. and Berkowitz, B. A. (2015) ‘Photoreceptors in
diabetic retinopathy.’, Journal of diabetes
investigation, 6(4), pp. 371–80.
Klein, B. E. K. (2007) ‘Overview of epidemiologic studies
of diabetic retinopathy.’, Ophthalmic epidemiology,
14(4), pp. 179–183.
Nagaoka, T., Kitaya, N., Sugawara, R., Yokota, H., Mori,
F., Hikichi, T., Fujio, N. and Yoshida, a (2004)
‘Alteration of choroidal circulation in the foveal region
in patients with type 2 diabetes.’, The British journal of
ophthalmology, 88(8), pp. 1060–1063.
Simó, R. and Hernández, C. (2014) ‘Neurodegeneration in
the diabetic eye: New insights and therapeutic
perspectives’, Trends in Endocrinology and
Metabolism, 25(1), pp. 23–33.
Tavares Ferreira J, Alves M, Dias-Santos A, Costa L,
Santos BO, Cunha JP, Papoila AL, Abegão Pinto L.
(2016) ‘Retinal Neurodegeneration in Diabetic Patients
without Diabetic Retinopathy’, Investigative
Ophthalmology and Visual Science, 57(14), pp. 6455-
6460.
Vujosevic, S. and Midena, E. (2013) ‘Retinal layers
changes in human preclinical and early clinical diabetic
retinopathy support early retinal neuronal and müller
cells alterations’, Journal of Diabetes Research, 2013,
pp. 905058.
