
OptiHealth: A Recommender Framework for Pareto Optimal Health
Insurance Plans
Fernando Boccanera and Alexander Brodsky
Computer Science Department, George Mason University, Fairfax, VA 22030, U.S.A.
Keywords: Recommender, Personalization, Health Insurance Plan Choice, Decision Support Systems, Pareto Optimality.
Abstract: Choosing a health insurance plan, even when the plans are standardized, is a daunting task. Research has
shown that the complexity of the task leads consumers to make non-optimal choices most of the time. While
a number of systems were introduced to assist the selection of health insurance plans, they fail to significantly
reduce the main causes of poor decisions. To address this problem, this paper proposes OptiHealth, a
recommender framework for Pareto optimal selection of health insurance plans. The proposed framework is
based on (1) actuarial analysis of medical data and a method to accurately estimate the expected annual cost
tailored to specific individuals, (2) finding and presenting a small number of diversified Pareto optimal plans
based on key performance indicators, and (3) allowing decision makers to iteratively conduct a trade-off
analysis.
1 INTRODUCTION
A decision on choosing a health insurance plan
should not be taken lightly. Such a decision has major
implications for a person’s health, finance and well-
being. At an individual or family level, the financial
implication is significant with some individuals
spending a large share of their income on healthcare.
Choosing a plan is a complex task. Sometimes
there are dozens or even hundreds of plans to choose
from, each with a set of features. A large body of
evidence shows that individuals select health plans
poorly even when the number of plans is small. The
main causes of poor decisions found in the literature
(Hibbard et al, 1997), (Johnson et al, 1993),
(McWilliams et al, 2011), (Tversky, Kahneman,
1974) are complexity, excessive number of choices,
inability to estimate health outcomes, cognitive bias
and high cognitive load. The result is that consumers
end up using simplified heuristics and fail to make a
Pareto optimal decision that is best suited to their
needs.
To help consumers choose health plans, a number
of Decision Support Systems have been developed
and are publicly available. In section 3 we analyze six
widely used systems which are representative of the
state of the art for health plan selection. These
systems are simplistic in nature; they basically
provide a list of all available plans sorted by a
particular plan feature such as deductible. Our
conclusion is that none of them significantly reduces
the main causes of non-optimal decision making.
To address this gap, we propose a recommender
framework for Pareto optimal selection of health
insurance plans called OptiHealth. Designed to
overcome the main causes of human errors or biases,
the framework comprises a detailed decision
methodology and a recommender to guide a decision
maker through the entire health plan selection
process. It extracts demographic and health
information from the user and employs an algorithm
to match this information with actuarial medical data
in order to predict the healthcare utilization for the
upcoming year. It estimates the total annual expected
cost for each plan and then recommends a small
number of Pareto optimal plans. It allows decision
makers to iteratively conduct a trade-off analysis, and
presents alternatives that improve key performance
indicators while minimizing the increase in the
expected cost. The recommender guides decision
makers to the preferred trade-off among Pareto
optimal alternatives.
The contributions of this paper are as follows.
First, we analyze the root causes of non-optimal
decisions and identify desirable features of a technical
solution. Second, we design a method to estimate the
total annual cost of health plans based on actuarial
patient data. Third, we develop recommender
Boccanera, F. and Brodsky, A.
OptiHealth: A Recommender Framework for Pareto Optimal Health Insurance Plans.
DOI: 10.5220/0006334905990609
In Proceedings of the 19th International Conference on Enterprise Information Systems (ICEIS 2017) - Volume 1, pages 599-609
ISBN: 978-989-758-247-9
Copyright © 2017 by SCITEPRESS – Science and Technology Publications, Lda. All rights reserved
599

framework that addresses the desirable features and
produces Pareto optimal recommendations best
suited to decision makers’ needs.
The paper is organized as follows: Section 2 is an
overview of health insurance in the United States and
the issues that surround health insurance decision-
making. Section 3 proposes a set of desirable features
in a Decision Support System and evaluates six
widely used public systems. Section 4 shows the
recommender framework through an example.
Section 5 discusses the personalization of plan cost
estimation. Section 6 describes the architecture of the
recommender framework. Section 7 describes
potential future research and concludes the paper. We
use the terms “Framework” or “recommender
framework” to describe our decision methodology
and the term “recommender” to refer to the system at
the core of the Framework.
2 OVERVIEW OF THE DECISION
TO SELECT A HEALTH
INSURANCE PLAN
In the United States, health care is delivered almost
exclusively by private medical providers such as
hospitals, doctors and pharmacies. Access to health
care is facilitated by private insurance companies
through health insurance plans. The menu of plans to
choose from depends on a person’s eligibility,
employment status and what the employer offers. The
set to choose from range from a handful of plans to
hundreds of plans. As the number of choices increase,
so does the difficulty of making a decision, which can
cause cognitive overload.
A health insurance plan is a complex product. In
general, a plan has a menu of benefits, limitations,
charges a premium and imposes cost-sharing like
deductibles, copays and coinsurance. A copay is a
fixed dollar amount paid for a particular service while
coinsurance is a percentage of the service cost that the
insurer is responsible for. Deductible is an amount the
beneficiary pays before coinsurance kicks in (copays
are not subject to deductible). Insurance plans limit
the risk of a catastrophic financial loss by instituting
a ceiling that the insured is responsible for. This is
called maximum out-of-pocket and does not include
premiums.
Choosing a health insurance plan is a daunting
task even when the plans are standardized in terms of
coverage, as is the case of the plans in the U.S.
exchanges of the Patient Protection and Affordable
Care Act (ACA). The reason is two-fold: there are
dozens of plan characteristics to take into
consideration, plus it requires the estimation of future
utilization of health services as well as the total
annual cost for each plan. This difficulty is well
established in the literature and was acknowledged by
(Frakt, 2014).
A large body of evidence shows that individuals
select non-optimal health plans even when the set of
choices is small. (Quincy, 2012) conducted consumer
testing studies and claimed that participants struggled
to assess the overall coverage of a plan and had
difficulty understanding cost-sharing concepts and
what they meant in their particular case. (Abaluck et
al, 2011) evaluated the choices of elders across their
insurance options under the Medicare Part D
Prescription Drug plan. They found that study
participants placed much more weight on plan
premiums than on expected out-of-pocket costs. Their
partial equilibrium welfare analysis implied that
welfare would have been 27 percent higher if patients
had all chosen rationally, demonstrating not only that
participants chose a plan poorly but also overweighed
the premium factor. (Heiss, 2013) confirmed these
findings; their study suggests that fewer than 25% of
individuals enrol in plans that are ex-ante as good as
the least costly plan specified by the (Medicare Plan
Finder, 2016) tool made available to seniors by the
Medicare Administration, and that consumers on
average had expected excess spending of about $300
per year.
One might argue that the root cause of the above
findings was cognitive decrease due to aging, but
other studies found similar effects in younger
populations. (Johnson, 2013) examined how well
people make plan choices versus how well they think
they do. They conducted six experiments asking
subjects to choose the most cost-effective plan using
websites modelled on health exchanges. Participants
had to estimate the number of doctor visits and the
out-of-pocket costs, and choose between a set of four
or eight plans. The results matched earlier studies
showing that unassisted, and without any tool,
consumers made non-optimal health plan decisions.
They selected the best option only 42% of time with
four plans and 21% with eight. Also these non-
optimal choices cost the 4-plan group $200 more per
year.
The issues we identified with unassisted health
plan decision making are: heavy cognitive load,
cognitive bias, inability to estimate health outcomes
and simplified heuristics.
Heavy Cognitive Load
A substantial body of work in cognitive science,
social psychology, behavioral economics and
ICEIS 2017 - 19th International Conference on Enterprise Information Systems
600

decision science demonstrates how individuals
process and use information for decision making.
This body suggests that the integration of different
types of information and values into a decision is a
very difficult cognitive process and only a small
amount of variables can be processed (Hibbard et al,
1997a). (Slovic, 1982) conducted a study were
participants were asked to make predictions based on
5, 10, 20 and 40 variables. He discovered that as more
information was available, the confidence of
participants increased but the reliability of their
choices decreased. When individuals had more
information, their ability to process it consistently
declined. Cognitive psychology explains this
phenomenon in terms of cognitive load, which refers
to the mental effort to solve a problem. A heavy
cognitive load typically creates an error.
A study by (McWilliams et al, 2011)
demonstrated the heavy cognitive load effect caused
by a health plan decision. They studied Medicare
Advantage plan choice and found that enrolment
decreased when more than thirty plans were
available. Retirees didn’t enrol due to the heavy
cognitive load associated with choosing a plan from a
large number of options.
Cognitive Bias
(Johnson, 1993) studied whether biases in probability
assessment and perceptions of loss affect consumers’
decisions about insurance. They found out that study
participants made hypothetical choices that violated
basic laws of probability and value and exhibited
distortions in their perception of risk and framing
effects. In particular, participants were reluctant to
purchase policies with higher deductibles in part due
to framing the deductible as a segregated loss, which
causes loss aversion. Framing is a type of cognitive
bias (Tversky, Kahneman, 1974).
Inability to Estimate Health Outcomes
Choosing a plan requires an estimation of future
utilization of health services, that is, the type, quantity
and cost of services. This of course requires an
estimation of probabilities which is not easy to do
even in the presence of actual sample data. To
estimate future utilization, it’s also necessary to
estimate the probability that new health conditions,
called morbidities, will be acquired during the plan
year. Once this utilization is estimated, it can be used
to calculate the expected cost for every alternative
plan. These calculations require the use of publicly
available data and expertise that is outside the reach
of all but a small group of individuals.
Simplified Heuristics
(Hibbard et al, 1997b) found that consumers have
limits on how much information they can readily
process and as a result, they simplify the decision
process, often eliminating certain choices or details
and taking heuristic shortcuts (Tversky, Kahneman,
1974) that may lead to erroneous decisions.
Simplified heuristics explain (Abaluck et al,
2011) finding that elders placed much more weight
on plan premiums than on expected out-of-pocket
costs. Calculating expected costs require significant
effort, so decision makers replaced a complex task
with a simpler one: choose the plan with the cheapest
premium.
In summary, the problems identified above with
the unassisted decision making of health plans are:
Decision errors caused by complexity, high
number of choices and inability to estimate
health outcomes.
Decision errors caused by cognitive bias and
simplified heuristics
3 CONSUMER BEHAVIOR,
EXISTING DECISION
SYSTEMS AND DESIREABLE
FEATURES
(Scanlon, 1997) reviewed 35 studies of consumer
health plan choice. “Almost all authors found price to
have a statistically significant negative effect on the
probability of enrolling in a health plan”. Consumers
also favor plans with better benefits over those with
less benefits all else being the same. Some studies
found that consumers differ on their choices
according to their age, gender and health status. This
suggests that consumers need to avoid overweighting
price in their decision making.
In the (Johnson et al, 2013) only one group,
Columbia MBA students, performed reasonably well.
When researchers provided calculation aids to the
non-MBA groups, the performance of these groups
improved to the level of the MBA students. This
suggests that tools and a well-organized decision
process are desirable, which was corroborated by
(Hibbard et al, 1997b) Their study suggested the
following desirable features in a Decision System: 1)
reduction of the processing burden; and 2) a method
that rationalizes the process. x
Based on the above research and the issues
described in Section 2, we propose the following
OptiHealth: A Recommender Framework for Pareto Optimal Health Insurance Plans
601

desirable features in a Decision Support System for
Health Plan Selection:
1. Reduce to a minimum the amount of information
the user needs to process.
2. Use total estimated cost as the main decision
factor as opposed to premium cost alone.
3. Anticipate and help users take risk into
consideration.
4. Personalize risk and cost estimation.
5. Guide users step by step through a rational
process that involves a small number of
recommended plans.
We now evaluate existing Decision Support
Systems against the set of desirable features above.
Wechose a subset of representative systems that are
publicly available.
Table 1 shows which feature each system
satisfies. The tools that implement the most desirable
features are PBGH/CalPERS and CMS Plan Finder.
Checkbook is the only tool that estimates medical
utilization and takes risk into consideration. No
system guides users step by step through a rational
decision process.
4 RECOMMENDER
FRAMEWORK BY EXAMPLE
We propose a recommender framework to reduce the
causes of non-optimal decision making and address
the deficiencies of the existing Decision Support
Systems (DSS) for health plan selection.
The recommender framework introduced in this
paper was designed to satisfy the five criteria outlined
on Section 3. It takes risk into consideration by
estimating the total expected cost of each plan at
various probability levels. Once the total cost and risk
are estimated, it uses key performance indicators
(KPIs) like premium and deductible to recommend a
small number of Pareto optimal plans that have the
minimum expected cost. After the plans are
recommended, it allows the user to conduct trade-off
analysis between the expected cost and the KPIs. The
trade-off analysis is implemented through a critique
technique to improve a particular KPI. The user
iteratively improves KPIs until he is satisfied with the
recommendation
The Framework assumes that the decision maker
is an individual adult, not a family, that the individual
utilizes only in-network plans and that the medical
coverage of each plan is standardized, that is, all plans
cover the same health conditions. For simplification
purposes, it only considers cost KPIs; quality and
availability of providers are not considered although
the Framework can be extended to consider these
non-cost factors. has the following components:
1. Presentation of plan risk profiles
2. Recommendation based on the total estimated
plan cost
3. Trade-off analysis capability
4. Final plan selection
We now explain the recommender framework
through an example; the implementation details are
described in Sections 5 and 6.
Health plans have many characteristics, most of
them related to cost sharing. Table 2 shows the cost
of in-network services for two hypothetical health
plans. We use in-network cost-sharing because they
provide the highest benefits.
Table 1: Evaluation of Existing Decision Support Systems.
System
1.Reduce cognitive
load
2.Use total
estimated cost
3.Consider risk
4. Personalize
5.Guide
users
(eHealthInsurance, 2016)
individuals and small business
N
N
N
No health status
N
(PBGH/CalPERS, 2016)
California gov. employees, retirees
y
User enters
utilization
N
Some health status
N
(Massachusetts Health Connector, 2016)
State of Massachusetts residents
Y
N
N
Some health status
N
(CMS Medicare Plan Finder, 2016)
Medicare Beneficiaries
Y
User enters
utilization
N
Y
N
(Healthcare.gov, 2016)
(Anyone)
Y
Low, med, high
utilization
N
No health status
N
(Consumer Checkbook, 2016)
Federal employees and retirees
N
Y
Y
No health status
N
ICEIS 2017 - 19th International Conference on Enterprise Information Systems
602
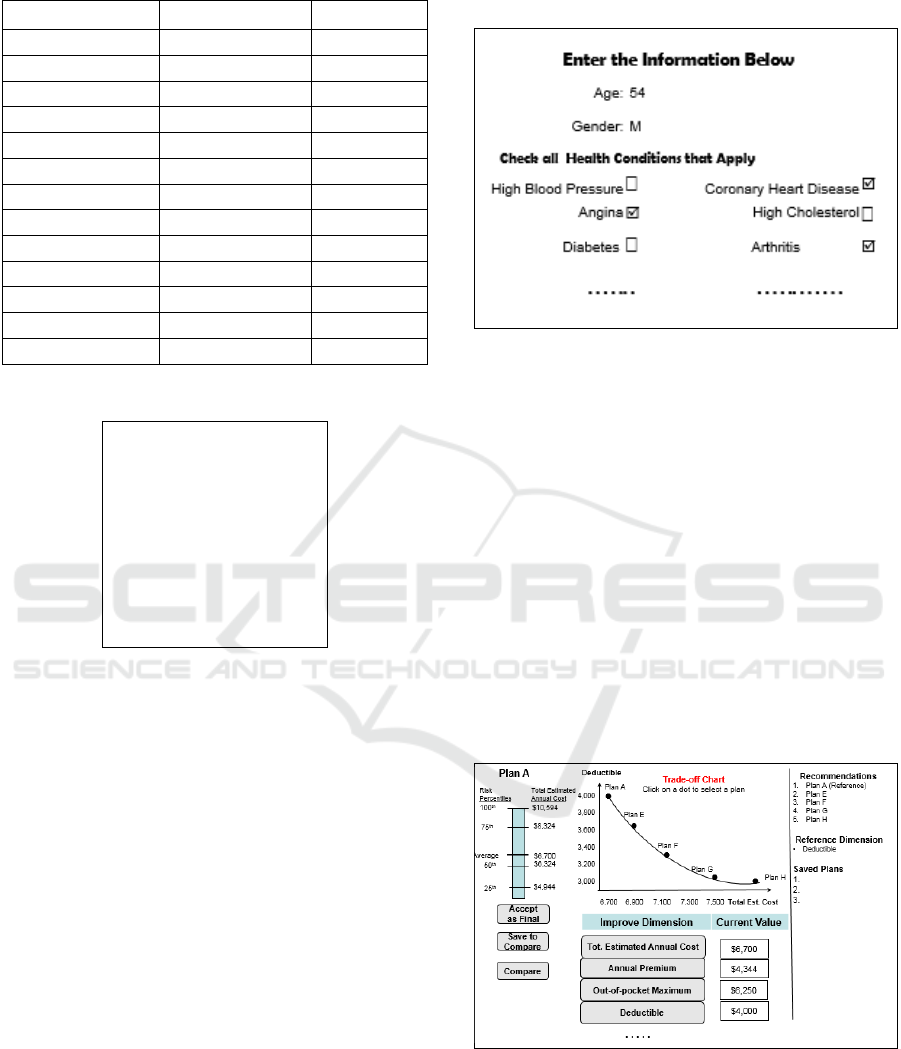
Table 2: Hypothetical In-network Cost Sharing.
Features
Plan A Cost
Plan F Cost
Annual Premium
$4,140
$5,160
Deductible
4,000
$3,300
Out of Pocket Max
$6,454
$4,310
Primary Care Visit
$25
No charge
Specialist Visit
$35
$35
Diagnostic Service
No charge
No charge
Ambulance
No charge
$50
Emergency Room
30%
$100
Inpatient Facility
$200/admission
10%
Inpatient Physician
No charge
$200
Outpatient Facility
$50
20%
Generic Drug
No charge
$10
Brand Drug
$35
20%
Table 3: Common Morbidities.
High blood pressure
Coronary heart disease
Angina
High cholesterol
Diabetes
Arthritis
Chronic Bronchitis
Asthma
Cancer
. . . . .
Table 3 shows a partial list of common health
conditions or morbidities that we use to calculate risk
and medical utilization. Morbidities, also called
Health Conditions, significantly contribute to the
utilization of medical services. In other words, they
are the drivers of medical utilization. We adopt the
comprehensive set of morbidities from the Medical
Expenditure Panel Survey Household Component
(MEPS-HC), published in 2013 by the Agency for
Healthcare Research and Quality.
At the very start the recommender shows the
screen in Figure 1 where the user enters personal
information like age, gender and health conditions
(morbidities). In our example, the user is a 54-year-
old male. For simplicity, only a subset of health
conditions is shown.
Based on the personal information extracted in
Figure 1, the user is presented with the Exploration
Dashboard exemplified in (Figure 2).
The Exploration Dashboard presents five Pareto
optimal recommendations including Plan A, which
has the minimum total estimated annual cost (TEAC).
Plan A is the Reference Plan because the other
recommendations use it as a reference.
Figure 1: User Input.
The top center panel contains the Trade-off Chart
showing the Reference Plan (Plan A) plus four other
recommended plans. The x-axis shows the TEAC
while the y-axis initially shows the Deductible KPI.
Each dot is a plan, with the Reference Plan as the
leftmost dot, and the plans are shown in increasing
order of TEAC. The four recommended plans from E
to H are the plans that have deductibles lower than
Plan A and TEAC closest to Plan A.
The recommended plans are Pareto optimal that
is, no other KPI, called dimension, can be improved
without increasing the TEAC. This means that Plan
A’s $4,000 deductible cannot be improved without
increasing the TEAC, that is, to improve the
deductible it’s necessary to trade-off TEAC, hence
the name Trade-off Chart.
Figure 2: Exploration Dashboard.
The framework deals with the uncertainty of
future medical utilization, by estimating the
probability distribution of the TEAC. The distribution
is showing in the profile bar for Plan A on the top left
panel. The left side of the plan profile bar shows
OptiHealth: A Recommender Framework for Pareto Optimal Health Insurance Plans
603
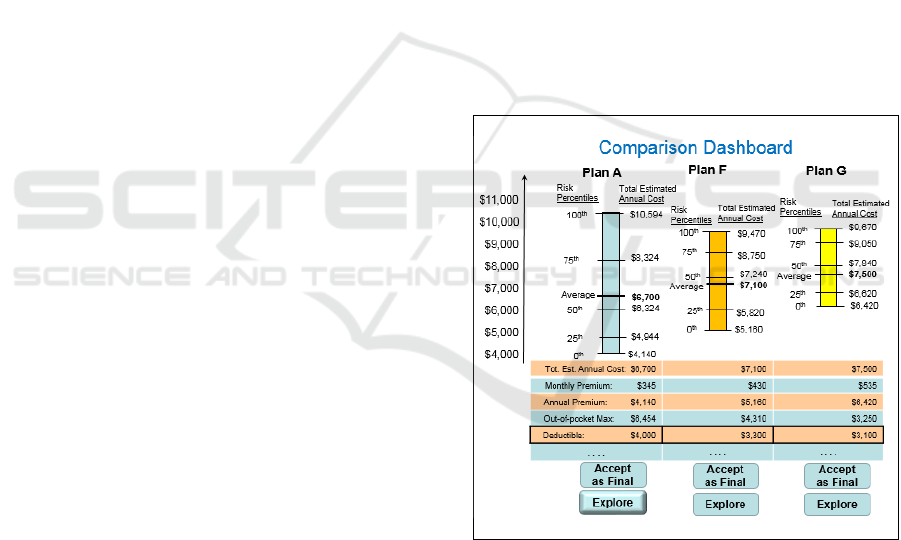
quartiles while the right side shows the TEAC for the
corresponding quartile. The profile is a proxy for risk.
For example, for Plan A, the user has a 25% chance
of spending $4,944 during the plan year while the
average spending is $6,700. The TEAC is based on:
1) the cost sharing of a particular plan; 2) an estimate
of the utilization of medical services and 3) an
estimate of the cost of services. The estimations are
based on historical data from actual patients with
health conditions, age and gender similar to the user.
The lower center panel shows the cost-sharing
values for the dimensions of the Reference Plan and
come from Table 2. The right panel displays all
recommended plans, the chosen reference dimension
and the plans saved for comparison if any.
As the name implies, the Exploration Dashboard
allows the user to explore different plans, their
dimensions and conduct trade-off analysis. The user
can:
1. Accept the Reference Plan as the final selection.
2. Save the Reference Plan for comparison.
3. Compare the last three saved plans.
4. Choose another Reference Plan by clicking on the
dot corresponding to the desired plan on the chart.
5. Improve (reduce) the value of a particular
dimension by clicking on the corresponding button.
Let’s say the user wants to improve (reduce) the
out-of-pocket maximum. He/she clicks on the button
labelled “Out-of-pocket Max” and the system
responds by recreating the Trade-off Chart with Out-
of-pocket Maximum in the y-axis. The new chart
would show the top-5 plans with Out-of-pocket
Maximum equal or lower than the Reference Plan.
The Trade-off Chart allows the user to conduct a
trade-off analysis prior to making a final selection.
It’s a trade-off because improving any dimension
increases the TEAC because the recommended plans
are Pareto optimal.
If the user selects a new Reference plan in the
Trade-off Chart, then the profile bar on the left and
the bottom center panel are updated to reflect the
selected plan.
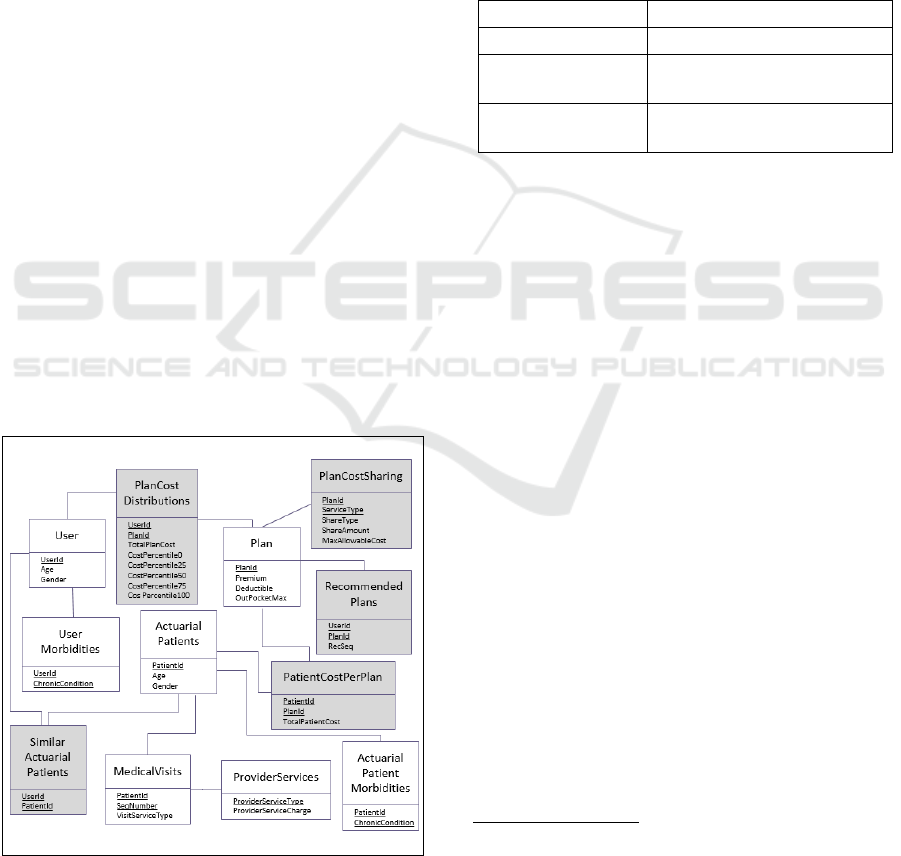
If the user clicks on the “Compare” button, then
the Comparison Dashboard is displayed (Figure 3). It
shows the last three saved plans side by side. The top
panel displays the profile bars while the bottom panel
displays the values for the plan dimensions. The
comparison is useful for conducting risk analysis, for
example, if a particular user thinks that his medical
utilization for the next year will be below average,
then Plan A is the optimal plan because it has the
lowest total cost for each quartile. On the other hand,
if the utilization will be way above average, then Plan
F has the optimal risk profile.
The Comparison Dashboard allows the user to
accept a particular plan as final or to conduct further
analysis by clicking on the Explore button. The idea
behind exploration is that the user likes a particular
recommendation but wants to further analyze it and
perhaps improve some of the plan dimensions.
If the user presses Explore for plan A, the screen
in Figure 2 is shown. The process repeats until the
user clicks on the “Accept as Final” button in either
dashboard.
For an individual with zero medical utilization,
the TEAC is just the premium consequently Plan A in
Figure 3 is optimal. For an individual with an
extremely high utilization, the total cost is the
premium plus the out of pocket maximum so Plan F
is optimal. For an individual with moderate
utilization, the optimal plan usually is the one with the
least total cost although the system allows the user to
perform a trade-off analysis prior to making the final
selection.
Figure 3: Comparison Dashboard.
5 PERSONALIZED PLAN COST
ESTIMATION
The estimation of personalized plan costs is required
for the creation of the risk profiles and trade-off
charts, which are produced by the system and shown
on the Exploration and Comparison Dashboards
(Figures 2 and 3).
ICEIS 2017 - 19th International Conference on Enterprise Information Systems
604
It is a non-trivial task to estimate the future
medical utilization, i.e., medical services like those in
Table 2 that the user may need during the health plan
period of coverage. To estimate future medical
utilization, we need to take into account key drivers
such as demographics (age, sex) and health
conditions like those in Table 3.
Our approach uses patient historical data to
produce a subset of real patients that have health
conditions similar to the user. We estimate the cost of
a given plan as the average cost of the plan over all
patients in the historical database that are similar to
the user in terms of his/her medical utilization drivers.
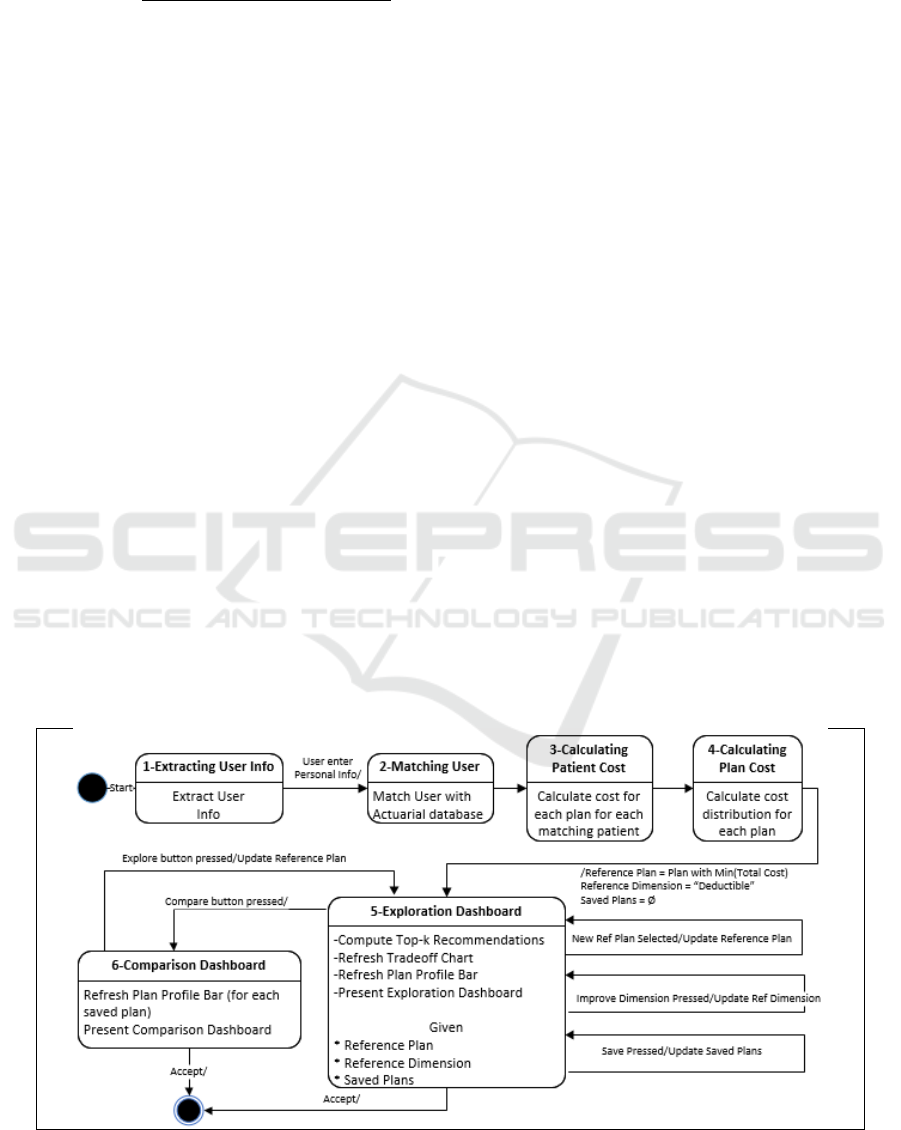
5.1 Data Model
We assume that three datasets exist: 1) historical data
from actual patients; 2) cost data from providers; and
3) plan data from insurance companies. We capture
these datasets in the model shown in Figure 4. Each
relational table is represented by a rectangle with the
name above the line and the data elements below.
Data elements that are components of the primary key
are underlined.
The User and the UserMorbidities tables
represent a user of the system while the Plan table
represents all insurance plans available to the user.
The ActuarialPatients, ActuarialPatientsMorbidities
and MedicalVisits tables capture actual patients and
their medical utilization, while ProviderServices
captures the provider charge for each type of service
utilized by the actual patient. The tables with a shaded
background are produced by the recommender while
the tables with no shade are given.
Figure 4: Database Model.
5.2 Data Source
We use two data sources to populate the historical
patient data in the recommender database: the
Medical Expenditure Panel Survey (MEPS)
Household Component (HC) and the Medical
Provider Component (MPC) from the Agency for
Healthcare Research and Quality. We chose these
datasets because they are the most complete source of
data on the cost and use of health care and health
insurance coverage in the United States. The raw data
that we use from the MEPS is shown in Table 4.
Table 4: MEPS-HC and MEPS-MPC Data.
Demographics
Age, gender, …
Chronic Conditions
All in Table 3 and more
Utilization
For each type of service, # of
utilizations
Expenditure
For each type of service, total
charge by provider
The ActuarialPatients and
ActuarialPatientsMorbidities come directly from
MEPS-HC while ProviderServices comes from
MEPS-MPC.
The MedicalVisits is based on the MEPS-HC but
is not a direct mapping. The problem with the raw
MEPS-HC dataset is that it does not capture the
individual visits to medical providers. Instead, it
captures the aggregate number of utilizations for each
service type as well as the aggregate cost
consequently it cannot be used directly to calculate
the total utilization cost. Another issue is that
providers calculate cost for each instance of
utilization in the order that they occur. We address
this problem by averaging two approximations of the
medical visits’ sequence where the first sequence
leads to the minimum cost and the second sequence
leads to the maximum cost. This is explained in more
detail in subsection 5.3.
5.3 Calculation of Personalized Plan
Cost
We now formalize the calculations to estimate
personalized plan costs. Personalized means that the
estimation is based on attributes of the user of the
system.
Given the following:
OptiHealth: A Recommender Framework for Pareto Optimal Health Insurance Plans
605

-
We want to compute:
Computations:
First, we produce the SimilarActuarialPatients
table, which is the set of Actuarial Patients similar to
the user.
Note that the user morbidities are given at the
beginning of the period of coverage. In the MEPS-HC
data, the actuarial morbidities are captured in Round
1 of interviews prior to any medical utilization
actually happen. Because both user and actuarial
patients’ morbidities are ex-ante, we can use the
similarity matching equation above.
Second we calculate, for a particular patient, the
cost for the visits that do not exceed the deductible.
Note that until the deductible is reached, the patient
pays the full charge for coinsurance-based services up
to the maximum allowed by the plan. The cost for
copay-based services is always a flat fee.
For all ap in SAP(u),all p in P,all v from 1 to NoVisits(ap),
Third, we calculate the cost for the first
coinsurance visit that exceeds the deductible.
Fourth, we calculate the cost for the remaining
visits that exceed the deductible.
Fifth, we calculate the total estimated cost for all
visits for patient ap, which is capped by the out of
pocket maximum for the plan.
Sixth, we estimate the TEAC for user u, which is the
average utilization cost of all similar actuarial patients
plus the premium. This result is used to populate the
ICEIS 2017 - 19th International Conference on Enterprise Information Systems
606
TotalPlanCost attribute of the PlanCostDistribution
table.
Because the MEPS data does not have the precise
sequence of medical visits for an actuarial patient, we
create two sequences of vst(ap,v); one that leads to the
minimum cost for patient ap and another that leads to
the maximum cost. The computations above are then
performed for each sequence and the results are
averaged. This means that the variable
PatientCost(ap,p) used in the computation of
PlanCost(u,p) is the average cost of both sequences.
5.4 Plan Risk Profile
Figure 2 and 3 show the risk profile bars for several
plans. A profile bar is a proxy for risk. The left side
shows quartiles while the right side shows the total
estimated annual cost for the corresponding quartile.
Quartiles are percentiles at quarter intervals, in
our case 0, 25, 50, 75 and 100. We calculate the
distribution of the cost and then the quartile ranks and
populate the PlanCostDistribution table.
6 RECOMMENDER
FRAMEWORK
ARCHITECTURE
The recommender is modelled by the UML Statechart
in Figure 5. The system is a constraint-based
conversational recommender with two phases. In the
first phase (states 1 to 4), the system computes a small
number of recommendations while in the second
phase (states 5 and 6), it interacts with the user to
refine the recommendations in a feedback loop.
In State 1, the system presents the screen in Figure
1 and the user enters his/her age, gender and health
conditions (the morbidities in Table 3). In State 2, the
system matches the user’s age, gender and
morbidities to the ActuarialPatients data to determine
the set of similar patients and produces the
SimilarActuarialPatients table according to the
calculations in Section 5.3. The given data in the
MEPS-based tables are interpreted as implicit
preferences, that is, by using a particular health care
service, the MEPS-HC surveyed patients expressed a
need, which is a hard preference.
In State 3, the system calculates the actual cost for
each plan for each similar patient using the formal
model described in Section 5.3. In State 4 step 1, the
cost per patient per plan is sorted and the total
estimated annual cost for each quartile level is
computed for each plan. These various costs comprise
the plan risk profiles and these profiles are
personalized because they are based on the
information the user provided.
In State 4 step 2, the dominated plans are removed
from the Personalized Plan database. Given a set of
plans P and a set of dimensions D, we say that plan
p P is dominated if it can be improved in at least
one dimension without sacrificing any other
dimension, i.e.,
)
Where
means strictly better on
Figure 5: Recommender System UML Statechart.
OptiHealth: A Recommender Framework for Pareto Optimal Health Insurance Plans
607

dimension
d
and
means better or
equivalent on dimension
.
In State 4 step 3, the top plan, namely the
Reference Plan, is calculated. The top plan is the plan
with the minimum Total Estimated Annual Cost. The
Reference Dimension is set as “Deductible” while the
set of Saved Plans is initialized as null. From State 4
on, the state of the system is determined by the
following state variables: Reference Plan, Reference
Dimension and Saved Plans.
State 5 is the Exploration Dashboard, which is the
core of the system. Upon entry to the Exploration
Dashboard, the system:
1. Computes the top-5 recommendations.
2. Refreshes the Trade-off Chart.
3. Refreshes the Plan Profile Bar.
4. Presents the Exploration Dashboard (Figure
2).
The computation of the top-5 recommended plans
in State 5 step 1 is as follows:
1. Top recommendation r
0
= Reference Plan
2. For every i = 1 to 4, r
i
is the plan with the lowest
total expected cost higher than r
0
and r
i
(reference
dimension) r
0
(reference dimension)
The top-5 recommendations are Pareto optimal
because all dominated plans were removed in State 4
step 2.
In State 5 step 2, the system refreshes the trade-
off chart. In step 3, it uses the Reference Plan to
refresh the plan profile bar and in step 4 it displays
the Exploration Dashboard (Figure 2).
From the Exploration Dashboard, if the user
clicks the “Accept as Final” button, the process ends.
If the user clicks “Save for Compare”, the systems
adds the Reference Plan to the set of Saved Plans. If
a plan in the Trade-off Chart is clicked, that plan
becomes the Reference Plan and the Exploration
Dashboard state is entered again, which forces the
recalculation of the top-5 recommended plans.
If a dimension button is pressed, the Reference
Dimension is updated and the Exploration Dashboard
state is re-entered. Pressing a dimension button
critiques the corresponding dimension, that is,
improves it. Because the recommended plan is Pareto
optimal, there is no other plan that has a lower total
cost for the same dimension, consequently the user
has to trade-off a lower dimension for a certain
increase in the TEAC.
If the “Compare” button is pressed the system
then enters State 6, the Comparison Dashboard. Upon
entry to the Comparison Dashboard, the system
refreshes the Plan Profile Bar for each saved plan and
then presents the Compare Dashboard (Figure 3). The
top panel displays the profile bars while the bottom
panel displays the values for the plan dimensions. The
comparison is useful for conducting risk analysis.
From the Comparison Dashboard, if the user
clicks on “Explore”, the plan selected is set as the
Reference Plan and the system enters the Exploration
Dashboard state. If the user clicks the “Accept as
Final” button, the Reference Plan becomes the chosen
plan and the process ends.
7 CONCLUSION
This paper proposes OptiHealth, a recommender
framework for the selection of Pareto optimal health
insurance plans. OptiHealth was designed to
overcome the main causes of human errors or biases
as well as the limitations of current Decision Support
Systems. The recommender uses actuarial data to
estimate the total annual cost for each plan and then
recommends a small number of Pareto optimal plans.
It allows the decision maker to iteratively critique
specific parameters of a plan, and presents
alternatives that improve the critiqued parameters
while minimizing the increase of the expected cost.
The iterative critique process guides the decision-
maker to the preferred trade-off among Pareto
optimal alternatives.
We claim that the proposed recommender
framework achieves the five desirable features. It 1)
reduces cognitive overload; 2) uses total estimated
cost as the main decision factor; 3) takes risk into
consideration; 4) personalizes risk and total cost; and
5) guides users through a rational process that
involves a small number of recommended Pareto
optimal plans.
Future research could improve the similarity
matching formula by allowing patients that have
similar but not identical morbidities, use a range of
ages instead of a single one and use other
demographic parameters. Other improvements would
be to generalize the Framework to handle an entire
family instead of a single individual and to relax the
assumption that all plans have the same coverage.
Future research also could develop a prototype of the
recommender.
REFERENCES
Abaluck, J., Gruber, J., 2011. Choice Inconsistencies
among the Elderly: Evidence from Plan Choice in the
Medicare Part D Program. American Economic Review,
101(4): 1180-1210.
CMS Medicare Plan Finder, 2016. https://www.medicare
.gov/find-a-plan/questions/home.aspx
ICEIS 2017 - 19th International Conference on Enterprise Information Systems
608

Consumer Checkbook, 2016. https://www.checkbook.org/
newhig2/hig.cfm
eHealthInsurance, 2016. https://www.ehealthinsurance.com/
Frakt, A., 2014. Choosing a Health Plan is Hard, Even for
a Health Economist (me). The Incidental Economist
blog, October 29, 2014.
Heiss, F., Leive, A., McFadden, D., Winter, J., 2013. Plan
selection in Medicare Part D: Evidence from
administrative data, Journal of Health Economics,
Elsevier, vol. 32(6), pages 1325-1344.
Healthcare.gov, 2016. https://www.healthcare.gov/
Hibbard, J., Jewett, J., Legnini, M., Tusler, M., 1997a.
Choosing A Health Plan: Do Large Employers Use The
Data? Health Affairs, vol. 16, no. 6, pp. 172-180.
Hibbard, J., Slovic, P., Jewett, J., 1997b. Informing
consumer decisions in health care:implications from
decision-making research. Milbank Quarterly
75(3):395–414.
Johnson, J., Hershey, J., Meszaros, J., Kunreuther, H.,
1993. Framing, probability distortions, insurance
decisions. Journal of Risk and Uncertainty 7: 35–51.
Johnson, E., Hassin, R., Baker, T., Bajger, A., Treuer, G.,
2013. Can Consumers Make Affordable Care
Affordable? The Value of Choice Architecture. PLoS
ONE 8(12): e81521.
Massachusetts Health Connector, 2016.
https://betterhealthconnector.com/
Medical Expenditure Panel Survey, 2013. Agency for
Healthcare Research and Quality. U.S. Department of
Health & Human Resources.
http://meps.ahrq.gov/mepsweb/
McWilliams, J., Afendulis, Christopher, McGuire, T.,
Landon B., 2011, Complex Medicare Advantage
Choices May Overwhelm Seniors, Health Affairs,
2011;30(9):1786–94.
PBGH/CalPERS, 2016.
https://calpers2015.chooser2.pbgh.org/
Quincy, L., 2012. What's Behind the Door: Consumer
Difficulties Selecting Health Plans. Health Policy
Brief, January 2012, Consumer Union.
Scanlon, D., Chernew, M., Lave, J., 1997. Consumer Health
Plan Choice: Current Knowledge and Future
Directions. Annual Review Public Health 1997, 18:507-
28
Slovic, P., 1982. Toward Understanding and Improving
Decisions. Human Performance and Productivity: Vol.
2, Information Processing and Decision Making, ed.
W.C. Howell and E.A. Fleishman (Hillsdale, N.J.:
Erlbaum, 1982), 157–183.
Tversky, A., Kahneman, D., 1974. Judgment under
Uncertainty: Heuristics and Biases. Science 27 Sep
1974: Vol. 185, Issue 4157, pp. 1124-1131. DOI:
10.1126/science.185.4157.1124.
OptiHealth: A Recommender Framework for Pareto Optimal Health Insurance Plans
609
