
A Web Platform for the Systematic Monitoring of Coastal Structures
Alexandre Maia
1
, Armanda Rodrigues
1
, Rute Lemos
2
, Rui Capit
˜
ao
2
and Conceic¸
˜
ao Juana Fortes
2
1
NOVA LINCS, Departamento de Informtica, FCT-NOVA, Universidade Nova de Lisboa, Caparica 2829-516, Portugal
2
Hydraulics and Environment Department (DHA), National Laboratory for Civil Engineering (LNEC),
Av. do Brasil, 101, Lisbon, 1700-066, Portugal
Keywords:
Geographic Information System, Coastal Structures, Risk Assessment, Adaptation, Georeferencing, Mobile
Devices.
Abstract:
Due to both its geographic location and maritime importance, Portugal is equipped with a large number of
port infrastructures, the majority of which built for goals such as to guarantee the tranquility of the sheltered
areas of the harbour basins, to help controlling sedimentation by guiding the currents, to protect water taken
from thermoelectric plants, amongst others. In Portugal, the most common of these structures is the rubble-
mound breakwater. Due to its characteristics, maintenance or repair works are common throughout its lifetime.
However, the need for these repair works should be evaluated in advance, in order to avoid significant costs
associated to those works or, even worse, the collapse of the structure. It is therefore quite important to evaluate
the Present Condition of the structure, as well its Evolution and Risk Conditions. The Present Condition
is periodically checked on-site and all relevant data gathered is recorded, by filling in inspection forms, in
order to perform further comparisons and analyses with previous inspections of the structure, as to eventually
characterize Evolution and Risk conditions. To expedite all this process and prevent likely occurrence of errors
in data collection, a monitoring tool, supported through a map-based online geographic information system
(WebGIS) was developed, enabling the georeferencing of the structures concerned. This system adapts to the
location of the user’s device and to the capacities of the device itself. Media data, such as photos and videos
can be associated to the structural data collected. The resulting platform was successfully evaluated by the
involved researchers from Portuguese National Laboratory for Civil Engineering (which are the end users of
the system), and by non-expert users.
1 INTRODUCTION
Coastal areas represent a dynamic environment of vi-
tal importance for human society. A significant part
of human settlements are located near the coast. In
coastal areas and in ports, the evaluation of wave
breaking and overtopping in maritime structures is
very important in order to assess the risk associated
with either the failure of these structures or with the
flooding of the protected structures. In Portugal, be-
cause of the length of the coast line, the concentra-
tion of population and economic activity near the sea
and the importance of ports to the national economy,
the impact of sea agitation on coastal buildings and
structures needs to be taken into account. Recent ex-
amples of emergency situations in Portugal caused by
sea waves hitting the coast are (Sabino et al., 2015):
Esmoriz. Flooding due to overtopping of the seawall
in February 2011, with damages in the infrastruc-
ture and homes along the seafront;
Estoril. Frequent overtopping of the seawall, which
afects its use and disrupts the nearby railway line;
Praia da Vit
´
oria Port, Azores. Strong overtopping
of the breakwaters completely destroyed the struc-
tures after a December 2001 storm;
Marina do Lugar de Baixo, Madeira. Repeated
events of massive overtopping of the breakwater
in 2006, damaging the structure quite seriously
and leading to the marina inoperability.
To this date, records of the condition of a mar-
itime structure or of parts of it are mostly generated
on paper, a media more prone to mistakes. The orig-
inal paper filling forms will, on the other hand, most
likely be passed onto a computer file. This further
step means additional delay and constitutes another
possible source of errors and inconsistencies.
It is therefore important to implement an on-
line system to support and facilitate the direct digi-
102
Maia, A., Rodrigues, A., Lemos, R., Capitão, R. and Fortes, C.
A Web Platform for the Systematic Monitoring of Coastal Structures.
DOI: 10.5220/0006335401020111
In Proceedings of the 3rd International Conference on Geographical Information Systems Theory, Applications and Management (GISTAM 2017), pages 102-111
ISBN: 978-989-758-252-3
Copyright © 2017 by SCITEPRESS – Science and Technology Publications, Lda. All rights reserved

tal gathering of information during visual inspection
of coastal structures, which is conducted periodically.
Relevant information to be collected includes struc-
tural data as well as media content, such as photos
and videos, captured from previously defined loca-
tions physically marked on the ground and considered
relevant for the evaluation of the structure.
In this paper, a WebGIS system for the on-site col-
lection of information concerning the current struc-
tural condition of coastal structures, is presented.
The geographic features associated with each relevant
structure can be periodically uploaded into the sys-
tem, in shapefile format, and consequently overlaid on
a map of the region. Information on the general prop-
erties of the structures, such as their length, width and
other characteristics is also contemplated on the sys-
tem’s database. The location of Observation points
(previously defined locations for analysis and photo
capture) is also stored on the database and superim-
posed on the map as yellow markers. The gathered
photos and videos can be accessed thanks to the as-
sociation of these markers with the files located in a
directory of the server. All of this enables the geo-
graphic referencing of the coastal structures and of
the photos captured. The database also contains all
the alphanumeric information that is collected during
visual inspections.
The coastal structures considered in this system
are composed of sections and the availability of this
information enables the qualitative and quantitative
evaluation of the so-called Present Condition of these
sections. When more than one visual inspection of the
same structure are available on the system, collected
at different dates, Evolution Conditions can also be
calculated. A Risk Condition can be calculated when
the Present Condition, as well as the Evolution Con-
dition, are available. These parameters help to define
and prioritize the structure’s needs for repair.
This system improves on the existing methodol-
ogy for the evaluation of the condition of coastal
structures, adding in productivity and minimizing
mistakes, by saving the time previously used in in-
serting, into the computer, all the information that was
gathered, on paper, during a visual inspection. It also
enables the integration of all the relevant information,
in the evaluation of the condition of coastal structures,
into a single platform, instead of having the photos
and the alphanumeric information completely sepa-
rated. Moreover, the system facilitates the overall
process of collecting data during visual inspection as
well as accessing and visualizing them later on desk-
top (and other mobile) platforms.
This work results from a collaboration between re-
searchers of the Portuguese National Laboratory for
Civil Engineering (LNEC) and the NOVA Labora-
tory for Computer Science and Informatics (NOVA
LINCS).
2 CONCEPTS
Ports are infrastructures where wave tranquility is
mandatory in order to enable mooring, loading and
unloading of ships and also to ensure the safety
of people, goods and the ships themselves (Fortes,
2015). Ports were initially installed in naturally shel-
tered areas such as bays, estuaries and areas protected
by islands. However, more recent harbours have been
created in less protected regions, which led to the need
for protective structures.
Ports can be classified according to type, location,
use and size. We can highlight three types of ports:
Natural. ports are those where improvement works
are not necessary to guarantee the shelter of the
port and the access to the berths, since the natural
conditions already provide these guarantees;
Artificial. ports are those where it is necessary to
construct structures to improve the shelter and the
conditions of access of ships to the berths;
Semi-natural. ports are located in a cove or are pro-
tected by promontories on both sides, and only
necessary to ensure an artificial protection at their
entrance.
Ports are composed of:
• Protective works (breakwaters, jetties and others);
• Access and navigation channels;
• Docking structures - to moor ships, transfer pas-
sengers and move and store goods;
• Earth facilities.
In the context of the platform presented in this pa-
per, one will focus on rubble mound breakwaters. A
breakwater is an obstacle that reduces the action of
waves in the area sheltered by the structure. The ac-
tion of the waves is reduced by a combination of re-
flection and dissipation of the energy on the breakwa-
ter protective structure. In broad terms, breakwaters
can have the following goals:
• To protect port facilities;
• To enable the mooring of ships and their safe load-
ing and unloading;
• To help in the control of sedimentation, in guiding
the currents and creating areas with different rates
of agitation;
A Web Platform for the Systematic Monitoring of Coastal Structures
103
• To protect water outlets from thermoelectric
power plants and the coast line against the action
of tsunamis.
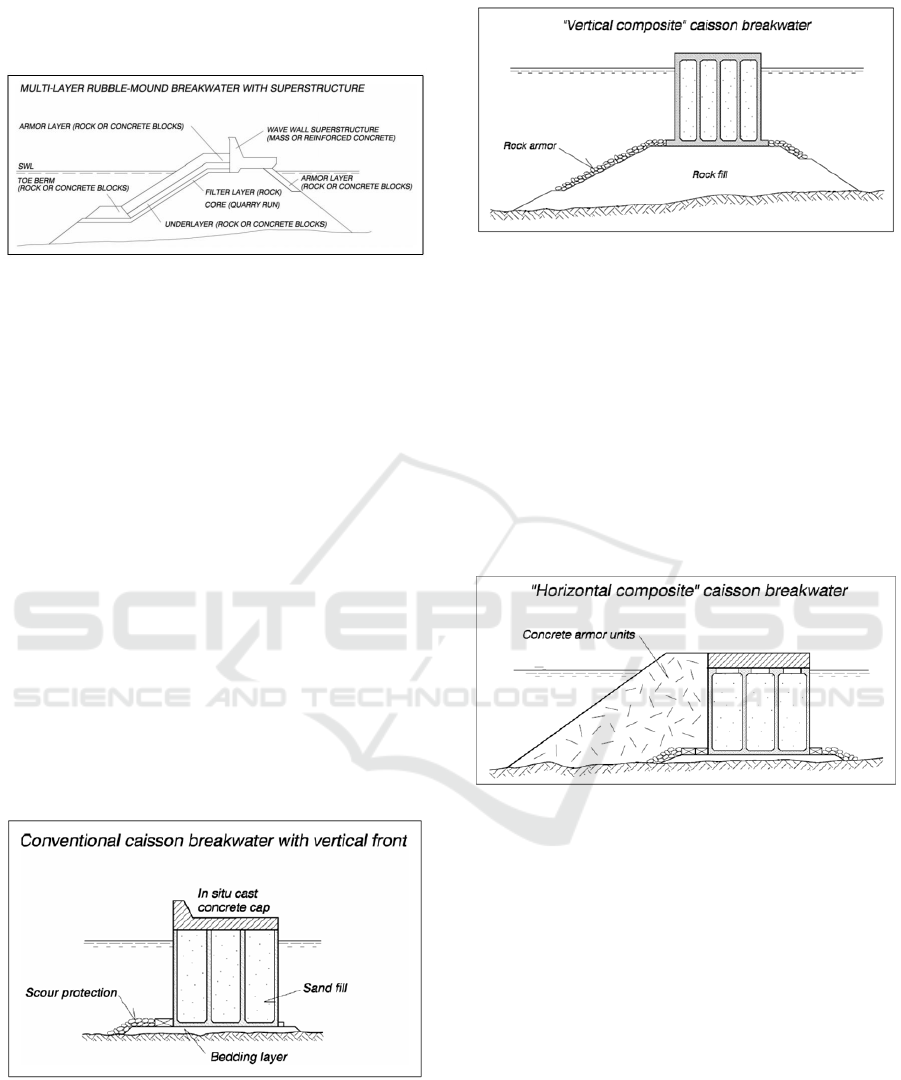
Figure 1: Rubble-mound Breakwater structure.
These structures may be divided into several
types:
Rubble-mound Breakwaters. are the most common
port protection structures that exist in Portugal
(Lemos and Santos, 2007b). A rubble-mound
breakwater has a trapezoidal shape (see Figure 1),
with a core of undifferentiated loose materials that
is protected by one or more layers of possibly dif-
ferent types of material, also loose. They are easy
to build and maintain and efficient in dissipating
wave energy;
Vertical-front Breakwaters. Vertical-front break-
waters are another major class of breakwater
structures (USACE, 2006). The basic structure
element is usually a sandfilled caisson made of
reinforced concrete, but blockwork types made
of stacked precast concrete blocks are also used.
Caisson breakwaters might be divided into the
following types:
Conventional, i.e., the caisson is placed on a rel-
atively thin stone bedding layer (Figure 2);
Figure 2: Conventional caisson breakwater with vertical
front.
Vertical Composite, i.e., the caisson is placed
on a high rubble-mound foundation (Figure 3).
This type is economical in deep waters. Con-
crete caps may be placed on shore-connected
caissons;
Figure 3: Vertical composite caisson breakwater.
Horizontal Composite , i.e., the front of the
caisson is covered by armor units or a rubble-
mound structure (multilayer or homogeneous)
(Figure 4). This type of breakwater is typ-
ically used in shallow water; however, there
have been applications in deeper water where
impulsive wave pressures are likely to occur.
The effects of the mound are reduction of wave
reflection, wave impact, and wave overtopping.
Depending on bottom conditions, a filter layer
may be needed beneath the rubble-mound por-
tion;
Figure 4: Horizontal composite caisson breakwater.
Coastal structures, particularly breakwaters, are
structures to which a great risk is assumed at the de-
sign stage, due to the degree of uncertainty associated
with the demands themselves and the characteristics
of the materials used in their construction (Oliveira et
al., 2005). Although this risk is assumed, since a pos-
sible collapse is not generally associated with the loss
of human life, economic cost is, as a rule, very high.
It is known, therefore, that during the lifetime of
the structure, repair works will be necessary as well
as maintenance, due the fatigue of the parts and of
the materials involved in the construction. However,
in order for these interventions to be effectively car-
ried out in time and at the lowest possible cost, the
systematic inspection of the structures is highly rec-
ommended.
This is the main reason for the implementation of
the software platform presented in this paper.
GISTAM 2017 - 3rd International Conference on Geographical Information Systems Theory, Applications and Management
104
3 RELATED WORK
One of the goals of the work presented in this paper
was to develop a WebGIS application to facilitate the
task of collecting information during a visual inspec-
tion of the monitored structure. Moreover, the system
should allow access to the stored information on the
evolution of the condition of the structures over the
years, enabling the comparison of the Present Condi-
tion of one structure with its stored condition, deter-
mined at an earlier relevant date (5 years before or at
an earlier date, if repairing works took place). Pre-
vious related work has been accomplished with the
aim of collecting and storing, in database format (in
Microsoft Access), the data collected in previous in-
spections. This database was called ANOSOM and
has been in use, these last years, by the researchers of
LNEC.
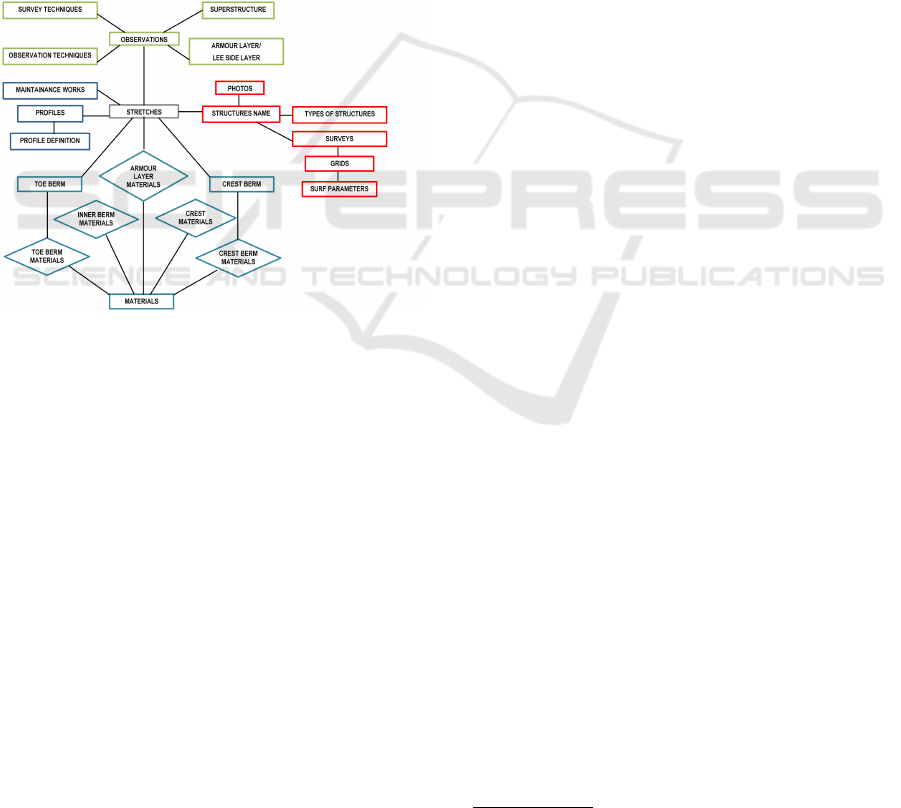
Figure 5: ANOSOM database tables’ relationships.
The first version of the ANOSOM (Reis and Silva,
1995) database was developed in 1995, with the dou-
ble goal of storing all the information gathered in vi-
sual inspection campaigns on coastal structures car-
ried out by LNEC and facilitating the diagnosis of
the problems presented by each inspected structure,
in order to identify potential needs for maintenance
or repair work. The collection of qualitative infor-
mation related to the deterioration of the breakwa-
ter materials in profile elements, which can only be
obtained through visual inspection, is of major im-
portance in the evaluation of the condition of these
structures. It was thus decided that the ANOSOM
database should contain information collected in the
visual inspection campaigns, in addition to the gen-
eral information about the characteristics of the struc-
ture (Lemos et al., 2002; Lemos and Santos, 2007a).
Thus, the basic functionality of the 2007 version of
ANOSOM application included:
1. Inserting, correcting, and deleting data;
2. Processing the inserted data in order to diagnose
the problems of the structure.
Three main categories of data were identified:
1. Structure data, which includes the data relating to
the conceptual division of the structure into sec-
tions, the characterization of the profile envelope
elements of each of these sections and the dates of
repair/maintenance work performed on those sec-
tions;
2. Visual inspection campaign data, including the
content filled in inspection forms and the pho-
tographs taken during those campaigns;
3. Structure survey data, containing the coordinates
of the surveyed points and the envelope surface
defined in a regular mesh.
Nevertheless, it did not contemplate functionality
to handle multimedia data. In fact, the photos taken
during inspections were not added to the database,
rather they were gathered in folders and the GeoSetter
application
1
was used to access the photos metadata,
such as position (latitude and longitude) and orienta-
tion of photo captures.
The platform presented in this paper reveals some
similarities with the work described by (Pires et al.,
2009). This work provides a spatial representa-
tion of breakwaters and sea walls of the Espinho
shoreline, in Portugal, and enables the evaluation of
the current condition of coastal protection structures
through photos and additional alphanumeric informa-
tion. However, the system’s user interface does not
adapt when using a mobile device and the information
presented to the user does not consider his location.
Another related project is the one presented by
(Marujo et al., 2013), which contemplates a database
with information on coastal structures and a GIS in-
terface which supports the georeferencing of coastal
protection works. Moreover, it enables the genera-
tion of inspection forms in printed and digital format.
However, this system requires an Android mobile de-
vice 4.x version smartphone or tablet. The platform
presented below is not restricted to one specific oper-
ating system.
(Marujo, 2016) lists a comprehensive number of
similar systems, both national and international, by
looking at their particular implementation details and
by describing their advantages and disadvantages.
There is also a related work consisting on a
database prepared by HR Wallingford and TU Delft
(Allsop et al., 2009) with the assistance of the in-
ternational breakwater community, made freely avail-
able for the benefit of breakwater designers, contrac-
tors owners and developers worldwide. Although this
1
http://www.geosetter.de/en/
A Web Platform for the Systematic Monitoring of Coastal Structures
105
database provides some technical information, like
some geometrical characteristics and design criteria,
as well as the owner, contractor and consultant names,
its aim is not the monitoring and diagnosis of the
structures.
4 IMPLEMENTATION
The developed system follows an architectural struc-
ture used in the development of WebGIS systems. It
is described in the next subsection.
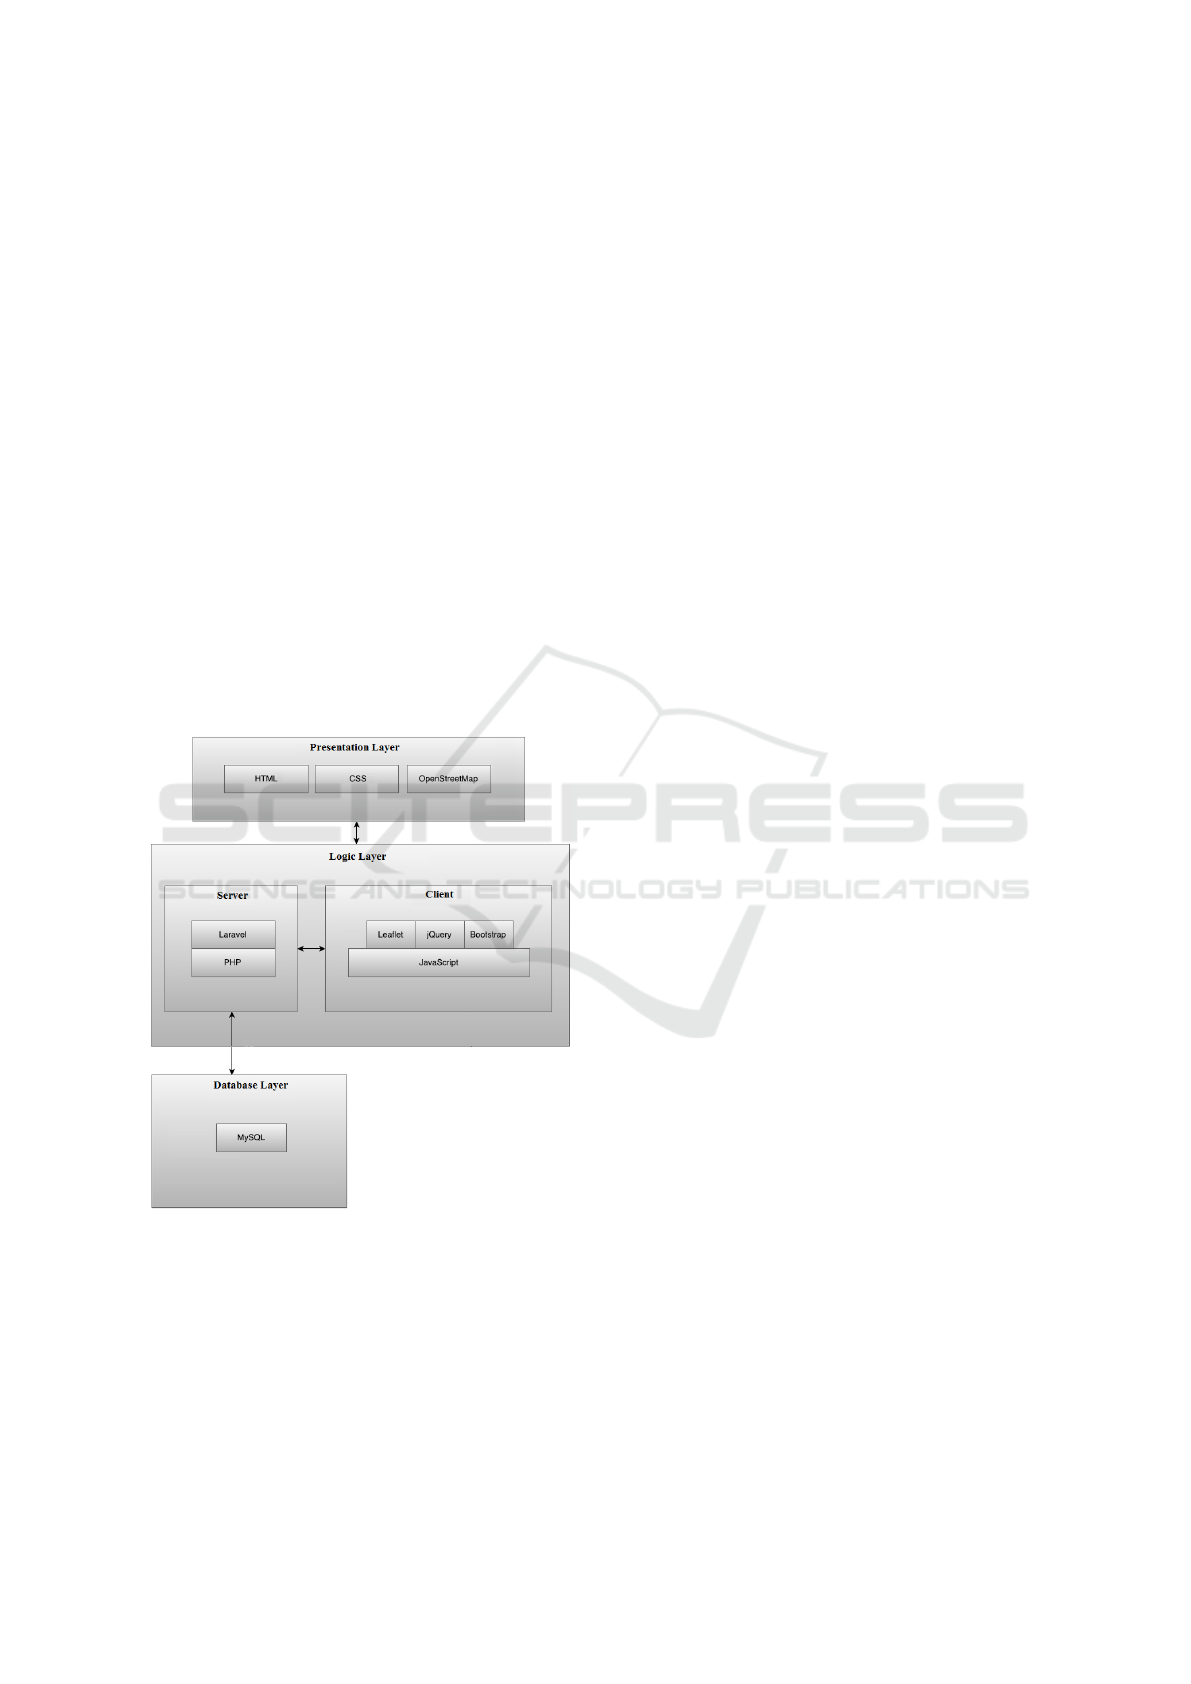
4.1 Architecture
The general architecture of the developed application
is represented in Figure 6. It is divided into three lay-
ers: the presentation layer, the logic layer and the
database layer. This type of architecture enables a
separation of functionality that supports its evolution
and maintenance. The tools used for the development
of each layer are also described.
Figure 6: System architecture.
The presentation layer is the layer that enables the
user to interact with the system and is developed in
HTML, CSS and the base map was OpenStreetMap.
HTML is responsible for displaying the elements that
are present in the interface, while CSS is used to pro-
vide the style of those elements. The maps that are
shown in the application, both on the home page and
on the page corresponding to the photos of a section,
are provided by OpenStreetMap. This is the layer
through which the user interacts with the system and
it is responsible for sending the input produced by the
user to the logic layer, and consequently for display-
ing the data from the logic layer back to the user for
feedback.
The logic layer is divided into two main compo-
nents, the client side and the server side. The client
side was developed with Leaflet, jQuery and Boot-
strap, which rely on JavaScript. Leaflet allows the in-
teraction with the OpenStreetMap map. Bootstrap is
used to create a responsive interface in order to adapt
to the user’s device. Finally, jQuery supports the ma-
nipulation of interface elements.
The database layer is made available through the
MySQL database management system, which stores
all the information regarding the sections of the
coastal structures, such as their characteristics, the
data of the visual inspections and the various points of
each section and their photographs/videos. The con-
nection to the database is established through PHP.
4.2 Functionalities
Due to privacy concerns regarding the information
handled by the system, only LNEC researchers can
access it. Thus, some security measures were imple-
mented, including password protection. After the lo-
gin, the user is redirected to a page where he can now
access the world map provided by OpenStreetMap.
Once he accesses the map, the shapefile features, in-
cluding all the breakwaters in the database, are loaded
into the map. The geographic features are displayed
in blue and each structure is divided into several sec-
tions. Each of these sections has a unique code that
is stored in the .dbf part of the shapefile. This infor-
mation allows the connection between the geographic
representation of the sections of each structure, on the
map interface, with their respective information on
the MySQL database, enabling the contextual view-
ing of a breakwater section’s general (as well as in-
spection) data.
4.3 Breakwater and User Location
One of the most important aspects regarding the vi-
sual inspections is the user’s current location. Data
capture is location-based, so the system must be able
to associate the captured information with the correct
breakwater section. To do this, the user must turn on
the location identification of the device that she is us-
ing, and the system captures the user’s current posi-
tion, placing a red marker on the map interface. The
system then tries to associate the user’s current po-
GISTAM 2017 - 3rd International Conference on Geographical Information Systems Theory, Applications and Management
106

Figure 7: Photos from a section of a structure.
sition to a particular section of a structure (the one
that is nearest) to be inspected. To speed up detec-
tion, only the structures that are visible on the map
window, at the moment of detection, are considered
for inspection. The time taken to detect the section
chosen for inspection is important, as the number of
structures to be added to the system is large and the
search will be executed on a mobile device. The al-
gorithm used for section selection is an adaptation of
the Point In Polygon algorithm (Franklin, 2006) by
W. Randolph Franklin.
Thus, once the user’s location has been detected,
as the user walks on a structure, the system will asso-
ciate the data he collects with one of its sections. In
this context, the user can either add observations on
that section or define new points of observation.
4.4 Photos and Videos
Media data collection has been contemplated in the
platform and, particularly for jpeg photos, it is possi-
ble to gather exif metadata from the file and directly
add it to the system. Thus, when a jpeg photo is taken
near a specific point of observation, the system cap-
tures latitude, longitude, altitude and orientation of
the photo from the file’s metadata and directly cre-
ates an association of the photo with the point. Af-
terwards, a request to view the photos gathered at
this point of observation will include the correspond-
ing photo. In fact, all the photos taken and collected
on that point are presented to the user for viewing.
Moreover, when viewing the photos, the user has the
chance to check the photos’ metadata, with the help
of a map where the orientation of capture is displayed
(see Figure 7). This feature enables the offline upload
of photos into the platform, for example, when photos
are taken using a particular camera and not using the
mobile device.
The user can also capture and associate a video to
a point of observation. However, in this case, only the
date of upload is stored in the system, no metadata is
loaded. The method for uploading videos is similar to
the one used for photos. The user clicks on a point of
observation, shown on the map, which causes the up-
load pop-up window to open, then presses the camera
button icon (when using a mobile device), takes the
photo/video (or chooses a photo/video that has been
previously captured) and the file upload starts auto-
matically. After a few moments, the photo/video is
stored in a folder on the server, becoming associated
with the chosen point of observation. Consequently,
the file also becomes part of the observation informa-
tion associated with the section of the breakwater that
owns the observation point.
4.5 Information about a Rubble-mound
Breakwater
Each section in a structure has very specific charac-
teristics, as shown in Figure 8, such as its size in
length and width, information about the superstruc-
ture/crown, the armour layer, the outer crest berm, the
inner crest berm and so on. This information has to do
essentially with the slope of the outer armour layer,
the width, the values of the maximum and minimum
dimensions and their materials (the type of blocks,
the weight, the layout, etc). To facilitate information
viewing and analysis, the section interface page in-
cludes an interactive drawing of a breakwater making
it possible to view a particular part of the information
by clicking on the structure’s relevant part. The in-
terface has also been structured with several tabs and
a navigation bar (at the top of the page) allowing the
user to navigate to other pages to see the photos and
A Web Platform for the Systematic Monitoring of Coastal Structures
107
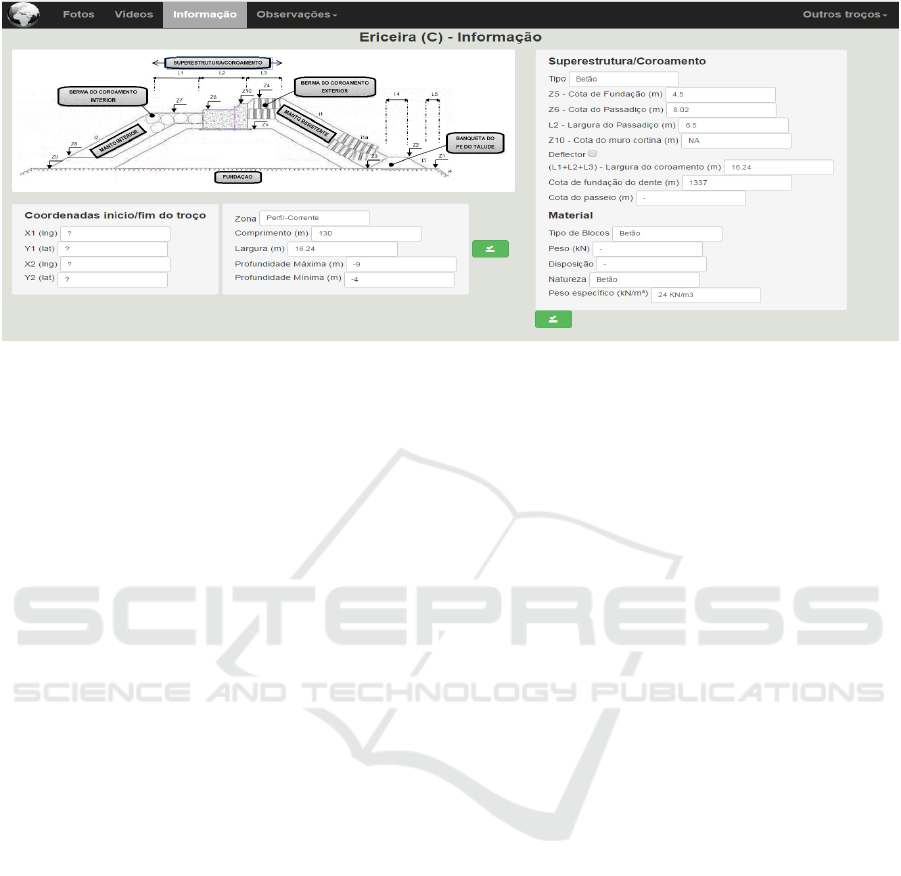
Figure 8: Information about a Rubble-mound Breakwater.
videos of the section, to access section observations
(according to the selected date) and to analyse the
characteristics of other sections belonging to the same
structure.
4.6 Visual Inspections
Periodically, the structures are subjected to visual in-
spection, performed by LNEC researchers. In gen-
eral, the structure is inspected yearly but additional
inspections may be performed, specially after strong
storms.The data collected refer to the current condi-
tion of the armour layer, the superstructure and the in-
ner filters. To facilitate data gathering, most of these
data are entered into the inspection forms via radio
buttons. Predefined, qualitative, values scales have
been defined as, for example, in the case of the num-
ber of unit displacements, which may have occurred,
where values can be 0 (None), 1 (Few), 2 (Some) or
3 (Many). These and other values contribute to cal-
culate the Present Condition of that part of the sec-
tion of the structure, and these range between 0 and
5. LNEC researchers have developed a methodology
that enables the evaluation of the Present Condition of
the structure and its evolution (Santos, 2000; Santos
et al., 2003). If at least two visual inspections have
been performed, it is possible to calculate the Evolu-
tion Condition. The Risk Condition associated with
the structure can be calculated from existing informa-
tion on the Present Condition and the Evolution Con-
dition.
5 EVALUATION OF THE SYSTEM
The aim of the evaluation process was to assess the
usability of the developed platform as well as its use-
fulness for National Laboratory for Civil Engineering
researchers in the data collection and structure eval-
uation activities. The methodology for the evalua-
tion was designed with the goal of collecting as much
qualitative feedback as possible, in order to obtain
material for future improvements, as well as to evalu-
ate the result of the developed application, in the final
evaluation phase.
During the evaluation process, users were asked to
perform various tasks in the developed system. Some
tasks were to be performed on a desktop platform,
while others were intended to be performed on a mo-
bile device, as in a situation of a field campaign. After
each task was completed, each user was asked to com-
plete a questionnaire. The questionnaire was divided
into two parts.
The first part consisted of the System Usability
Scale (SUS). The second part was composed by spe-
cific questions related to specific functionalities of the
application. The platform was evaluated by 14 non-
expert users and by 4 LNEC researchers, which are
the end users of the platform. The questionnaire was
improved for the latter testers (there were some ad-
ditional questions and some existing questions were
made more specific), given the knowledge they have
on the scope of the developed application.
The SUS (Brooke, 1996, 2013) was used because,
as described by the authors, it provides a robust, reli-
able and cost-effective method for evaluating the us-
ability of a computational tool. Because it has been
widely used, it has become one of the top tools to
support this type of evaluation, enabling effective dif-
ferentiation between usable and unusable systems.
Another advantage of using SUS is that it is a
small questionnaire, which leads to greater receptivity
on the part of testers to answer its questions. SUS is
composed of the following 10 sentences, each evalu-
GISTAM 2017 - 3rd International Conference on Geographical Information Systems Theory, Applications and Management
108
ated using a five-point scale, ranging from Strongly
disagree (the lowest value) to Strongly agree (the
highest value):
1. I think that I would like to use this system fre-
quently;
2. I found the system unnecessarily complex;
3. I thought the system was easy to use;
4. I think that I would need the support of a technical
person to be able to use this system;
5. I found the various functions in this system were
well integrated;
6. I thought there was too much inconsistency in this
system;
7. I would imagine that most people would learn to
use this system very quickly;
8. I found the system very cumbersome to use;
9. I felt very confident using the system;
10. I needed to learn a lot of things before I could get
going with this system.
Although SUS was only designed to measure us-
ability, (Lewis and Sauro, 2009) suggest that two
components can be derived from SUS - usability as
well as learnability. Therefore, both components were
considered to complete the overall value of the SUS,
in order to provide a better perception of the total us-
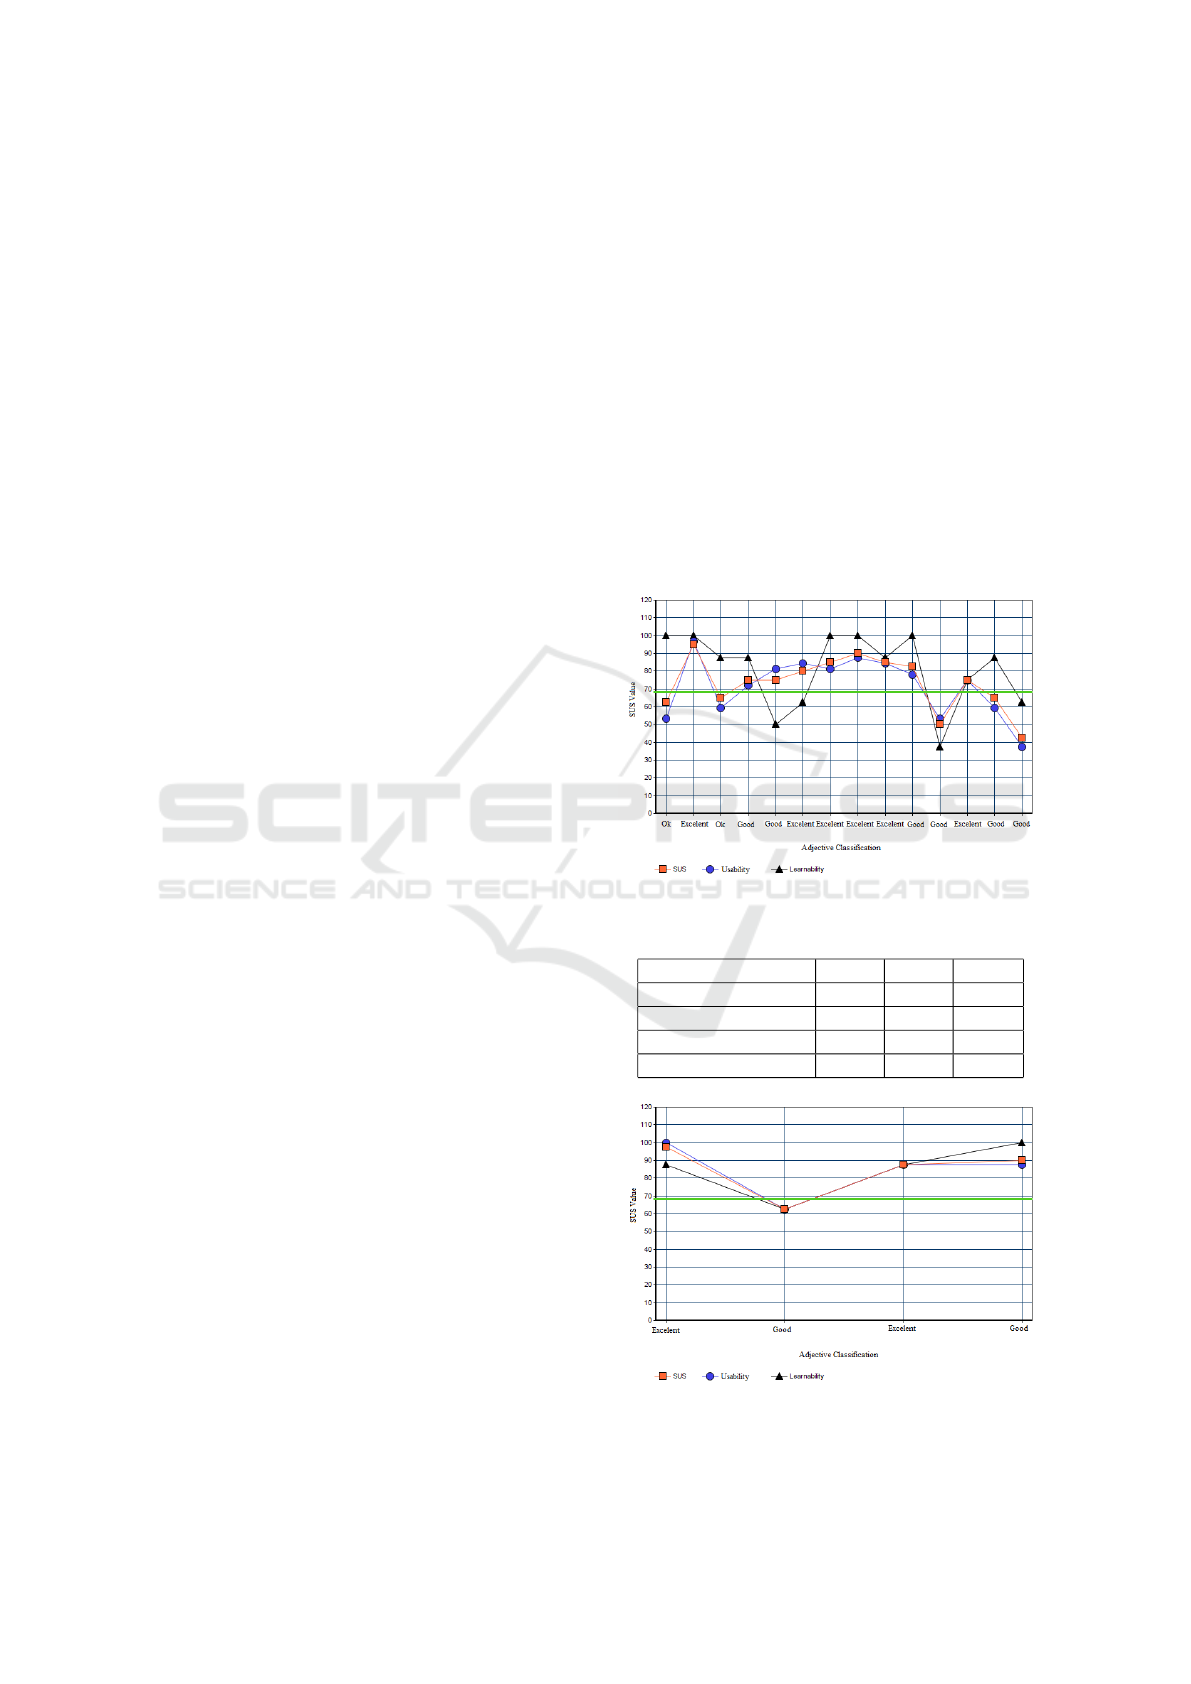
ability of the developed application. Figures 9 and
10 show the results of the SUS questionnaire for reg-
ular users and for LNEC researchers. Each vertical
line represents a user and in each of those lines there
are 3 values calculated based on the user’s answers,
the value for the overall SUS score, the value for the
Usability and the value for the Learnability. Below
those lines, one can see the adjective that the user
chose for the user friendliness of the platform. It is
a seven-point adjective-anchored Likert scale rang-
ing from Worst Possible to Best Possible. There is
a green line placed at value 68 and it represents the
mean value for web interfaces according to (Sauro,
2011). A value above that line is thus considered, by
the authors, above the average, while a value under
that line is below average. From these graphics, the
average, maximum, minimum and the standard devi-
ation for each of the three components evaluated were
calculated, with the resulting values shown in table 1
and table 2.
Both evaluation results put the platform above the
68 value, the average of the SUS questionnaire be-
ing 73.39 for regular users and 84.38 for LNEC re-
searchers. The learnability average for regular users
value is quite high (higher than the usability), which
leads us to conclude that the platform learning curve
is a reduced one, an interesting results for the pur-
poses of the work, as the use of the platform in the
field may often be performed by non-expert users.
However, some evaluation results were not as good
as the rest, which led to an analysis of the requests
and suggestions provided by the testers. All the sug-
gestions of the testers were analysed and added to the
platform. Those suggestions were related with the
usability of the platform. Warning and confirmation
messages before deleting data were added. The User
Interface also suffered some adjustments in order to
become more user friendly. Geocoding was added,
enabling a user to type the name of a place or city and
the map becomes centered on that place. The pos-
sibility to upload videos was also only implemented
after the tests. All of these improvements led to a suc-
cessful improvement of the system.
Figure 9: SUS results from regular users.
Table 1: SUS results from regular users.
SUS Usab Learn
Medium 73.39 71.65 81.25
Maximum 95 96.88 100
Minimum 42.5 37.5 37.5
Standard Deviation 14.41 16.65 20.66
Figure 10: SUS results from National Laboratory for Civil
Engineering researchers.
A Web Platform for the Systematic Monitoring of Coastal Structures
109

Table 2: SUS results from National Laboratory for Civil
Engineering researchers.
SUS Usab Learn
Medium 84.38 84.38 84.38
Maximum 97.5 100 100
Minimum 62.5 62.5 62.5
Standard Deviation 15.19 15.73 15.73
6 CONCLUSIONS
This paper presents the development of an online re-
sponsive platform, implemented to facilitate the vi-
sual inspections of coastal structures, carried out pe-
riodically by LNEC. The system, a WebGIS, enables
the geographic visualization of coastal structures on
mobile devices and lets the user collect a new obser-
vation, when located near a structure. Some of the
inserted values are filled in by the user, like the type
of unit displacement, the state of the armour slope,
the degradation of the materials, etc. All these values
are used to compute the Present Condition of a part
of the section of the structure. A new point of ob-
servation of the structure can also be added, allowing
the user to then associate photos or videos to it. As
the photographic and video recordings are very im-
portant, this feature is crucial to the system. Also, the
photos can be captured using a particular camera with
no geotagging capabilities, and the association of ge-
ographic details to a point of observation can be per-
formed offline. The system reads the metadata of jpg
files, which includes latitude and longitude, and thus
associates the photo to the retrieved location. The ori-
entation and altitude are also read from the jpg file
and stored in the database. To summarize, the func-
tionalities present on the system can be divided into:
Georeferencing. Structures and their sections are
displayed on a map. Points of observation of the
structure are also present on the map with a yellow
marker;
User Current Location. The system can geographi-
cally locate the user, using a red marker. Every 10
seconds the user location is updated and the red
marker is moved, if the user has moved;
Photos and Videos The user can capture a photo or
record a video, associate it to a point of observa-
tion and, consequently, to a section of the struc-
ture.
Information from a Section. Each structure is di-
vided into several sections and each of those sec-
tions has several parts. The platform includes a
visual (geographic) representation of the structure
and associates structural database data with this
representation.
Visual Inspections. Periodically, it is necessary to
inspect the structures. The analysis may also be
performed in place. Unit displacements which
have occurred, fractures and degradations of ma-
terials must be considered. All these data are
stored on the database and geographically associ-
ated with the corresponding location on the struc-
ture. The collected information is used to calcu-
late the Present Condition of that part of the struc-
ture’s section.
The platform was evaluated by expert and non-expert
users with good results and all the suggestions and
requests were added to the platform. Currently, the
system is being installed at LNEC for production use.
6.1 Future Work
As coastal structures largely differ, the authors would
like to update the platform to enable administrative
configuration of the information viewed on the inter-
face, so that the researchers could, by themselves,
change and evolve the structure of the database.
Moreover, an offline version, which would not need
an Internet connection on location, would be most
welcomed by the researchers and should be consid-
ered.
ACKNOWLEDGEMENTS
This work is partially supported by project NOVA
LINCS Ref. UID/CEC/04516/2013.
REFERENCES
Allsop, N., Cork, R., and Verhagen, H. (2009). A database
of major breakwaters around the world. Coasts, Ma-
rine Structures and Breakwaters 2009 Conference,
EICC, Scotland, 16-18 September 2009.
Brooke, J. (1996). SUS - A quick and dirty usability scale.
Usability evaluation in industry. CRC Press, Reading,
United Kingdom. ISBN: 9780748404605.
Brooke, J. (2013). SUS: A Retrospective. J. Usability Stud-
ies, 8(2):29–40.
Fortes, C. J. E. M. (2015). Infraestruturas portu
´
arias de
protec¸
˜
ao. M
´
odulo do Curso ”Gest
˜
ao Integrada das
Zonas Costeiras”, Polytecnique institute of Leiria (in
Portuguese).
Franklin, W. R. (2006). Pnpoly-point inclusion in polygon
test. Web site: https:// www.ecse. rpi.edu/ wrf/ Re-
search/ Short Notes/ pnpoly.html. 2016-11-07.
GISTAM 2017 - 3rd International Conference on Geographical Information Systems Theory, Applications and Management
110

Lemos, R., Reis, M., and Silva, L. (2002). Observac¸
˜
ao Sis-
tem
´
atica de Obras Mar
´
ıtimas. ANOSOM: Base de Da-
dos de Comportamento de Estruturas. Manual do Uti-
lizador. Relat
´
orio 318/02 - npp, novembro de 2002.
Lemos, R. and Santos, J. A. (2007a). An
´
alise de Observac¸
˜
ao
Sistem
´
atica de Obras Mar
´
ıtimas - ANOSOM. Base
de dados de Inspecc¸
˜
oes de Quebra-mares de Taludes.
Lisboa, Report 301/07 NPE, LNEC.
Lemos, R. and Santos, J. A. (2007b). ANOSOM - An
´
alise
de Observac¸
˜
ao Sistem
´
atica de Obras Mar
´
ıtimas. 5as
Jornadas de Engenharia Costeira e Portu
´
aria, Lisboa,
Portugal.
Lewis, J. R. and Sauro, J. (2009). The factor structure of the
system usability scale. In Proceedings of the 1st In-
ternational Conference on Human Centered Design:
Held As Part of HCI International 2009, HCD 09,
pages 94–103, Berlin, Heidelberg. Springer-Verlag.
Marujo, N. (2016). Development of a system for life-cycle
management of maritime works –SIMOM. The case
of rubble-mound breakwaters. PhD thesis in Civil En-
gineering. Instituto Superior Tcnico, Universidade de
Lisboa, december, 2016.
Marujo, N., Valle, A., Caldeira, J., Teixeira, A., and Arajo,
M. (2013). Gest
˜
ao, monitorizac¸
˜
ao e inspec¸
˜
ao de obras
mar
´
ıtimas. 8as Jornadas Portuguesas de Engenharia
Costeira e Portu
´
aria, LNEC, Lisboa, Portugal.
Oliveira, N., Lemos, R., Sim
˜
oes, J. P., and Silva, L. G.
(2005). Benef
´
ıcios associados
`
a observac¸
˜
ao sis-
tem
´
atica de obras mar
´
ıtimas em Portugal continental.
4as Jornadas Portuguesas de Engenharia Costeira e
Portu
´
aria, LNEC, Lisboa, Portugal.
Pires, A., Gomes, A., and Chamin, H. (2009). Dynamics of
Coastal Systems Using GIS Analysis and Geomateri-
als Evaluation for Groins. In Environmental & Engi-
neering Geoscience, volume 15 N4, pages 245–260.
Reis, M. and Silva, L. (1995). Observac¸
˜
ao Sistem
´
atica de
Obras Mar
´
ıtimas. Base de Dados ANOSOM: Manual
de Utilizac¸
˜
ao. LNEC, Lisboa, dezembro de 1995.
Sabino, A., Rodrigues, A., Poseiro, P., Reis, M. T., Fortes,
C. J. E. M., and Reis, R. (2015). Coastal risk fore-
cast system. In Grueau, C. and Rocha, J. G., editors,
First International Conference on Geographical In-
formation Systems Theory, Applications and Manage-
ment, pages 201–209, Barcelona, Spain. INSTICC,
SciTePress - Science and Technology Publications.
Santos, J. A. (2000). Monitoring of the coastal structures of
macao international airport. basic notions of maritime
hydraulics. Report 114/00-NPP. LNEC.
Santos, J. A., Neves, M. G., and Silva, L. (2003). Rubble-
mound breakwater inspection in portugal. In MELBY,
J. F., editor, Proceedings of Coastal Structures ’03,
pages 249–261, Portland. ASCE.
Sauro, J. (2011). Measuring Usability with the System
Usability Scale (SUS). http://www.measuringu.com/
sus.php.
United States. Army. Corps of Engineers (2006). CEM:
Coastal Engineering Manual. U.S. Army Corps of
Engineers.
A Web Platform for the Systematic Monitoring of Coastal Structures
111
