
An Accurate Tax Fraud Classifier with Feature Selection based on
Complex Network Node Centrality Measure
Tales Matos, Jos
´
e Antonio F. de Macedo, Jos
´
e Maria Monteiro and Francesco Lettich
Federal University of Cear
´
a, Campus do Pici, Fortaleza, Brazil
Keywords:
Fraud Detection, Data Mining, Tax Evasion, Feature Selection.
Abstract:
Fiscal evasion represents a very serious issue in many developing countries. In this context, tax fraud detection
constitutes a challenging problem, since fraudsters change frequently their behaviors to circumvent existing
laws and devise new kinds of frauds. Detecting such changes proves to be challenging, since traditional
classifiers fail to select features that exhibit frequent variations. In this paper we provide two contributions
that try to tackle effectively the tax fraud detection problem: first, we introduce a novel feature selection
algorithm, based on complex network techniques, that is able to capture key fraud indicators – over time, this
kind of indicators turn out to be more stable than new fraud indicators. Secondly, we propose a classifier
that leverages the aforementioned algorithm to accurately detect tax frauds. In order to prove the validity of
our contributions we provide an experimental evaluation, where we use real-world datasets, obtained from the
State Treasury Office of Cear
´
a (SEFAZ-CE), Brazil, to show how our method is able to outperform, in terms
of F
1
scores achieved, the state-of-the-art available in the literature.
1 INTRODUCTION
Fiscal evasion represents a very serious issue for the
economy of developing countries. Although institu-
tions often undertake initiatives to collect meaning-
ful taxpayer information, thus trying to reduce fiscal
evasion, the level of tax frauds remains high – for in-
stance, the level of tax evasion in Brazil is of about
US$ 143 billions (Sonegometro, 2016). On the posi-
tive side, the continuous collection of more and more
taxpayer data opens up to new kinds of opportunities,
since it allows the creation of increasingly effective
approaches that are able to mitigate tax evasion.
In this work, we consider a real-world scenario in-
volving the State Treasury Office of Cear
´
a (SEFAZ-
CE, Brazil), the agency in charge of supervising over
200,000 active contributors in the state of Cear
´
a,
Brazil. Although SEFAZ-CE maintains a large
dataset containing a plethora of information, its en-
forcement team struggles to perform thorough inspec-
tions on taxpayers accounts. Indeed, the inspection
process involves countless fraud indicators, thus re-
quiring burdensome amounts of time and being po-
tentially subject to human errors. In this paper, we
aim to ease this kind of tasks by introducing novel
algorithmic tools.
We start by posing ourselves four key questions:
what are the behavioral patterns behind fraud indi-
cators? Are there some kind of correlations among
fraud indicators? Which are the most relevant fraud
indicators? How can we assess the risk that some tax-
payer commits a fraud?
In this paper we try to answer these questions by
introducing a new method for predicting potential tax
frauds. The method is structured in four phases, and
relies on data mining, statistical analysis, and dimen-
sionality reduction techniques. During the first phase,
our approach analyzes the frequency of individual
attributes, as well as the frequency associated with
combinations of attributes, trying also to understand
whether attributes exhibit some kind of statistical dis-
tribution over time. By virtue of these information,
in the second phase our method infers the dimensions
that are the most relevant for taxpayer classification.
Subsequently, in the third phase our approach vali-
dates the hypothesis of using the centrality measure
to select key indicators, while in the final phase it out-
puts a list that reports the fraud risk associated with
each taxpayer. Overall, our proposal significantly im-
proves the approach presented in (Matos et al., 2015),
in that it uses complex network techniques to pick
up key indicators that can help to accurately identify
frauds.
In the experimental evaluation we show how our
Matos, T., Macedo, J., Monteiro, J. and Lettich, F.
An Accurate Tax Fraud Classifier with Feature Selection based on Complex Network Node Centrality Measure.
DOI: 10.5220/0006335501450151
In Proceedings of the 19th International Conference on Enterprise Information Systems (ICEIS 2017) - Volume 1, pages 145-151
ISBN: 978-989-758-247-9
Copyright © 2017 by SCITEPRESS – Science and Technology Publications, Lda. All rights reserved
145

algorithm is able to achieve equivalent, or better,
F
1
scores with respect to the algorithm proposed in
(Matos et al., 2015) – the improvement is equal to
about 54% when considering the dataset introduced
in this work, while comparable F
1
scores are achieved
when considering the dataset introduced in (Matos
et al., 2015). In the same evaluation we also show
how our method is able to achieve better F
1
scores –
the improvement is up to 47% when considering the
dataset introduced in this work – with respect to an
SVM
1
-based approach (Shavers et al., 2006).
The paper is structured as follows: Section 2
presents the related work. Section 3 presents the case
study that we consider in this work. Section 4 presents
our proposal. Section 5 presents the experimental set-
ting, while Section 6 presents the experimental evalu-
ation. Finally, Section 7 draws the final conclusions.
2 RELATED WORK
(Glancy and Yadav, 2011) proposes a quantitative
model to detect fraudulent financial reports. The goal
of the model is to detect attempts to conceal informa-
tion, or report incorrect information, in annual filings
presented to the US Securities and Exchange Com-
mission (SEC). In order to achieve this, the authors
analyze all the information contained within a textual
document by means of techniques based on the Sin-
gular Value Decomposition (SVD).
(Ngai et al., 2011) presents a review of the litera-
ture – along with a classification scheme – concerning
the application of data mining techniques to detect fi-
nancial frauds. The findings clearly show that data
mining techniques have been applied extensively to
detect insurance frauds, although corporate and credit
card frauds have also attracted a great deal of attention
in recent years. In general, the review shows that the
main data mining techniques used in the literature are
based on logistic models, neural networks, Bayesian
belief networks, and decision trees.
(Bhattacharyya et al., 2011) evaluates two ap-
proaches, both relying on the usage of support vector
machines, random forests techniques and logistic re-
gression, as part of an attempt to better detect credit
card frauds. In this study, the authors consider real-
world data concerning international credit card trans-
actions.
(Ravisankar et al., 2011) considers data mining
techniques, such as Multilayer Feed Forward Neural
Network (MLFF), Support Vector Machines (SVM),
Genetic Programming (GP), Group Method of Data
1
The acronym stands for support vector machine.
Handling (GMDH), Logistic Regression (LR), and
Probabilistic Neural Network (PNN), to identify com-
panies that commit financial statement frauds. Cou-
pled with these techniques, the authors consider also
the usage of feature selection techniques. The exper-
imental evaluation, which considers a dataset involv-
ing 202 Chinese companies, shows how PNN is the
clear winner when feature selection is not used, while
GP and PNN emerge as winners in the opposite case.
(Kirkos et al., 2007) explores the effectiveness of
data mining classification techniques to detect compa-
nies that issue fraudulent financial statements (FFS),
and deals with the identification of factors associated
with FFSs. More precisely, the study investigates
the usefulness of decision trees, neural networks and
Bayesian belief networks; in the end, the authors re-
port that Bayesian Belief Networks emerge as win-
ners.
(S
´
anchez et al., 2009) proposes the use of associ-
ation rules to extract behavior patterns from unlaw-
ful transactions observed in transactional credit card
databases. In turn, this knowledge is exploited to de-
tect and prevent frauds.
(Li et al., 2012) employs Bayesian classification
and association rules to identify signs of fraudulent
accounts and patterns of fraudulent transactions; de-
tection rules are created according to identified signs,
and used to devise a system able to detect fraudulent
accounts. By means of an empirical verification, the
authors show their solution can successfully identify
fraudulent accounts in early stages, as well as provide
useful information to financial institutions.
(Phua et al., 2010) presents a survey that catego-
rizes, compares, and summarizes the literature related
to automated fraud detection. More precisely, the sur-
vey covers a set of works published between 2000 and
2010, and discusses the main methods and techniques
used to detect frauds automatically, along with their
shortcomings.
(Fanning and Cogger, 1998) uses a Neural Net-
work to devise a fraud detection model. The input
vector consists of financial ratios and qualitative vari-
ables. In the experimental evaluation, the authors
compare the performance of their model with stan-
dard statistical methods, such as linear and quadratic
discriminant analysis, and logistic regression. Over-
all, the authors claim that their model is more effec-
tive at detecting frauds than its competitors.
(Abbott et al., 2000) uses statistical regression
analysis to examine if the use of independent audit
committees (such as independent managers that meet
at least twice per year) within companies can miti-
gate the likelihood of frauds. Indeed, the paper con-
cludes that when this happens, firms are less likely to
ICEIS 2017 - 19th International Conference on Enterprise Information Systems
146
be sanctioned for fraudulent or misleading reporting.
3 CASE STUDY
In this section we present a case study that concerns
the data collected by the Treasury State of Cear
´
a
(SEFAZ-CE), Brazil, which is responsible for collect-
ing taxes within the state of Cear
´
a. This case study
will serve us as a basis to represent the problem we
want to tackle, thanks to the volume and nature of the
data provided by the agency.
One of the goals of this study is to analyze tax-
payer fraud indicators to identify relevant key indi-
cators (main features) that may characterize potential
tax frauds. Indeed, the data to be analyzed may be
possibly huge, and may contain many different kinds
of information – just to name a few examples, ac-
counting data, goods inventory, sales data, legal data,
etc. A proper interpretation of fraud indicators is of
paramount importance to guide tax auditors during
the process of identifying irregular behaviors. In-
deed, without the aid of algorithmic tools, auditors
must usually resort to thorough and complex analyses
which, in turn, make the task of detecting frauds time
consuming and error prone.
3.1 Tax Fraud Indicator Dataset
Data provided by SEFAZ-CE were extracted from 8
applications, summing up to 72 million of records.
We selected taxpayers data collected during a period
ranging from 2009 to 2011, which corresponds to the
current audit period. We used fourteen fraud indica-
tors, all identified by expert tax auditors. From a fi-
nancial point of view, these indicators are of key im-
portance, since they correspond to the largest amount
of money that can be recovered from fraudulent trans-
actions. Each fraud indicator is determined by a tax
auditor after analyzing information issued by taxpay-
ers, such as tax documents, records of the movement
of goods at the border of the state of Cear
´
a, and tax-
payer sales data. Due to confidentiality reasons, we
anonymized the indicators by means of letters and
numbers; more specifically, to anonymize taxpayers
data a sequential ID is assigned to each taxpayer,
while each fraud indicator – fourteen in total – is re-
named by means of the symbols A, B, C, D, E, F, G,
H, I, J, K, L, M, and N. Data from 2009 and 2010 have
the same indicators (A, B, C, D, E, F, G, H, I, J, K, L,
M and N), while data from 2011, despite having the
same number of indicators, is characterized by differ-
ent kinds of indicators, namely X1, X2, X3, X4, X5,
X6, X7, X8, X9, X10, X11, X12, X13, X14; this is
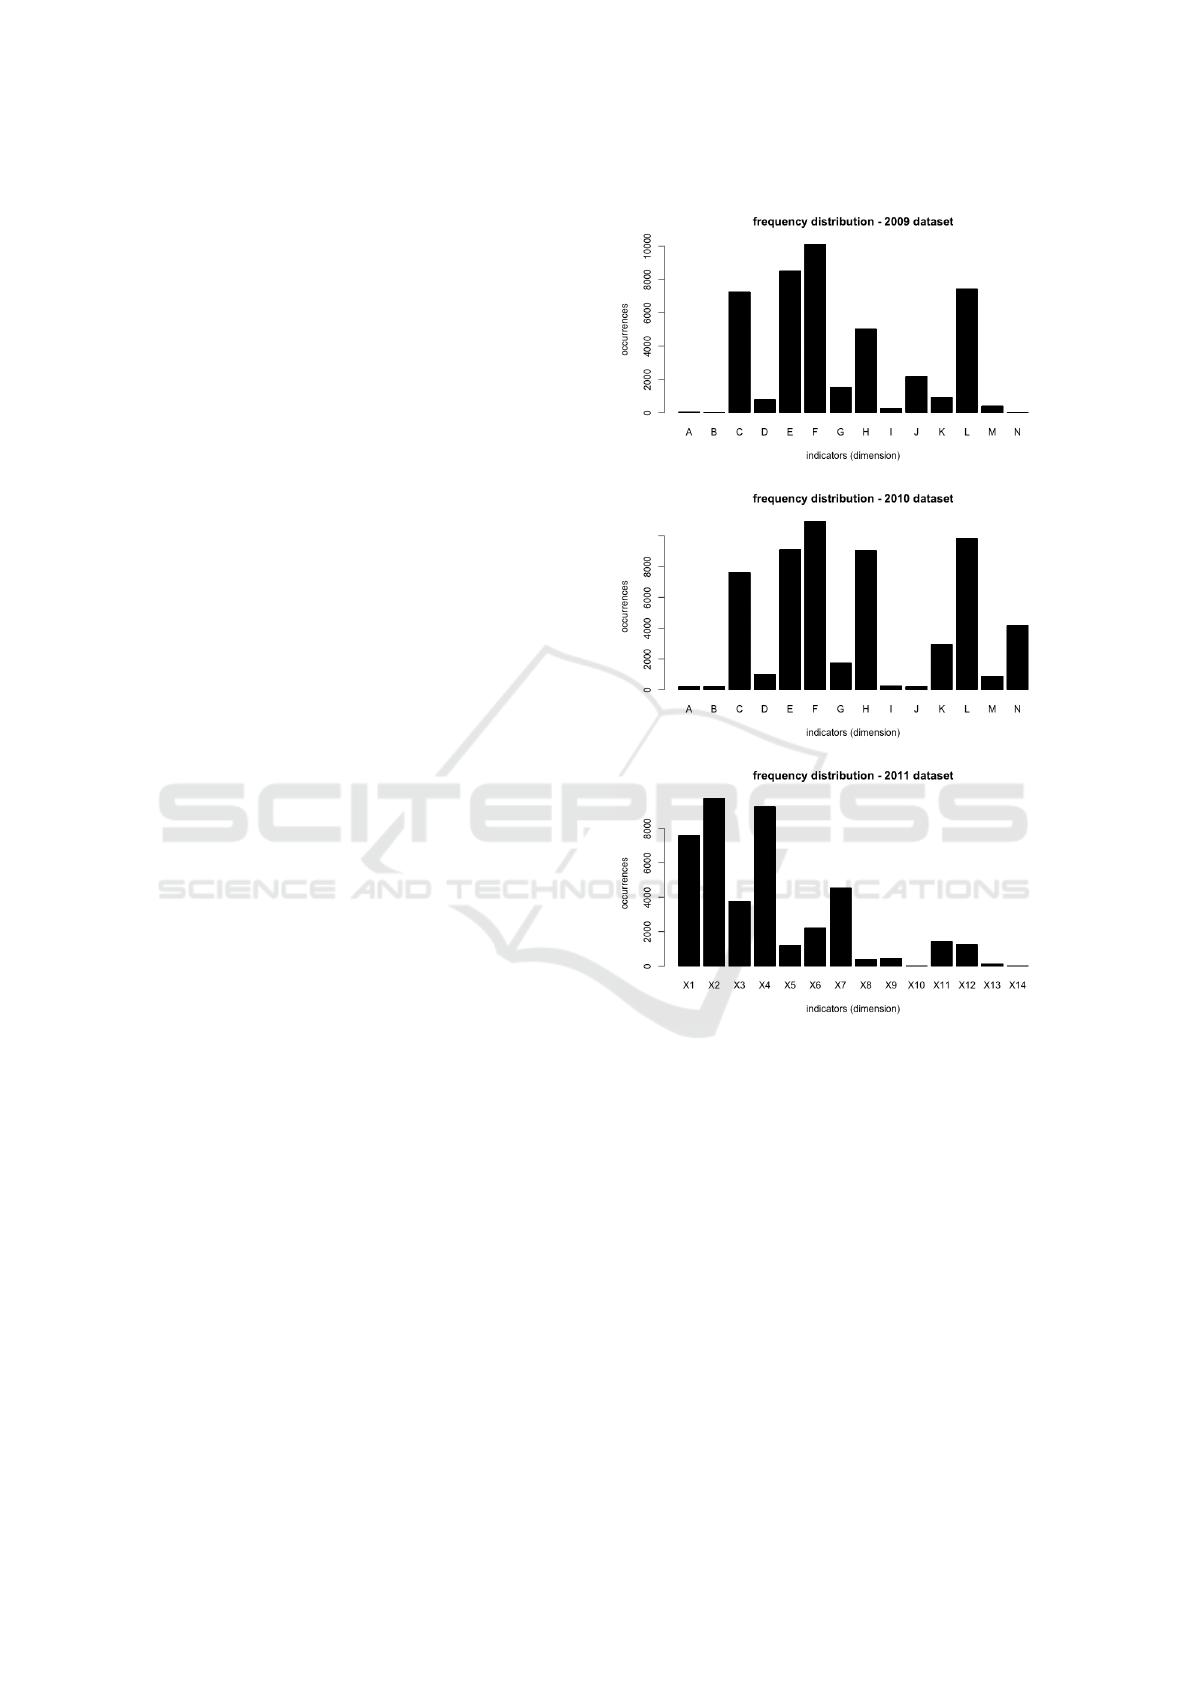
Figure 1: Frequency of tax fraud indicators for the years
2009, 2010 and 2011.
due to the fact that indicators frequently change from
year from year, since fraudster tend to search alterna-
tive ways to avoid paying taxes.
As shown in the section detailing our tax fraud de-
tection method (Section 4), frequent variations affect
fraud indicators (features) year by year: this calls for
an algorithm that is able to automatically identify key
indicators. This, in turn, helps to better characterize
tax fraudsters, thus improving the quality of the re-
sults returned by a predictive model. Indeed, we high-
light that this is one of the main contributions charac-
terizing this paper, thus differentiating our work with
respect to (Matos et al., 2015).
An Accurate Tax Fraud Classifier with Feature Selection based on Complex Network Node Centrality Measure
147

3.2 Tax Fraud Matrices
Three matrices were constructed for the years 2009,
2010, and 2011. Each matrix relates to taxpay-
ers (rows) and their corresponding fraud indicators
(columns). Each indicator uses a binary representa-
tion, where 1 (one) indicates the presence of fraud,
while 0 (zero) the absence. The matrix for data re-
lated to 2009 has 11,386 rows and 14 columns, the
one for 2010 possesses 12,424 rows and 14 columns,
while the one from 2011 contains 10,627 rows and 14
columns. Taxpayers who did not present any evidence
of fraud were excluded, since they were considered
outliers.
3.3 Data Overview
Figure 1 presents three histograms, detailing the fre-
quency of fraud indicator frequencies collected for the
years 2009, 2010 and 2011 respectively. In 2009,
10,789 (95%) out of 11,386 taxpayers have at least
one type of fraud evidence, while 597 (5%) of tax-
payers do not present any evidence. In 2010, 11,989
(96%) out of 12,424 taxpayers exhibit at least one
type of fraud evidence, while 435 (4%) do not present
any kind of anomaly. Overall, we report that the fre-
quency of the vast majority of fraud indicators in-
creased from 2009 to 2010, thus indicating that tax
evasion represents a very relevant problem that needs
to be addressed.
4 TAX FRAUD DETECTION
METHOD
In this section we present a detailed description
of TAXFRAUDDETECTOR, our tax fraud detection
method. The main goal of TAXFRAUDDETECTOR is
to compute the risk that a taxpayer has to commit a
fraud. TAXFRAUDDETECTOR takes in input four pa-
rameters, i.e., a tax fraud matrix, S, and three thresh-
olds, supp, con f , and li f t representing, respectively,
the support, condifence, and lift thresholds used by
the Apriori algorithm (Agrawal et al., 1994) leveraged
within our approach; in this context, we remind that
the value given to li f t determines the final set of asso-
ciation rules deemed relevant by TAXFRAUDDETEC-
TOR, hence highlighting its important role. Algorithm
1 presents the pseudocode.
TAXFRAUDDETECTOR starts by processing the
tax fraud matrix S by means of Apriori (line 2, func-
tion KeyRules): this has the purpose of identifying rel-
evant association rules that, in turn, allow to focus on
the most relevant fraud indicators (function KeyRules,
Algorithm 1: TAXFRAUDDETECTOR.
Input :
• S, the data matrix.
• supp, the support threshold to be used with Apriori.
• con f , the confidence threshold to be used with Apriori.
• li f t, the lift threshold to be used with Apriori.
1 begin
2 kRules ← KeyRules(S, supp, con f , li f t)
3 KeyIndicators ← KFind(kRules)
4 S
0
← Subset(S, KeyIndicators)
5 return DimRedSVD(S
0
)
Algorithm 2: KeyRules(S, supp, con f , li f t).
1 begin
2 RuleSet ←
/
0
3 AP ← Apriori(S, supp, con f )
4 foreach ap ∈ AP do
5 if (Li f t(ap) ≥ li f t) then
6 RuleSet ← RuleSet ∪ {ap}
7 return RuleSet
Algorithm 2, line 5). We note that this is the main
difference our method exhibits with respect to (Matos
et al., 2015), since the latter performs the selection of
key determinants by means of inference rules. Subse-
quently, association rules are used to generate a graph
(we call it fraud graph) and discover the key fraud
indicators (line 3, function KFind). Key indicators
are finally used to filter out from S irrelevant indica-
tors, thus obtaining a modified data matrix S
0
(line 4,
function Subset). The algorithm concludes by reduc-
ing the dimensionality of key indicators, by means of
an SVD-based algorithm (Golub and Reinsch, 1970),
to a single dimension (line 5, function DimRedSVD):
this generates a list of scalars, each one representing
the degree of fraud risk associated with a taxpayer.
Algorithm 3: KFind(kRules).
1 begin
2 KeyIndicator ←
/
0
3 G ← graph where each sequence of indicators appearing in
kRules is a vertex v ∈ V , while each association rule ar ∈ kRules
represents an edge e ∈ E
4 foreach v ∈ G do
5 v
Degree
← v
I nDegree
+ v
OutDegree
6 foreach v ∈ G do
7 if v
Degree
> (AV GDegree(G)+ 3 · ST DevDegree(G)) then
8 KeyIndicator ← KeyIndicator ∪ {v}
9 return KeyIndicator
Before concluding this section we spend two
words on KFind (Algorithm 3). KFind takes in in-
put a set of association rules, i.e., kRules: first, from
kRules it generates a graph, G = (V, E), that repre-
ICEIS 2017 - 19th International Conference on Enterprise Information Systems
148

sents relationships among fraud indicators (line 3).
The graph is built as follows: each vertex represents
a sequence of fraud indicators, while each edge rep-
resents an association rule – for example, the exis-
tence of an association rule (ABC → D) ∈ kRules im-
plies that {ABC, D} ∈ V and (ABC, D) ∈ E. Finally,
KFind selects the nodes having degree (i.e., in-degree
plus out-degree) greater than three times the standard
deviation characterizing G’s degree distribution – in
other words, we exploit the 3-sigma confidence inter-
val (Montgomery, 2007; Bland and Altman, 1996).
5 EXPERIMENTAL SETTING
In the following we present the experimental setting
used to conduct the experiments reported in Section
6.
5.1 Methodology
In order to conduct the experimental evaluation
we applied the following methodology: first, from
the dataset provided by SEFAZ-CE (introduced in
Section 3) we picked up 120 contributors having
the highest values in the ranking list computed by
TAXFRAUDDETECTOR – as such, this list represents
the group of people that, according to our method,
have the highest chance to be fraudsters. Next, from
the same dataset we picked up 50 contributors hav-
ing the lowest values, thus representing the group of
people that, according to our method, have the lowest
chance to be fraudsters.
Subsequently, we provided the two lists to two
experienced tax auditors, who conducted a thorough
analysis to check the correctness of TAXFRAUDDE-
TECTOR’s results and create a ground truth. From
the analysis, they concluded that out of 120 people
making up the first group, 85 were indeed fraudsters,
while out of 50 people making up the second group,
23 were honest taxpayers.
To estimate the accuracy of the classification
methods when employing selected features, we use
the k-fold cross-validation technique; more specifi-
cally, we rely on the 10-fold cross-validation as it
tends to provide less biased estimations (Kohavi et al.,
1995).
5.2 Measures
In order to assess the quality of the results returned
by TAXFRAUDDETECTOR and its competitors, we
resort to well-established metrics commonly used in
data mining to evaluate the quality of a classifier (Tan
Table 1: Confusion matrix, with positive and negative clas-
sification.
Classification Correct Not Correct
Fraudsters 85 (TP) 35 (FP)
Not fraudsters 7 (FN) 23 (TN)
Table 2: Statistical measures used to assess the quality of
the results returned by classifiers.
Measure Definition
Accuracy A =
T P+T N
N
Precision P =
T P
T P+FP
Recall R =
T P
T P+FN
F
1
Score F =
2·R·P
R+P
et al., 2005). In the following we briefly introduce
them.
Given a set of N taxpayers, we can evaluate the
results of a classifier by constructing an integer con-
fusion matrix; in order to do this, we first have to de-
fine the following types of outcomes when consider-
ing any result:
• A True Positive (TP) result occurs when a fraud-
ster is correctly classified as such.
• A False Positive (FP) result occurs when an hon-
est contributor is classified as a fraudster.
• A False Negative (FN) result occurs when a fraud-
ster is not classified as such.
• A True Negative (TN) result occurs when a honest
contributor is classified as honest.
Accordingly, we arranged the figures returned by
the auditors’ evaluation into a confusion matrix (Ta-
ble 1), which in turn allows to easily derive statistical
measures that are commonly used to assess the quality
of a classifier (Table 2).
5.3 Competitors
In the experimental evaluation we compare the fol-
lowing methods:
• TAXFRAUDDETECTOR.
• The method proposed in (Matos et al., 2015),
which is also the current state-of-the-art in the lit-
erature.
• An SVM-based approach that uses indicators (as
features) previously selected by TAXFRAUDDE-
TECTOR.
• An SVM-based approach that uses indicators pre-
viously selected in (Matos et al., 2015).
• An SVM-based approach that does not recur to
any kind of feature selection.
An Accurate Tax Fraud Classifier with Feature Selection based on Complex Network Node Centrality Measure
149

We included an SVM-based classifier mainly for two
reasons: first, to analyze how it performs with re-
spect to our method; secondly, to understand whether
TAXFRAUDDETECTOR can be used as a tool to im-
prove the performance of approaches based on ma-
chine learning techniques. Finally, we report that the
SVM classifier used in this work is based on the radial
basis function kernel.
5.4 Run-time Parameters
When executing TAXFRAUDDETECTOR we provide
the following parameters: supp = 0.6, con f = 0.6
and li f t = 1.05. We report that these values were cho-
sen according to the opinions provided by SEFAZ-CE
business experts.
When executing the algorithm from (Matos et al.,
2015), we provided the same set of parameters that
were used in their paper.
Finally, the SVM-based approach relies on the
SVM package available in R (David Meyer, 2017; R
Core Team, 2016); the following parameters are pro-
vided at execution time: kernel = ”radial”, gamma =
0.01, cost = 10. We report that the values given to
gamma and cost were picked up after trying out dif-
ferent values, with gamma varied in the [10
−6
, 10
−1
]
range and cost varied in the [10
1
, 10
2
] range.
6 EXPERIMENTAL EVALUATION
In this section we assess the quality of the results
achieved by TAXFRAUDDETECTOR and its competi-
tors by means of the measures defined in Table 2, and
according to the data reported in the confusion matrix
(Table 1).
The experiments relates to the results achieved
when considering the dataset covering the year 2011.
Table 3 shows the results. From the results, we no-
tice that TAXFRAUDDETECTOR is able to achieve
the best classification quality, with an F
1
score
equal to 77%, thus indicating that our approach is
able to detect potential fraudsters more effectively
than our competitors. Another observation is that
TAXFRAUDDETECTOR shows better results than the
SVM-based classifier, and that the latter is able to im-
prove its classification quality considerably once it is
combined with our approach (or, to a lesser degree,
with (Matos et al., 2015)). Finally, we report that re-
sults related to data covering the years 2009 and 2010
exhibit similar results (we omit them for brevity).
In general, we deem that the results show how fea-
ture selection, coupled with centrality measure (Boc-
caletti et al., 2006), is able to considerably improve
Figure 2: Degree distribution for the years 2010 and 2011.
The X-axis is associated with the degree, while the Y-axis is
associated with the occurrences of vertices having a given
degree.
the classification of fraudsters, either for TAXFRAUD-
DETECTOR, (Matos et al., 2015), or SVM. As such,
we believe that centrality measure is an adequate fea-
ture for classification, since graphs generated during
the classification process have a degree distribution
that behaves according to the power law (Figure 2).
7 CONCLUSIONS
In this paper we proposed a new method to determine
the risk that taxpayers have to commit tax frauds. The
method extends and improves (Matos et al., 2015) in
that it uses a new technique to discover key indicators
of frauds by resorting to the centrality measure over a
graph of indicators: this implicitly captures relation-
ships between key fraud indicators.
On the one hand, we claim that previous methods
fail to perform accurate predictions since they can-
not cope effectively with changes that affect indica-
tors over time. On the other hand, our technique relies
on the observation that, once we are able to capture re-
lationships between indicators, this allows to find out
the most relevant ones. Moreover, the degree distri-
bution of a graph of indicators behaves according to a
power law, which in turn suggests that key indicators
retain their importance regardless of the scale used to
ICEIS 2017 - 19th International Conference on Enterprise Information Systems
150

Table 3: Assessment of the quality of the results returned by TAXFRAUDDETECTOR and its competitors when analyzing the
SEFAZ-CE 2011 dataset.
Method Accuracy Precision Recall F
1
Score
TAXFRAUDDETECTOR 81.33% 78.14% 76.08% 77.0962%
(Matos et al., 2015) 51.27% 48.94% 51.11% 50.0014%
SVM using TAXFRAUDDETECTOR 56.26% 53.12% 47.23% 50.0021%
SVM using (Matos et al., 2015) 33.42% 30.07% 39.13% 34.0069%
SVM 87.49% 45.09% 8.22% 13.9112%
analyze them. As such, this scenario represents a typ-
ical complex network, hence a proper analysis of the
underlying topology can offer useful insights into the
network properties.
In the experimental evaluation we show that our
approach achieves F
1
scores of about 54% greater
than (Matos et al., 2015) when considering the dataset
introduced by this work, while it maintains equivalent
F
1
scores when considering the dataset introduced in
(Matos et al., 2015). Furthermore, we show that our
method is able to improve F
1
scores of about 47%
with respect to an SVM-based approach, when con-
sidering the dataset introduced in this work.
As a future line of research, we are considering the
application of other metrics over graph determinants
to further improve the feature selection process; fi-
nally, we plan to explore more issues related to graph
topology, which in turn have the potential to improve
the accuracy of fraud detection.
REFERENCES
Abbott, L. J., Park, Y., and Parker, S. (2000). The effects of
audit committee activity and independence on corpo-
rate fraud. Managerial Finance, 26(11):55–68.
Agrawal, R., Srikant, R., et al. (1994). Fast algorithms for
mining association rules. In Proc. 20th int. conf. very
large data bases, VLDB, volume 1215, pages 487–
499.
Bhattacharyya, S., Jha, S., Tharakunnel, K., and West-
land, J. C. (2011). Data mining for credit card fraud:
A comparative study. Decision Support Systems,
50(3):602–613.
Bland, J. M. and Altman, D. G. (1996). Statistics notes:
measurement error. Bmj, 313(7059):744.
Boccaletti, S., Latora, V., Moreno, Y., Chavez, M., and
Hwang, D.-U. (2006). Complex networks: Structure
and dynamics. Physics reports, 424(4):175–308.
David Meyer (2017). Support Vector Machines. FH Tech-
nikum Wien, Austria.
Fanning, K. M. and Cogger, K. O. (1998). Neural network
detection of management fraud using published finan-
cial data. International Journal of Intelligent Systems
in Accounting, Finance & Management, 7(1):21–41.
Glancy, F. H. and Yadav, S. B. (2011). A computational
model for financial reporting fraud detection. Deci-
sion Support Systems, 50(3):595–601.
Golub, G. H. and Reinsch, C. (1970). Singular value de-
composition and least squares solutions. Numerische
mathematik, 14(5):403–420.
Kirkos, E., Spathis, C., and Manolopoulos, Y. (2007). Data
mining techniques for the detection of fraudulent fi-
nancial statements. Expert systems with applications,
32(4):995–1003.
Kohavi, R. et al. (1995). A study of cross-validation and
bootstrap for accuracy estimation and model selection.
In Ijcai, volume 14, pages 1137–1145.
Li, S.-H., Yen, D. C., Lu, W.-H., and Wang, C. (2012).
Identifying the signs of fraudulent accounts using data
mining techniques. Computers in Human Behavior,
28(3):1002–1013.
Matos, T., de Macedo, J. A. F., and Monteiro, J. M. (2015).
An empirical method for discovering tax fraudsters: A
real case study of brazilian fiscal evasion. In Proceed-
ings of the 19th International Database Engineering
& Applications Symposium, pages 41–48. ACM.
Montgomery, D. C. (2007). Introduction to statistical qual-
ity control. John Wiley & Sons.
Ngai, E., Hu, Y., Wong, Y., Chen, Y., and Sun, X. (2011).
The application of data mining techniques in finan-
cial fraud detection: A classification framework and
an academic review of literature. Decision Support
Systems, 50(3):559–569.
Phua, C., Lee, V., Smith, K., and Gayler, R. (2010). A
comprehensive survey of data mining-based fraud de-
tection research. arXiv preprint arXiv:1009.6119.
R Core Team (2016). R: A Language and Environment for
Statistical Computing - version 0.99.903. R Founda-
tion for Statistical Computing, Vienna, Austria.
Ravisankar, P., Ravi, V., Rao, G. R., and Bose, I. (2011).
Detection of financial statement fraud and feature se-
lection using data mining techniques. Decision Sup-
port Systems, 50(2):491–500.
S
´
anchez, D., Vila, M., Cerda, L., and Serrano, J.-M. (2009).
Association rules applied to credit card fraud detec-
tion. Expert Systems with Applications, 36(2):3630–
3640.
Shavers, C., Li, R., and Lebby, G. (2006). An svm-based
approach to face detection. In 2006 Proceeding of
the Thirty-Eighth Southeastern Symposium on System
Theory, pages 362–366. IEEE.
Sonegometro (2016 (Retrieved December 14,
2016)). Tax Evasion in Brazil. http://
www.quantocustaobrasil.com.br.
Tan, P.-N., Steinbach, M., and Kumar, V. (2005). Introduc-
tion to Data Mining, (First Edition). Addison-Wesley
Longman Publishing Co., Inc., Boston, MA, USA.
An Accurate Tax Fraud Classifier with Feature Selection based on Complex Network Node Centrality Measure
151
