
Recognizing Sleep Stages with Wearable Sensors in Everyday Settings
Ulrich Reimer
1
, Sandro Emmenegger
1
, Edith Maier
1
, Zhongxing Zhang
2
and Ramin Khatami
2
1
Institute for Information and Process Management, University of Applied Sciences St. Gallen, Switzerland
2
Center for Sleep Research and Sleep Medicine, Clinic Barmelweid, Switzerland
Keywords:
Sensor Data Analysis, Deep Learning, Sleep Stage Recognition, Behavioural Change Support.
Abstract:
The paper presents results from the SmartSleep project which aims at developing a smartphone app that gives
users individual advice on how to change their behaviour to improve their sleep. The advice is generated
by identifying correlations between behaviour during the day and sleep architecture. To this end, the project
addresses two sub-tasks: detecting a user’s daytime behaviour and recognising sleep stages in an everyday
setting. The focus of the paper is on the second task. Various sensor devices from the consumer market
were used in addition to the usual PSG sensors in a sleep lab. An expert assigned a sleep stage for every 30
seconds. Subsequently, a sleep stage classifier was learned from the resulting sensor data streams segmented
into labelled sleep stages of 30 seconds each. Apart from handcrafted features we also experimented with
unsupervised feature learning based on the deep learning paradigm. Our best results for correctly classified
sleep stages are in the range of 90 to 91% for Wake, REM and N3, while the best recognition rate for N2 is
83%. The classification results for N1 turned out to be much worse, N1 being mostly confused with N2.
1 INTRODUCTION
Sleep quality is associated with health, wellbeing and
quality of life. Sleep disorders, however, are wide-
spread and often coincide with chronic health pro-
blems such as diabetes, hypertension, obesity as well
as cardiovascular and psychiatric diseases such as de-
pression. According to a recent survey (Tinguely
et al., 2014), about 20% of people in Switzerland suf-
fer from sleep disorders. About 28% of those affected
were taking sleeping pills on a regular basis. Approxi-
mately 80% of patients with depression also complai-
ned about sleep disorders which can be considered
predictors of future depression. According to a meta
analysis of over 20 published longitudinal studies be-
tween 1980 and 2010, insomnia doubles the risk of
suffering from depression (Baglioni et al., 2011).
Overall, experts agree that the prevalence of sleep
disorders such as obstructive sleep apnoea (OAS) or
daytime sleepiness tends to be underestimated. Sleep
disorders therefore often remain undiagnosed and
untreated even though they are a significant cause of
morbidity and mortality (Hossain and Shapiro, 2002);
for a detailed review of sleep disorders sleepiness, see
(Panossian and Avidan, 2009).
Traditionally, sleep disorders are investigated in
sleep laboratories by means of polysomnography
(PSG) as well as by actigraphic assessment. A polys-
omnogram or sleep study usually involves the measu-
rement of brain activity through the electroencepha-
logram (EEG), muscular activity (EMG) and eye mo-
vements (EOG). Other parameters monitored include
oxygen saturation, respiratory effort, cardiac activity
as well as sound and movement activity.
But not only is such sleep monitoring costly, it
also removes people from their normal sleeping en-
vironment and prevents repeated or longitudinal stu-
dies. Increasingly, home sleep recording systems are
coming on the market which aim to reduce the finan-
cial cost and reach a larger population (Subramanian
et al., 2011). However, without medical or technical
training, people often fail to place the sensors in the
correct positions which results in inconclusive data.
Even if done correctly, the challenge remains of ac-
tually analysing or scoring the data, which requires
specific expertise.
More recently, smart watches, fitness trackers as
well as sensors built into a smartphone offer new op-
portunities for continuous monitoring in every-day
settings. Sensors and wearables can capture data
172
Reimer, U., Emmenegger, S., Maier, E., Zhang, Z. and Khatami, R.
Recognizing Sleep Stages with Wearable Sensors in Everyday Settings.
DOI: 10.5220/0006346001720179
In Proceedings of the 3rd International Conference on Information and Communication Technologies for Ageing Well and e-Health (ICT4AWE 2017), pages 172-179
ISBN: 978-989-758-251-6
Copyright © 2017 by SCITEPRESS – Science and Technology Publications, Lda. All rights reserved

about people’s rest and activity patterns. Most devices
use accelerometers for tracking movements during the
night from which they derive information on sleep ar-
chitecture and sleep quality. Some devices take addi-
tional vital parameters into account, such as heart rate
and skin conductance.
However, the tracking devices and sleep screen-
ing apps currently available cannot compete with the
accuracy of clinical sleep laboratories. At best, they
are able to distinguish between waking time and sleep
time. When we compared different devices that claim
to distinguish sleep phases we found little match be-
tween the identified sleep stages. Besides, accor-
ding to a review of current sleep screening applica-
tions conducted by Behar and his team (Behar et al.,
2013) none of the existing sleep monitoring applica-
tions available for smartphones with the exception of
simple questionnaires, is based on scientific evidence.
The ability to reliably detect sleep stages and thus
monitor sleep architecture on a daily basis in a home
setting is a prerequisite for
• finding individual correlations between behaviour
during the day and sleep architecture,
• measuring the effects interventions and behaviou-
ral changes have on sleep architecture, e.g. for
monitoring therapeutical effects of daytime acti-
vity of patients suffering from depression, or
the effects of interventions aimed at stabilising
sleep/wake phases especially with older people,
• monitoring the effects of individual cognitive be-
havioural therapy for insomnia, especially the ele-
ments of sleep restriction and stimulus control,
• enabling the recognition and quantification of the
effects of activity and movement as well as sleep
quality on the rehabilitation process.
Given the shortcomings of existing solutions for
monitoring sleep architecture in a home setting, the
SmartSleep
1
Project set out to achieve the following
objectives (cf. Fig.1):
• use data captured with wearable sensors to iden-
tify and record sleep stages with an accuracy ap-
proximating a clinical polysomnography,
• based on the above, develop a low-cost monito-
ring solution for capturing sleep architecture at
home over a longer period of time,
1
The SmartSleep project is funded by the International
Bodensee Hochschule. The consortium includes the Uni-
versities of Applied Sciences of St. Gallen, of Vorarlberg
and of Constance, the Center for Sleep Research and Sleep
Medicine at the Swiss Clinic Barmelweid and the two SMEs
Biovotion and myVitali.
Personalized hypotheses for correlations
Detect3sleep3stages
Detect3types3&3intensity
of3activities
Activities during the day
Sleep architecture
Figure 1: The objectives of the SmartSleep project.
• collect data about a user’s daytime behaviour and
environmental factors to identify possible correla-
tions with sleep architecture as well as a person’s
perceived quality of sleep.
The last objective is the ultimate goal of the pro-
ject, which is expected to open up the possibility to
track a person’s response to simple behavioural inter-
ventions e.g. more physical activity or more exposure
to ambient light during the day, and based on these in-
sights to automatically generate individual advice for
behavioural changes.
2 APPROACH
The main project objective is to develop a smartp-
hone app that gives users individual advice on how
to change their behaviour to improve their sleep. The
advice is generated by identifying significant corre-
lations between behaviour during the day and sleep
architecture. Additionally, a subjective assessment of
sleep quality can be done using a questionnaire. Such
correlations provide useful indications about which
kinds of behaviour have a positive or a negative ef-
fect on sleep quality.
The impact of behaviour changes can subse-
quently be measured by repeating the measurements
of sleep architecture and a subjective assessment of
sleep quality.
The correlations discovered by data mining are
highly personal because individuals differ greatly
with regard to what may promote and what may hin-
der sleep. Whereas for one person a walk in the eve-
ning is very conducive to a good night’s sleep, so-
meone else may get too agitated. This is why in the
project we focus on recognising patterns that apply to
a specific individual rather than on statistical correla-
tions in a population.
To achieve the project goals we address two sub-
tasks. Firstly, we are developing a component for acti-
vity recognition in order to detect a user’s daytime
Recognizing Sleep Stages with Wearable Sensors in Everyday Settings
173

behaviour (Sec.2.1). Secondly, we are developing a
component for recognising sleep architecture, i.e. the
sequence and frequency of the various types of sleep
stages in the course of a night (Sec.2.2).
2.1 Activity Detection
At present, we are considering the following features
for characterizing daytime behaviour:
• Elementary activities such as walking, running,
cycling: Elementary activities are detected from
the data of one or two accelerometers a user is we-
aring. A detection algorithm with an accuracy of
more than 90% has been developed based on algo-
rithms published in the literature – see e.g. (Kwa-
pisz et al., 2011; Alsheikh et al., 2015).
• Complex activities such as household chores, wor-
king in the garden or kitchen: In the project we
are currently developing a classifier for detecting
complex activities using data mining techniques
(Sohm, 2016). The classifier can be trained by
users individually by giving feedback on their
activities. In this way, activity detection is tailo-
red to those activities relevant for each individual
user. The classifier makes use of accelerometer
data taken from the smartphone or from accelero-
meters worn at the wrist and/or ankle.
• Body postures (standing, sitting, lying): One of
the accelerometers we are using has built-in pos-
ture detection.
• Stress level: Stress level is captured by the app
developed in our SmartCoping project (Reimer
et al., 2017)
• Activity index associated with times of the day
(morning, afternoon, evening): The activity in-
dex is calculated from the duration and intensity
of movement during a given time period.
Further data sources for detecting daytime behavi-
our might be added in the future, e.g. data from smart
metering of electricity and water consumption, which
would allow a quite detailed monitoring of a person’s
behaviour at home. Of course, privacy issues need to
be taken special care of.
2.2 Recognition of Sleep Stages from
Wearable Sensors
The automatic detection of sleep stages from sensor
data is a goal that many researchers are currently pur-
suing. Most existing approaches work on the polys-
omnography data generated in a sleep lab, i.e. EEG,
EOG and EMG (see e.g. (L
¨
angkvist et al., 2012; Her-
rera et al., 2013; Shi et al., 2015)). So far only very
few papers have been published on detecting sleep
stages from wearable sensors developed for the con-
sumer market. Some of them use other consumer sen-
sors as the ground truth rather than a clinical gold
standard such as PSG against which they evaluate
their systems and algorithms (Gu et al., 2014; Rah-
man et al., 2015).
Among the few papers that have reported the use
of sensors suited to a home setting, only a small
fraction has actually validated their results against
a clinical gold standard such as PSG or the Recht-
schaffen and Kales method (R-K method). Automatic
sleep stage recognition based on heart rate and body
movement was investigated in (Kurihara and Wata-
nabe, 2012) and the accuracy of their system compa-
red with the R-K method. (O’Hare et al., 2015) dis-
cuss the detection of sleep and waking time by various
motion sensors and compare them with PSG measu-
rements taken in parallel. They were not concerned
with the detection of different sleep stages, however.
For our SmartSleep project we could not use the
sleep stage recognition services of any of the exis-
ting body sensors that offer sleep stage detection be-
cause the sleep stage recognition implemented has
been shown to be rather unreliable. Many of them
even have difficulty in distinguishing sleep from wa-
king phases with sufficient accuracy (Kolla et al.,
2016). These findings coincide with the results of our
own experiments which compared two of those devi-
ces and found nearly no correlation between detected
sleep stages at all. Therefore it was necessary to de-
velop our own recognition algorithm.
Recognition algorithms are not handcrafted but
obtained by learning a classifier for each sleep stage.
For this we need a) appropriate input data from which
to learn the sleep stage classifiers, b) an appropri-
ate learning algorithm. The input data was provided
by the clinical project partner who has taken mea-
surements with our consumer sensors in parallel to
classical PSG. Using data mining algorithms we then
were able to correlate the sleep stages as recorded in
the PSG hypnogram with specific patterns in the data
from the consumer sensors. The patterns so identified
can then be used to segment sensor data streams into
sleep stages. The following section describes our ap-
proach in more detail, first explaining the experimen-
tal set-up (Sec.3.1) and then distinguishing between
using handcrafted features (Sec.3.2) and features le-
arned via a deep belief network (Sec.3.3) .
ICT4AWE 2017 - 3rd International Conference on Information and Communication Technologies for Ageing Well and e-Health
174
3 LEARNING SLEEP STAGE
CLASSIFIERS
3.1 Experimental Set-up
We have been experimenting with several kinds of
wearable sensors and finally focused on the following
two:
• Zephyr BioHarness 3
2
chest strap with a reporting
frequency of 1 Hz for the channels: heart rate, bre-
athing rate, breathing rate amplitude, ECG ampli-
tude as well as minimum and peak levels of the
vertical, lateral and sagittal axes
• two MSR 145B
3
accelerometers – one at the wrist
and one at the ankle, with a sampling frequency
of 51.2 Hz
These sensors were given to 26 healthy volunteers in
addition to the usual PSG sensors in the sleep lab of
the clinical project partner. For each person the sleep
stages (‘Wake’, ‘REM’, ‘N1’, ‘N2’, ‘N3’)
4
were la-
belled by experts according to the gold standard of the
AASM classification
5
. This resulted in sensor data
streams segmented into labelled sleep stages of 30
seconds each, from which the sleep stage classifiers
were subsequently learned. We used a Random Fo-
rest classifier, an ensemble learning approach which
has also been used by other researchers for learning
sleep stage classifiers and has shown to be superior to
an SVM ensemble by (Radha et al., 2014).
The sleep stage classifiers learned from the data
of the 26 healthy volunteers will from now on serve
as a baseline. Further classifiers will be learned for
patients with specific diagnoses.
We used the Weka libraries
6
to learn the Random
Forest classifier. The data processing pipeline was
implemented with the Matlab language in an object-
oriented architecture. The classes and processing sta-
ges were inspired by the pipes and filter patterns des-
cribed in (Buschmann et al., 2013). This enables us
to set up new experiments in a fast and flexible way
by appropriately combining data file readers, interpo-
lation and data merging stages, filtering, feature con-
struction and classification steps. The execution envi-
ronment is Matlab 2016b.
2
www.zephyranywhere.com
3
www.msr.ch
4
REM corresponds to rapid eye movement sleep, while
N1 to N3 correspond to progressively deeper stages of
sleep, N1 standing for light sleep, N3 for deep sleep.
5
www.esst.org/adds/ICSD.pdf
6
weka.wikispaces.com
The quality of the learned classifiers not only de-
pends on the chosen algorithm and its parameter set-
tings but above all depends on the features being used.
Especially in the case of learning from sensor data,
identifying significant features is a critical and dif-
ficult task. We have experimented with handcrafted
features (see Fig. 2 and Sec.3.2) as well as with unsu-
pervised feature learning based on the deep learning
paradigm (see Fig. 2 and Sec.3.3).
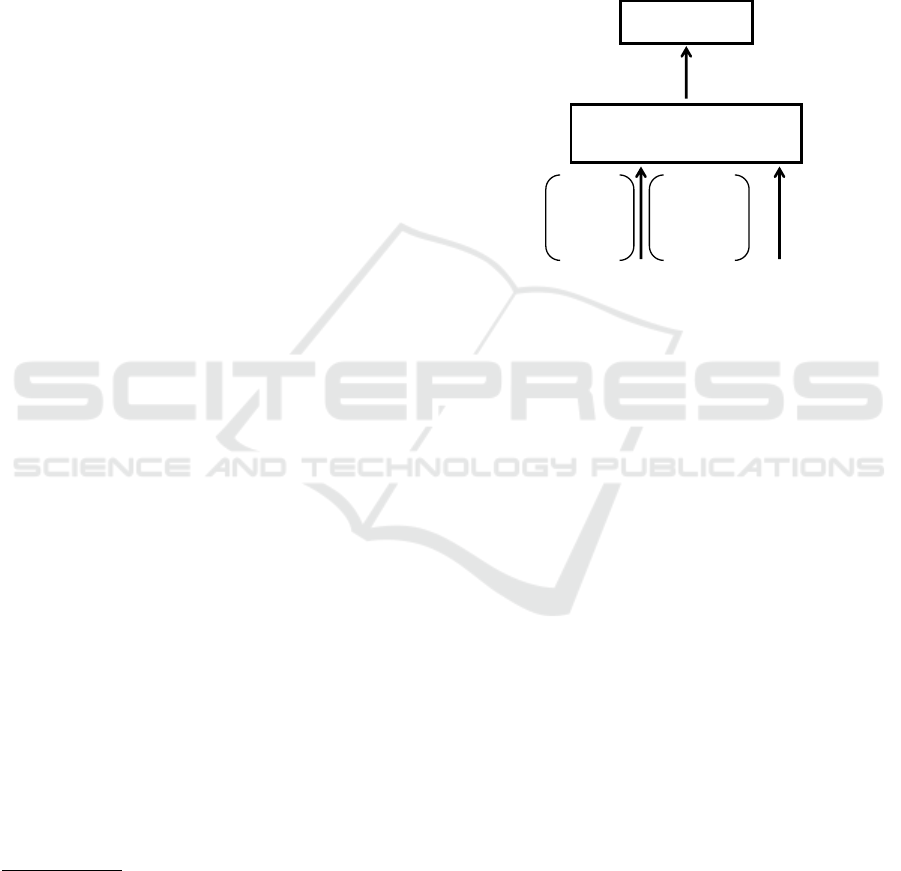
!"#$%&'(#))$*$+"
,"#$%$%-&.#!#/
0#1+((+2& 34)+'&$%!+"5#()&6&
#))7'$#!+2&*+#!8"+&5+'!7")
"#9&)+%)7"&2#!#
:#%27;&<7"+)!&
=(#))$*$+"
#>&
?#%2'"#*!+2
*+#!8"+)
1>&
?$-@+"A7"2+"&
*+#!8"+)&*"7;
2++B&(+#"%$%-
)(++B&)!#-+&
(#1+()&
Figure 2: Feature generation and classification pipeline.
3.2 Handcrafted Features
Finding significant features usually involves much ex-
perimentation, in particular in the case of sensor data
streams. We did a literature review to identify featu-
res that worked for other researchers. We looked into
handcrafted features used for recognising sleep sta-
ges, e.g. (Panagiotou et al., 2015), as well as for re-
cognising activity types, e.g. (Alsheikh et al., 2015).
Based on the literature review, we decided to use the
following functions to calculate the features from the
sensor raw data:
• energy (sum of power at each frequency),
• max frequency,
• root mean square of sensor channel values,
• skewness (asymmetry of the probability distribu-
tion relative to its mean),
• standard deviation,
• vector norm (length of vector of sensor channel
values).
More systematic experimentation with other features
will be needed including an analysis of the impact of
each feature on the learned classifiers. Based on the
insights gained we might derive a more appropriate
feature set resulting in classifiers that are more accu-
rate.
Recognizing Sleep Stages with Wearable Sensors in Everyday Settings
175

The handcrafted features are functions which ag-
gregate the raw data of each 30 second window and
each sensor channel into a value. For the ten channels
of the Zephyr sensor and the six channels of the two
MSR accelerometers, this results in a feature vector of
96 components per 30 second sleep stage event. With
these features a Random Forest classifier of 99 trees
was learned. The confusion matrices in Tables 1, 2
and 3 show the classification accuracy of the learned
classifiers based on a tenfold cross-validation.
Table 1: Confusion matrix: Handcrafted features MSR.
Instances: 20271
Correctly Classified: 15434 76.1%
Predicted
% REM Wake N1 N2 N3
REM 83.2 3.9 9.0 3.6 0
Wake 0.9 84.6 10.4 3.7 0
N1 7.4 14.7 49.3 27.6 1.0
N2 1.5 4.0 13.3 76.9 4.4
N3 0 2.6 1.6 7.3 88.2
Table 2: Confusion matrix: Handcrafted features Zephyr.
Instances: 4891
Correctly Classified: 3797 77.6%
Predicted
% REM Wake N1 N2 N3
REM 87.2 1.9 2.7 6.6 1.7
Wake 0.8 86.7 5.4 6.2 1.0
N1 12.6 16.4 26.6 40.7 3.7
N2 2.7 3.4 7.5 79.0 7.3
N3 0.8 1.9 0.6 6.1 90.7
Table 3: Confusion matrix: Handcrafted features MSR &
Zephyr.
Instances: 4695
Correctly Classified: 3790 80.7%
Predicted
% REM Wake N1 N2 N3
REM 91.0 1.4 2.1 4.2 1.2
Wake 0 90.3 4.5 4.1 0.8
N1 8.1 16.3 32.9 41.0 1.7
N2 1.9 2.0 7.6 83.1 5.4
N3 0 2.2 0 5.7 91.3
3.3 Unsupervised Feature Learning
Using a Deep Belief Network
Feature engineering is a labour-intensive task. In-
spired by the recent enthusiasm about deep learning
(Bengio et al., 2012) we decided to find out how le-
arning a Random Forest classifier using handcrafted
features related to one using features learned via deep
learning. Especially in the context of learning sleep
stage classifiers, (L
¨
angkvist et al., 2012) have already
v
1
v
2
v
3
v
n
h
11
h
12
h
1j
.).).
.).).
h
21
h
22
h
2k
.).).
input)layer:
sensor)raw)data
first)hidden)layer
second)hidden)layer:
output)layer)with
higher<order)features
Figure 3: Structure of a deep belief network of two stacked
Restricted Boltzmann Machines.
shown that unsupervised feature learning with deep
learning is promising. We followed a similar appro-
ach and automatically derived higher-order features
from the raw data of the sensors by applying a deep
belief network (DBN) built from stacked Restricted
Boltzmann Machines (RBM) – cf. Fig.3. These
higher-order features reflect significant patterns in the
underlying raw data and are therefore well suited as
features for a classifier.
We used the open source Deep Belief Network
Matlab implementation DeeBNet
7
(Keyvanrad and
Homayounpour, 2014). The input vector to the DBN,
i.e. the raw sensor data for each 30 second sleep stage
event, is constructed as follows:
• For the Zephyr chest strap we have 10 channels
with a sampling frequency of 1 Hz. This amounts
to 300 components in the input vector.
• For the two MSR accelerometers we have 6 chan-
nels in total with an interpolated sampling fre-
quency of 20 Hz. This amounts to 3600 compo-
nents in the input vector.
For the approximation of the log-likelihood gra-
dient the one-step contrastive divergence (CD) met-
hod as proposed by (Hinton, 2002; Carreira-Perpinan
and Hinton, 2005) was applied. As part of future
fine-tunings we might experiment with other approx-
imation methods and parameters for the RBMs in the
DBN.
Configuring a DBN and finding a good topology
requires both expertise and experimentation (Hinton,
2012). We experimented with various combinations
of numbers of hidden layers and numbers of hidden
units for each layer and also used different numbers of
learning epochs. It turned out that the results in terms
of classifier accuracy did not change significantly.
The accuracy of the learned Random Forest clas-
sifier based on the features learned by the DBN is
7
ceit.aut.ac.ir/~keyvanrad/DeeBNet%20Toolbox.html
ICT4AWE 2017 - 3rd International Conference on Information and Communication Technologies for Ageing Well and e-Health
176

shown by the confusion matrices in Tables 4, 5 and
6. They are based on a DBN with two hidden layers,
the second one being larger than the first layer. The
results are discussed in the following section.
Table 4: Confusion matrix: DBN-created features MSR.
Layer 1: 886 hidden units, 50 epochs
Layer 2: 14184 hidden units, 150 epochs
Instances: 17803
Correctly Classified: 13820 77.6%
Predicted
% REM Wake N1 N2 N3
REM 86.6 2.0 7.4 3.6 0
Wake 1.2 83.5 10.4 4.2 0.7
N1 7.9 13.8 48.5 28.0 1.8
N2 1.4 2.3 11.2 79.7 5.4
N3 0 1.6 1.5 6.7 89.8
Table 5: Confusion matrix: DBN-created features Zephyr.
Layer 1: 1320 hidden units, 150 epochs
Layer 2: 1320 hidden units, 150 epochs
Instances: 14760
Correctly Classified: 9702 65.7%
Predicted
% REM Wake N1 N2 N3
REM 76.1 2.4 7.6 10.8 3.0
Wake 3.1 66.9 13.9 12.7 3.4
N1 11.4 9.3 36.5 37.2 5.5
N2 5.4 3.0 13.3 67.6 10.8
N3 2.1 2.3 2.7 13.1 79.8
Table 6: Confusion matrix: DBN-created features MSR &
Zephyr.
Layer 1: 1965 hidden units, 150 epochs
Layer 2: 7860 hidden units, 150 epochs
Instances: 12103
Correctly Classified: 8978 74.2%
Predicted
% REM Wake N1 N2 N3
REM 86.1 1.3 6.8 4.8 1.0
Wake 1.5 76.9 11.6 8.5 1.5
N1 10.9 9.8 41.0 35.2 3.2
N2 2.8 2.2 10.3 76.7 8.0
N3 0.8 1.7 1.6 9.8 86.2
4 DISCUSSION OF RESULTS
Our results are significantly better than those repor-
ted by other researchers who also used sensors suit-
able for home settings. For example, (Kurihara and
Watanabe, 2012) achieved a mean of correctly classi-
fied sleep stages of 56.2% when comparing their ap-
proach against the R-K method with 5 distinct sleep
stages. For distinguishing between sleep and waking
time (O’Hare et al., 2015) presented a classifier with a
mean number of correct classifications of approxima-
tely 85% against PSG measurements. Our best result
for identifying waking time against any of the sleep
stages is 90.3% (see Table 3). (Borazio et al., 2014)
used a wrist-worn accelerometer to detect sleep and
wake phases and reported a precision of 79% for de-
tecting sleep and 75% for wake phases against PSG
measurements taken in parallel.
(Gu et al., 2014) presented a classifier and eva-
luated it against another consumer device as a refe-
rence point and achieved 63.7% of correctly classified
REM stages and 60% of correctly classified N3 sta-
ges against that device. (Rahman et al., 2015) presen-
ted a classifier that was compared against two other
consumer devices and achieved 80.5% when distin-
guishing REM vs. non-REM stages and 89.3% when
distinguishing sleep from waking times.
When using handcrafted features our experimen-
tal set-up of two accelerometers achieves a surpri-
singly high overall recognition rate which is com-
parable with that of the Zephyr chest strap. When
using features learned by the DBN, recognition with
the chest strap deteriorates (Table 5). The recognition
rate with the accelerometers, however, stays about the
same.
In all cases one would have expected the chest
strap, which delivers heart rate and breathing rate
in addition to accelerometer data (although measured
only at the chest), to be superior to accelerometers
only. The reasons for the weak performance of the
chest strap are twofold: First, we had many misrea-
dings due to the electrodes losing contact whenever a
person moved. We therefore had to filter out a great
proportion of the sensor data stream, which reduced
the number of learning examples to about a quarter
of those we had available for the accelerometers. Se-
cond, the chest strap we used delivers a reading for
heart rate and breathing rate only every second, alt-
hough it works internally with 250 Hz for the ECG
signal. For the built-in accelerometer we only get the
minimum and peak values of the last second. Especi-
ally in the case of deep learning the low resolution on
all the channels impedes the learning of strong featu-
res.
The fact that recognition rates with the two accele-
rometers are about the same when using handcrafted
features and when using learned features show that
deep learning works quite nicely, i.e. without any ex-
perience which kind of features work best we achie-
ved a high recognition rate right from the start.
Besides, it is worth mentioning that in all cases the
recognition rates for sleep stage N1 were particularly
weak, N1 primarily being confused with N2. Whilst
Recognizing Sleep Stages with Wearable Sensors in Everyday Settings
177

a human expert can quite easily distinguish N1 from
N2 it seems that the sensor data we used either do
not provide appropriate criteria for reliably recogni-
sing N1 or lack sufficient resolution in the case of the
chest strap.
We also looked at the recognition rates for indivi-
dual persons and how much they vary. To this end, we
trained classifiers without the data from preselected
persons and then classified the sensor data of those
individuals using the classifier. We did this for 14 per-
sons for the combination of the MSR and Zephyr sen-
sors. For the 14 persons four recognition rates were
above 80%, six were between 70% and 80%, three
between 60% and 70% and one below that. The best
recognition rate over all sleep stages was 82.1% while
the worst was 56.1%, which was mainly due to a very
low recognition rate of 27.3% of REM events. The as-
sociated person had nearly no REM events at all (only
18 as compared to 100 to 280 REM events for the ot-
her test persons) and they might have been atypical.
We will have to investigate this drop in recognition
rate more closely.
5 OUTLOOK
Because of our disappointing experience with the
chest strap we have been looking for alternatives.
While there are other chest straps that offer higher
resolutions there would still be the problem of mis-
readings and artifacts because movement in bed often
causes a loss of electrode contact. We have therefore
begun to experiment with a different sensor from our
project partner Biovotion which is positioned at the
upper arm. Besides skin temperature and accelero-
meter data it provides three opto-electronic sensors
for different wavelengths which measure the absorp-
tion by the tissue. First results are encouraging be-
cause they show recognition rates of already 77% for
N2, 84% for N3 and of 77% for REM even for a small
amount of learning data of 4069 labeled sleep stages.
We are currently collecting more data and expect to
achieve higher recognition rates than with the chest
strap.
Concerning the deep belief network, we have ex-
perimented with different numbers of hidden layers
and different numbers of nodes per layer but recogni-
tion rates stayed about the same. While topology does
not seem to have a critical influence there are many
more parameters to experiment with (Hinton, 2012),
which will be one of our next tasks. Further impro-
vements of recognition rates might come from consi-
dering transition probabilities between sleep phases,
which is something we are currently looking into as
well.
The sleep stage classifiers we have learned so far
are for healthy individuals but we will also learn furt-
her classifiers for patients with specific diagnoses. We
also plan to learn additional classifiers from the data
of both healthy persons and patients put together. Our
aim is to find out if it is possible to come up with clas-
sifiers that work for all people – healthy or ill – or find
out to which extent they need to be specific for certain
groups of people.
Finally, we are planning to integrate the results of
the SmartSleep project into our framework of beha-
vioural change support systems (Reimer and Maier,
2016) as we are convinced that giving personalised
advice is a major factor in supporting for behavioural
changes.
ACKNOWLEDGEMENTS
We would like to thank the anonymous reviewers of
an earlier version of this paper for their helpful com-
ments.
REFERENCES
Alsheikh, M. A., Selim, A., Niyato, D., Doyle, L., Lin, S.,
and Tan, H.-P. (2015). Deep activity recognition mo-
dels with triaxial accelerometers. arXiv:1511.04664.
Baglioni, C., Battagliese, G., Feige, B., Spiegelhalder, K.,
Nissen, C., Voderholzer, U., Lombardo, C., and Rie-
mann, D. (2011). Insomnia as a predictor of depres-
sion: A meta-analytic evaluation of longitudinal epi-
demiological studies. Journal of Affective Disorders,
135(1–3):10–19.
Behar, J., Roebuck, A., Domingos, J. S., Gederi, E., and
Clifford, G. D. (2013). A review of current sleep
screening applications for smartphones. Physiologi-
cal measurement, 34(7):R29.
Bengio, Y., Courville, A. C., and Vincent, P. (2012). Unsu-
pervised feature learning and deep learning: A review
and new perspectives. CoRR, abs/1206.5538.
Borazio, M., Berlin, E., Kckyildiz, N., Scholl, P., and Laer-
hoven, K. V. (2014). Towards benchmarked sleep de-
tection with wrist-worn sensing units. In 2014 IEEE
Int. Conf. on Healthcare Informatics, pages 125–134.
Buschmann, F., Meunier, R., Rohnert, H., Sommerlad, P.,
and Stal, M. (2013). Pattern-Oriented Software Ar-
chitecture. A System of Patterns. Wiley.
Carreira-Perpinan, M. A. and Hinton, G. E. (2005). On
contrastive divergence learning. Artificial Intelligence
and Statistics, 2005.
Gu, W., Yang, Z., Shangguan, L., Sun, W., Jin, K., and Liu,
Y. (2014). Intelligent sleep stage mining service with
smartphones. In Proc. ACM Int. Joint Conf. on Perva-
sive and Ubiquitous Computing, pages 649–660.
ICT4AWE 2017 - 3rd International Conference on Information and Communication Technologies for Ageing Well and e-Health
178

Herrera, L. J., Fernandes, C. M., Mora, A. M., Migo-
tina, D., Largo, R., Guill
´
en, A., and Rosa, A. C.
(2013). Combination of heterogeneous EEG feature
extraction methods and stacked sequential learning for
sleep stage classification. International Journal of
Neural Systems, 23(03):1350012.
Hinton, G. E. (2002). Training products of experts by mini-
mizing contrastive divergence. Neural Computation,
14(8):1771–1800.
Hinton, G. E. (2012). A practical guide to training Re-
stricted Boltzmann Machines. In Montavon, G., Orr,
G. B., and M
¨
uller, K.-R., editors, Neural networks:
tricks of the trade, pages 599–619. Springer.
Hossain, J. L. and Shapiro, C. M. (2002). The prevalence,
cost implications, and management of sleep disorders:
an overview. Sleep and Breathing, 6(02):085–102.
Keyvanrad, M. A. and Homayounpour, M. M. (2014). A
brief survey on deep belief networks and introducing
a new object oriented toolbox (DeeBNet). Technical
Report, Laboratory for Intelligent Multimedia Proces-
sing, Computer Engineering and Information Techno-
logy Department, Amirkabir University of Techno-
logy, Tehran, Iran.
Kolla, B. P., Mansukhani, S., and Mansukhani, M. P. (2016).
Consumer sleep tracking devices: a review of mecha-
nisms, validity and utility. Expert Review of Medical
Devices, 13(5):497–506.
Kurihara, Y. and Watanabe, K. (2012). Sleep-stage decision
algorithm by using heartbeat and body-movement sig-
nals. IEEE Transactions on Systems, Man, and Cyber-
netics – Part A: Systems and Humans, 42(6):1450–
1459.
Kwapisz, J. R., Weiss, G. M., and Moore, S. A. (2011).
Activity recognition using cell phone accelerometers.
SIGKDD Explorations Newsletter, 12(2):74–82.
L
¨
angkvist, M., Karlsson, L., and Loutfi, A. (2012).
Sleep stage classification using unsupervised feature
learning. Advances in Artificial Neural Systems,
2012(3):1–9.
O’Hare, E., Flanagan, D., Penzel, T., Garcia, C., Frohberg,
D., and Heneghan, C. (2015). A comparison of radio-
frequency biomotion sensors and actigraphy versus
polysomnography for the assessment of sleep in nor-
mal subjects. Sleep and Breathing, 19(1):91–98.
Panagiotou, C., Samaras, I., Gialelis, J., Chondros, P., and
Karadimas, D. (2015). A comparative study between
SVM and fuzzy inference system for the automatic
prediction of sleep stages and the assessment of sleep
quality. In Proc. 9th Int. Conf. on Pervasive Compu-
ting Technologies for Healthcare, pages 293–296.
Panossian, L. A. and Avidan, A. Y. (2009). Review of
sleep disorders. Medical Clinics of North America,
93(2):407–425.
Radha, M., Garcia-Molina, G., Poel, M., and Tononi, G.
(2014). Comparison of feature and classifier algo-
rithms for online automatic sleep staging based on a
single EEG signal. In Proc. 36th Annual Int. Conf.
of the IEEE Engineering in Medicine and Biology So-
ciety, pages 1876–1880.
Rahman, T., Adams, A. T., Ravichandran, R. V., Zhang, M.,
Patel, S. N., Kientz, J. A., and Choudhury, T. (2015).
Dopplesleep: A contactless unobtrusive sleep sensing
system using short-range doppler radar. In Proc. ACM
Int. Joint Conf. on Pervasive and Ubiquitous Compu-
ting, pages 39–50.
Reimer, U. and Maier, E. (2016). An application framework
for personalised and adaptive behavioural change sup-
port systems. In Proc. 2nd Int. Conf. on Information
and Communication Technologies for Ageing Well and
e-Health (ICT4AWE).
Reimer, U., Maier, E., Laurenzi, E., and Ulmer, T. (2017).
Mobile stress recognition and relaxation support with
SmartCoping: User adaptive interpretation of physio-
logical stress parameters. In Proc. Hawaii Int. Conf.
on System Sciences (HICSS-50).
Shi, J., Liu, X., Li, Y., Zhang, Q., Li, Y., and Ying, S.
(2015). Multi-channel EEG-based sleep stage classifi-
cation with joint collaborative representation and mul-
tiple kernel learning. Journal of Neuroscience Met-
hods, 254:94–101.
Sohm, M. (2016). Erkennung von komplexen Aktivit
¨
aten
anhand von tragbaren Sensoren. Master thesis, Uni-
versity of Applied Sciences, Vorarlberg.
Subramanian, S., Hesselbacher, S. E., Aguilar, R., and Su-
rani, S. R. (2011). The NAMES assessment: a no-
vel combined-modality screening tool for obstructive
sleep apnea. Sleep and Breathing, 15(4):819–826.
Tinguely, G., Landolt, H.-P., and Cajochen, C. (2014).
Schlafgewohnheiten, Schlafqualit
¨
at und Schlafmittel-
konsum der Schweizer Bev
¨
olkerung: Ergebnisse aus
einer neuen Umfrage bei einer repr
¨
asentativen Stich-
probe. Therapeutische Umschau, 71(11):637–646.
Recognizing Sleep Stages with Wearable Sensors in Everyday Settings
179
