
Application of Memetic Algorithms in the Search-based Product Line
Architecture Design: An Exploratory Study
Jo
˜
ao Choma Neto, Thelma E. Colanzi Lopes and Aline M. M. Miotto Amaral
State University of Maring
´
a, Maring
´
a, Paran
´
a, Brazil
Keywords:
Software Product Line, Product Line Architecture Design, Memetic Algorithm.
Abstract:
Basic design principles, feature modularization, and SPL extensibility of Product Line Architecture (PLA)
design have been optimized by multi-objective genetic algorithms. Until now, memetic algorithms have not
been used for PLA design optimization. Considering that memetic algorithms (MA) have achieved better
quality solutions than the solutions obtained by genetic algorithms (GA) and that previous study involving the
application of design patterns to PLA design optimization returned promising results, bringing the motivation
in investigating the use of MA and the Design Pattern Search Operator as local search to the referred context.
This work presents an exploratory study aimed to characterize the application of using MA in PLA design
optimization. When compared with a GA approach, the results show that MA are promising, since the obtained
solutions are slightly better than solutions found by the GA. A pattern application rate was identified in about
30 % of the solutions obtained by MA. However, the qualitative analysis showed that the existing global search
operators need to be refactored for the joint use with the MA approach.
1 INTRODUCTION
A Product Line Architecture (PLA) comprises featu-
res of a Software Product Line (SPL) (van der Linden
and Rommes, 2007), including all possible architec-
tural variations in SPL products. An SPL feature is
a system capacity that is important and visible to a
user. The PLA is one of the most important artifacts
for the SPL success and an analytical study of its de-
sign should be considered during the SPL develop-
ment (OliveiraJr et al., 2013).
The PLA design allows for predicting the quality
of an SPL even before constructing it. Therefore, it
is possible to perform a structural evaluation using
metrics. In addition to metrics, evaluation of a PLA
takes into account economic factors, complexity and
restrictions on the product, enabling the modeling of
the PLA design as a multi-objective optimization pro-
blem (Colanzi et al., 2014).
Such considerations have motivated the applica-
tion of multi-objective search algorithms (MOA) for
PLA design optimization. For doing that, it was deve-
loped the Multi-Objective Approach for Product-Line
Architecture Design (MOA4PLA) (Colanzi et al.,
2014), which aims to evaluate and optimize the PLA
design regarding basic design principles, feature mo-
dularization and SPL extensibility by MOAs.
Memetic algorithms (MA) have been used as an
option for optimization algorithm. They are compo-
sed of a genetic algorithm (GA) with local search.
The concept of search is understood as a kind of opti-
mization, so in the present text, the global search term
denotes the optimization performed in a search area
covering the entire solution space, while local search
concerns the optimization of limited solution space.
MA have allowed better quality solutions than the
solutions obtained only by using GA (Fraser et al.,
2015; Harman and McMinn, 2010). To the present
time, there is no report of using MA for optimizing
PLA designs. Although, the use of memetic appro-
ach in the context of class modelling (Smith and Si-
mons, 2013) and in other contexts (Chawla et al.,
2015; Jeya Mala et al., 2013) showed better results
compared to other global search algorithms.
In this sense, the objective of this study is to cha-
racterize the application of MA in the search-based
PLA design, through an exploratory study, in order
to start building a body of knowledge. We are inte-
rested in investigating two research questions: RQ1-
“Does memetic algorithm find better quality solutions
than the solutions obtained by the global search algo-
rithm in the context of PLA design optimization using
MOA4PLA?” and RQ2- “Which approach of local se-
arch is more effective in the referred context?”.
178
Neto, J., Colanzi, T. and Amaral, A.
Application of Memetic Algorithms in the Search-based Product Line Architecture Design: An Exploratory Study.
DOI: 10.5220/0006363201780189
In Proceedings of the 19th International Conference on Enterprise Information Systems (ICEIS 2017) - Volume 2, pages 178-189
ISBN: 978-989-758-248-6
Copyright © 2017 by SCITEPRESS – Science and Technology Publications, Lda. All rights reserved

In order to obtain evidence to answer both rese-
arch questions, the exploratory study was divided in
three experimental studies. In the first one, experi-
ments involving NSGA-II algorithm with genetic and
memetic approaches using PLA designs were perfor-
med. The memetic approach uses the Design Pattern
Mutation Operator developed in (Guizzo et al., 2014)
as local search operator. The results are quantitatively
compared in terms of quality multi-objective indica-
tors.
The second experimental study observed the be-
havior of the local search during the evolution of the
MA generations, indicating its effective application in
about 30 % of the individuals during the evolutions.
Finally, in the third experimental study, a qualitative
study was carried out to evaluate the application of the
design pattern in the PLA design solutions found and,
as a result, it found corrupted pattern applications.
In order to answer to RQ2, the first and third ex-
perimental studies involved four different versions of
the memetic algorithm based on different types of lo-
cal search. These versions are explained in Section 3.
The experimental results indicate that the version that
obtains the best results is also the one that spent less
computational cost.
This paper is organized as follows. Section 2 des-
cribes MOA4PLA and its automation tool. Section
3 shows how the memetic approach was structured
using MOA4PLA. Sections 4 and 5 address the ex-
ploratory study definition and threats to validity, re-
spectively. Section 6 presents and discusses the obtai-
ned results. Finally, Section 7 concludes the paper
and presents future work.
2 PRODUCT-LINE
ARCHITECTURE DESIGN
Multi-Objective Approach for Product-Line Architec-
ture Design (MOA4PLA) (Colanzi et al., 2014) is
composed of four main activities: (i) Construction of
the PLA Representation, (ii) Definition of the Eva-
luation Model, (iii) Multi-objective Optimization and
(iv) Transformation and Selection.
In activity (i) the PLA design is represented by a
class diagram including architectural elements, such
as: classes, attributes, methods, interfaces and com-
ponents. It describes the variabilities by means of
UML stereotypes and notes. It is encoded as a me-
tamodel instance to be manipulated by the search al-
gorithm. The activity (ii) is responsible for defining
an evaluation model consisting of the objectives to be
optimized, ie the fitness functions, chosen by the soft-
ware architect. The current evaluation model includes
objective functions to evaluate basic principles of de-
sign, feature modularization and SPL extensibility.
The present work used the CM and FM objective
functions, the same used in (Guizzo et al., 2014).
CM aims to achieve solutions with high cohesion and
low coupling, formed by the sum of some conven-
tional metrics (Wust, 2016) as presented in Equa-
tion 1, where DepIn, DepOut,CDepIn,CDepOut and
DepPack are coupling metrics, NumOps and H are
size and cohesion metrics, respectively . FM eva-
luates the feature modularization of the PLA design
being formed by metrics driven to SPL features (Nu-
nes et al., 2009) according to Equation 2.
Activity (iii) receives as input the outputs of acti-
vities (i) and (ii) and the constraints used in the op-
timization process, then at this point, multi-objective
search algorithms are used to generate as output the
set of solutions which obtained the best trade-off be-
tween the objective functions. MOA4PLA allows the
use of different multi-objective search algorithms. Fi-
nally, the activity (iv) receives the set of solutions ge-
nerated in activity (iii) and converts each one to a rea-
dable model, composed by a class diagram that inclu-
des all necessary characteristics for representation.
MOA4PLA defines specific search operators,
which are used in the optimization process (activity
iii). The six fundamental MOA4PLA mutation opera-
tors are: Move Method, Move Attribute, Add Class,
Move Operation, Add Manager Package and Feature-
Driven Operator (Colanzi et al., 2014). The latter is
an operator concerned with feature modularization.
CM(pla) =
c
∑
i=1
DepIn +
c
∑
i=1
DepOut +
cl
∑
i=1
CDepIn +
cl
∑
i=1
CDepOut +
∑
c
i=1
DepPack
c
+
∑
it f
i=1
NumOps
it f
+
1
∑
c
i=1
H
(1)
FM(pla) =
c
∑
i=1
LCC +
f
∑
i=1
CDAC +
f
∑
i=1
CDAI +
f
∑
i=1
CDAO +
f
∑
i=1
CIBC +
f
∑
i=1
IIBC +
f
∑
i=1
OOBC
(2)
In addition to these operators, the author (Guizzo
et al., 2014) proposed a mutation operator to allow the
design patterns automatic application in the search-
based PLA design, named Design Pattern Mutation
Operator. A feasibility analysis showed that three de-
sign patterns from the GoF patterns set can be au-
Application of Memetic Algorithms in the Search-based Product Line Architecture Design: An Exploratory Study
179

tomatically applied: Strategy, Bridge and Mediator.
Strategy allows to vary the algorithm independently
of its users, therefore, it encapsulates families of algo-
rithms making them interchangeable. Bridge creates
an abstraction of its implementation, allowing both to
vary independently of each other. Mediator allows a
weak coupling avoiding that the objects refer expli-
citly to each other, for this it creates an object that
encapsulates the iterations of an objects set, thus the
interactions can vary independently.
The Design Pattern Mutation Operator selects one
of these patterns at random. After, it randomly selects
a set of classes and interfaces of the PLA design. This
set is called scope. Then, if the scope is suitable for
applying the selected pattern, the classes and interfa-
ces are changed to accomplish the design pattern.
OPLA-Tool (Optimization for PLA Tool) (F
´
ederle
et al., 2015) automates the MOA4PLA application.
This tool offers support to all activities of MOA4PLA
and also to performing experiments. OPLA-Tool cur-
rent version implements the NSGA-II (Deb et al.,
2002) algorithm, which is based on GA. NSGA-II
was used in the present work.
Experimental studies carried out in (Guizzo et al.,
2014) identified evidence that the use of Design Pat-
tern Mutation Operator allows better PLA design so-
lutions than the solutions obtained using only funda-
mental operators. Thus, the next section describes an
approach for using the design pattern operator as local
search operator in a memetic algorithm.
3 MEMETIC BASED PLA DESIGN
This work proposes the use of Design Pattern Muta-
tion Operator as a local search operator in a meme-
tic approach, integrating global and local search. The
motivation for using such an operator is its empirical
satisfactory results (Guizzo et al., 2014). As happens
in other contexts, we believe that this approach can
help to produce better quality PLA design solutions
than genetic approach (Chawla et al., 2015; Fraser
et al., 2015; Jeya Mala et al., 2013; Smith and Si-
mons, 2013) because a particular design pattern app-
lied in some place of the design could improve some
properties of the solution obtained by the global se-
arch.
The global search algorithm used is NSGA-II
(Deb et al., 2002), a multi-objective variation of GA.
From an initial population of individuals (candidate
solutions), basic operators are applied to evolve the
population, generation by generation. Through the
selection operator more copies of those individuals
with the best objective function values are selected
to be parent. So the best individuals will survive in
the next population. The crossover operator combi-
nes parts of two parent solutions to create a new one.
The mutation operator randomly modifies a solution.
The offspring population created from selection, cros-
sover and mutation replaces the parent population.
The memetic algorithm is an extension of GA
where is inserted a local search during or after the glo-
bal search process (Russell and Norvig, 2003). This
structure allows the individuals of the global popula-
tion the possibility of local optimization (Fraser et al.,
2015).
Some changes were made in OPLA-Tool for sup-
porting the memetic approach. Fig 1 shows the archi-
tecture of OPLA-Tool in which was added the OPLA-
Memetic module, responsible for using the Design
Pattern Mutation Operator as local search operator.
Figure 1: OPLA-Tool Modules.
OPLA-Memetic module follows the same activi-
ties of MOA4PLA. However, the main change is that
necessarily after the application of a mutation opera-
tor, the local search operator is applied whether there
is a suitable scope for applying one of the three design
patterns implemented in the operator. The pseudo-
code following presented shows how NSGA-II was
adapted to include the local search. Two parents (p
1
and p
2
) are selected. The crossover operator obtains
two children from the parents. Children are mutated
and, then, the local search is applied over each child.
The children resulting from this process follow to a
new population.
There are different approaches to select a solu-
tion in the local search: First Improvement, Best Im-
provement and First-Best Improvement. First Impro-
vement (Russell and Norvig, 2003) consists of ap-
plying the local search operator once and this solu-
tion goes to the next generation regardless of having
better or worse quality than the current solution. Best
Improvement (Ochoa et al., 2010) goes to the current
solution neighborhood and selects the best neighbor.
First-Best Improvement is the union of the two previ-
ous search approaches.
Memetic Algorithmm - Adapted from NSGA-II
Memetic()
While EvaluationMax
ICEIS 2017 - 19th International Conference on Enterprise Information Systems
180

for s = 0 to Population.size/2 Do
p_1 = Population(s)
p_2 = Population(s+1)
children[] = Crossover(p_1,p_2)
children[1] = Mutation(children[1])
children[2] = Mutation(children[2])
children[1] = LocalSearch(children[1])
children[2] = LocalSearch(children[2])
NewPopulation = children[1]
NewPopulation = children[2]
s += 2
for end
Population = Selection(NewPopulation)
while end
Four versions of the local search were implemen-
ted to OPLA-Memetic based on the different approa-
ches aforementioned. The first and the second imple-
mented versions are based on the First Improvement
approach, with the difference that, in the second ver-
sion, the best solution from global and local solutions
is chosen. The third version uses the Best Impro-
vement approach and the fourth version uses First-
Best Improvement. The following subsections pre-
sent the MA versions implemented.
3.1 MA No Criterion of Choice
(NoChoice)
This version of MA uses the First Improvement ap-
proach. The MA applies the local search after the ap-
plication of the global search mutation operator and
the current solution proceeds to the next generation in
NSGA-II.
LocalSearch - NoChoice
localSearh(solution)
return s = operatorLocalSearch(solution)
3.2 MA Best of 2 (Bestof2)
Bestof2 local search compares the solutions obtained
in the global search and in the local search and re-
turns the best one. The following pseudo-code shows
this process. Bestof2 saves the original solution in the
sOri variable. The solution obtained after the local se-
arch application is sLoc. The two solutions sOri and
sLoc are evaluated and the best one is returned.
The theBest solution evaluation method consists
of comparing the fitness sums of the global and local
search solutions, choosing the solution that has the
lowest sum, since an optimization by minimization is
performed. A fitness sum consists on the sum of the
values obtained for CM and FM objective functions.
The theBest algorithm is presented in the sequence.
LocalSearch - Bestof2
localSearh(solution)
sOri = solution
sLoc = operatorLocalSearch(solution)
sSelect = theBest(sOri, sLoc)
return sSelect
TheBest
theBest(solution1, solution2)
for f = 0 to ObjectivesNumber do
sum1 =+ solution1.getFitness(f)
sum2 =+ solution2.getFitness(f)
end for
if (sum2 <= sum1)
return solution2
else
return solution1
3.3 MA Best of 12 (Bestof12)
The third version of MA uses the Best Improvement
approach, creating a neighborhood of solutions found
by local search and returning the best one. The MA
was executed in a quad-core processor. Three local
searches were instantiated for each core using paging
performed by the operational system, what results in
12 neighbors. theBest evaluation method is also used
to select the best solution of the neighborhood. The
Bestof12 algorithm is shown below.
LocalSearch - Bestof12
localSearh(solution)
Core0:
sLoc0 = operatorLocalSearch(solution)
sLoc1 = operatorLocalSearch(solution)
sLoc2 = operatorLocalSearch(solution)
Core1:
sLoc3 = operatorLocalSearch(solution)
sLoc4 = operatorLocalSearch(solution)
sLoc5 = operatorLocalSearch(solution)
Core2:
sLoc6 = operatorLocalSearch(solution)
sLoc7 = operatorLocalSearch(solution)
sLoc8 = operatorLocalSearch(solution)
Core3:
sLoc9 = operatorLocalSearch(solution)
sLoc10 = operatorLocalSearch(solution)
sLoc11 = operatorLocalSearch(solution)
sSelect = theBest12(sLoc0,sLoc1,sLoc2,
sLoc3,sLoc4,sLoc5,sLoc6,sLoc7,sLoc8,sLoc9,
sLoc10,sLoc11)
return (sSelect)
3.4 MA First Best Improvement
(UntilBest)
The latest version of MA works with the First Best
Improvement approach whose pseudo-code is presen-
ted below. For doing that, the algorithm repeats the
local search over the same global search solution until
achieves an improvement in the fitness sum, ie., until
finding the first improvement in the neighborhood.
Application of Memetic Algorithms in the Search-based Product Line Architecture Design: An Exploratory Study
181
The comparison between the solution found by the
global search (sOri) and the neighbor (sLoc) is perfor-
med by the method named theBestU ntil also presen-
ted below. As soon as a better solution is found, the
solution sLoc is returned. Due to the Design Pattern
Mutation Operator needs a suitable scope for applying
a design pattern, there are cases where, in spite of a
lot of attempts to improve local search, none impro-
vement happens. To prevent this problem, the number
of attempts to reach a better solution was limited to
fifteen. If there is no improvement, then the solution
found by the global search (sOri) survives in the next
generation.
LocalSearch - UntilBest
localSearch(solution)
sOri = solution
best = false
while (best == false) do
sLoc = operatorLocalSearch(solution)
best = theBestUntil(sOri, sLoc)
count++
if (count > 15)
return sOri
end while
return sLoc
TheBestUntil
theBestUntil(solution1,solution2)
for f = 0 to ObjectivesNumber do
sum1 =+ solution1.getFitness(f)
sum2 =+ solution2.getFitness(f)
end for
if (sum2 < sum1)
return true
else
return false
4 EMPIRICAL EVALUATION
DESCRIPTION
Considering the motivation presented, this section
describes the studies carried out to answer the two re-
search questions presented previously. The studies are
described below.
This work is composed by three experiments with
the objective of evaluating the performance and qua-
lity of the solutions found by the memetic appro-
ach. The first experiment (Exp 01) used the OPLA-
Tool with the following configurations: 15 runs of the
NSGA-II algorithm, with all conventional mutation
operators using 0.9 of mutation probability, without
Crossover. The population size is 100 and the number
of fitness evaluation is 30000. The number of fitness
evaluations was used as stop criterion for NSGA-II.
Four PLA designs were used in this study. Arcade
Game Maker (AGM) is an SPL that includes three
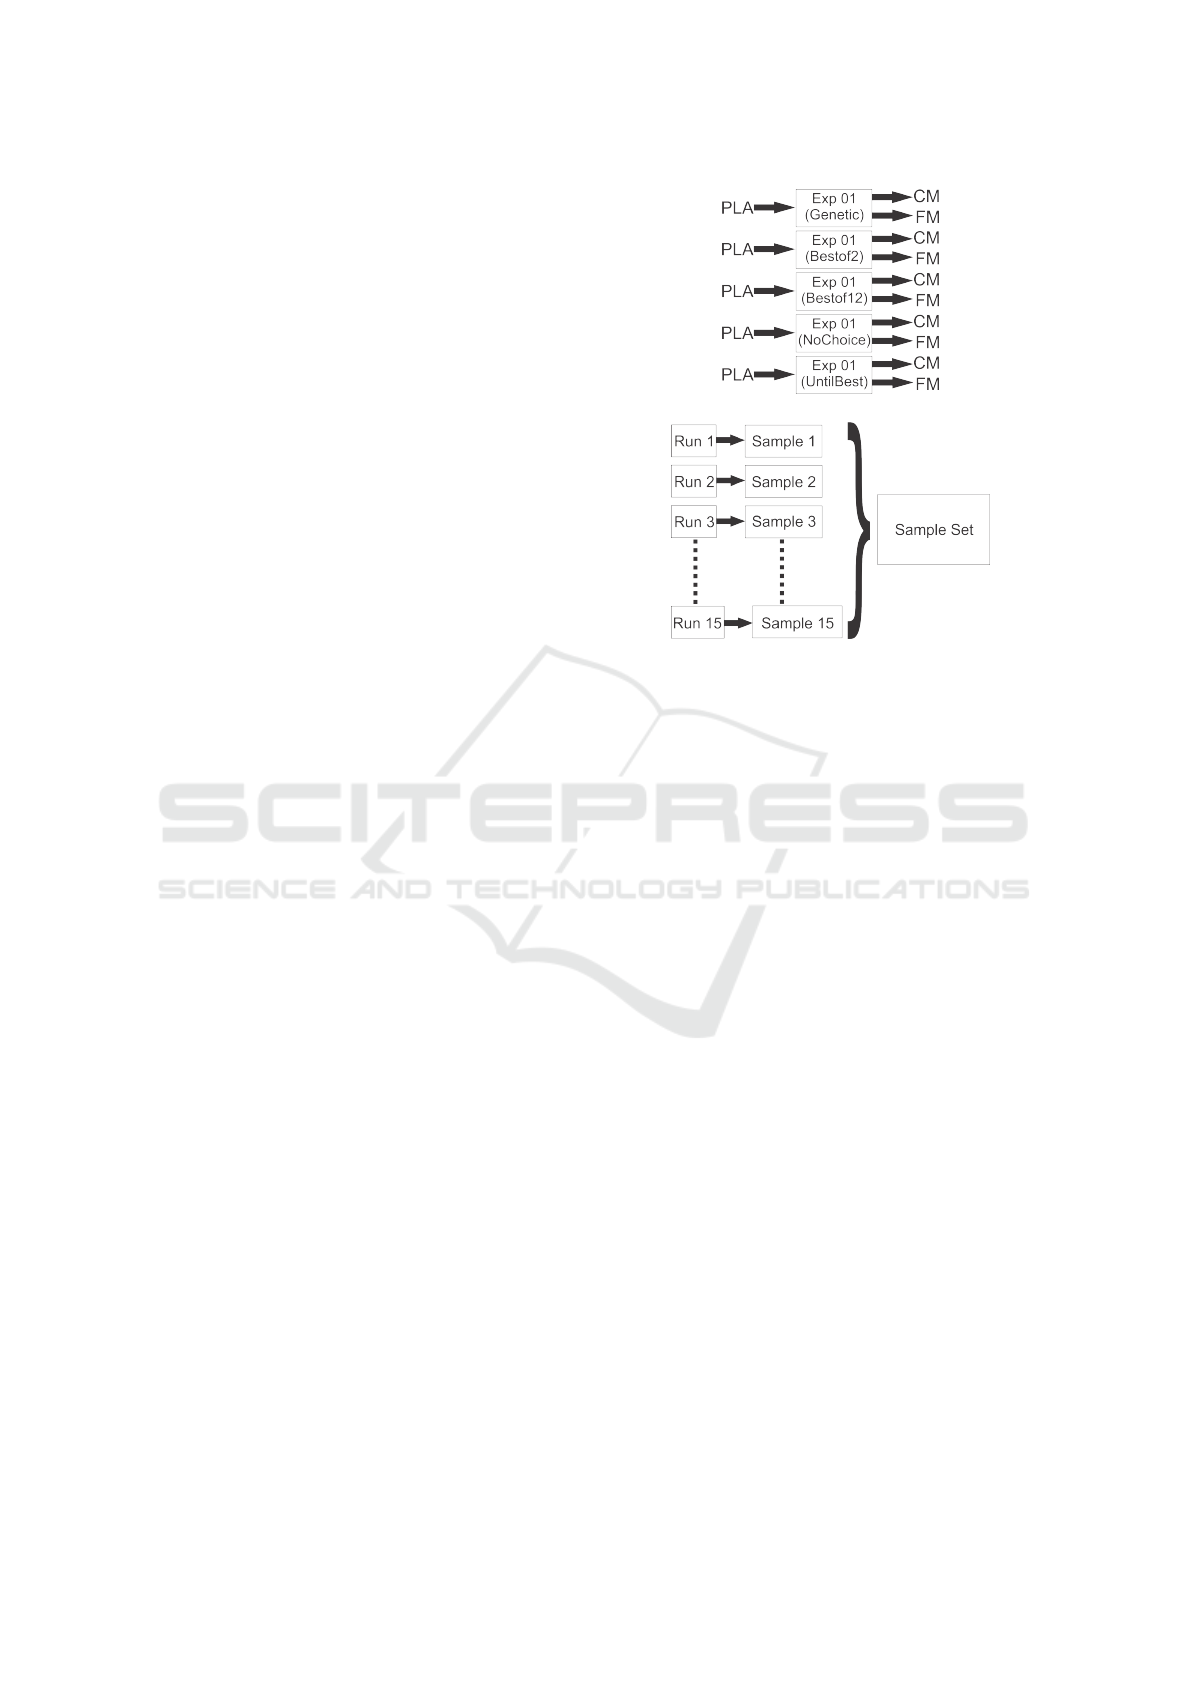
(a) Experiment Exp 01.
(b) Sample Set
Figure 2: Exp 01 and Sample Set.
games: Brickles, Bowling and Pong, developed by
SEI (SEI, 2016). Banking System (BANK) is an SPL
created by (Gomaa, 2011) for the purpose of mana-
ging banking systems. BET (Donegan and Masiero,
2007) is an SPL used to manage urban transport. And,
the last SPL used was the Mobile Media (MOM) for
media control on mobile devices (Contieri Jr et al.,
2011). Information regarding the original fitness, in
the format (CM, FM), and the quantity of architectu-
ral elements is present in Table 1.
Exp 01 was repeated for each version of the me-
metic algorithm (NoChoice, Bestof2, Bestof12 and
UntilBest) and for Genetic, as can be seen in Figure
2(a) which presents the design of the experiment. In
this figure it is possible to observe that the PLA de-
sign is one of the independent variables. The other
independent variable is the search algorithm version.
As dependent variable it was used the fitness of the
solutions in terms of the objective functions that were
selected as optimization objectives. In this case, CM
and FM functions were the objectives (mentioned in
Section 2).
Exp 01 was executed 15 times for each indepen-
dent variable, whose grouped samples form a sample
set as can be seen in Figure 2(b). Each experiment in
Figure 2(a) used the four PLAs (AGM, BANK, BET
and MOM) as an independent variable, one at a time.
Thus, there are four sample sets for each algorithm
version, each set referring to a PLA, resulting in 20
sample sets.
Those 20 sample sets were evaluated using quality
multi-objective indicators and appropriate statistical
ICEIS 2017 - 19th International Conference on Enterprise Information Systems
182
Table 1: PLAs Information.
PLA
Original Fitness (CM, FM)
# Components # Interfaces # Classes # Features # Variabities
AGM (89.14, 758.0) 9 14 30 11 5
BANK (157.0, 326.0) 4 5 25 16 3
MOM (72.14, 1122.0) 8 15 14 14 7
BET (461.02, 1486.0) 56 30 115 18 8
analysis, as suggested in (Ferrucci et al., 2013). Five
quality indicators were chosen: Hypervolume (HV)
(Zitzler et al., 2001), Generational Distance (GD)
(Van Veldhuizen and Lamont, 1998), Inverse Genera-
tional Distance (IGD) (Radziukynien
˙
e and
ˇ
Zilinskas,
2008). Error Ratio (Van Veldhuizen, 1999) and Euc-
lidean Distance from an ideal solution (ED) (Zeleny
and Cochrane, 1973).
Some of these quality indicators need the Pareto
Front True (PF
True
), however, in real problems PF
True
is not known. In these cases, it is common to use
the non-dominated solutions found by all algorithms
in all runs (Yoo and Harman, 2007; Zitzler et al.,
2003). The approximation to the Pareto front is called
PF
known
. Each PF
known
is formed only by the non-
dominated solutions obtained by an algorithm ver-
sion.
The most accepted indicator for performance as-
sessment of multi-objective algorithms is Hypervo-
lume (HV) (Zitzler et al., 2001). Comparing two
PF
approx
sets: whenever one PF
approx
completely do-
minates another PF
approx
, the HV of the former will
be greater than the HV of the latter. The HV indica-
tor calculates the volume in the region enclosed from
PF
approx
to a reference point. A reference point is a
point dominated by the solutions of all sets PF
approx
found. The higher the HV value, the better coverage
and the diversity of the solutions set achieved.
The GD indicator (Van Veldhuizen and Lamont,
1998) is used to calculate the distance from an ap-
proximation of the Pareto Front found by the algo-
rithm (PF
known
) to PF
True
. So, GD is an error measure
used to examine the convergence of an algorithm to
PF
True
. IGD (Radziukynien
˙
e and
ˇ
Zilinskas, 2008) is
an indicator based on GD, but with the goal of eva-
luating the distance from PF
True
to PF
known
, i.e., the
inverse of GD.
Error ratio (Van Veldhuizen, 1999) is an error me-
asure to report a finite number of members in PF
Known
which are not members of PF
true
. If they are not mem-
bers of PF
true
the algorithm has erred or perhaps not
converged. Low values of error ratio are better be-
cause the lower the error ratio value, the higher the
number of solutions of PF
Known
that are members of
PF
true
.
The last indicator, Euclidean Distance from the
Ideal Solution (ED), is not a quality indicator, instead,
it is used as a measure to help the decision maker in
his/her final decision, i.e., from all solutions provi-
ded which one should be selected. ED is used to find
the closest solution to the best objectives. An ideal
solution has the minimum value of each objective,
considering a minimization problem (Zeleny and Co-
chrane, 1973). These minimum values are obtained
from PF
true
solutions. Thus, the solution with the lo-
west ED has the best trade-off between the objectives.
The Shapiro Wilk test was used to ascertain whet-
her sample sets are normally distributed. Subse-
quently, the Friedman Test was used to ascertain
whether there was statistical difference between the
samples. The two statistical tests were applied with
95 % of confidence (p − value < 0.05).
The second experiment (Exp 02) was realized with
the purpose of observing the behavior of the applica-
tion of design patterns, carried out by the local search,
during the evolution of MA generations. Exp 02 used
the NoChoice version. A single round of the algo-
rithm was performed. The difference is that 10000
fitness evaluations were performed for PLA MOM.
Each of the 10000 evaluated solutions was stored, in
order to verify the presence of design patterns and
thus, to measure the application rate during the ge-
nerations evolution.
Third experiment, called Exp 03, aimed qualitati-
vely evaluating solutions found by all versions of MA
in Exp 01, in order to identify possible design incon-
sistencies and parts of the design that are suitable to
apply design patterns. The solutions considered for
this study were those that presented some pattern ap-
plied in the PLA design or with the lowest ED for
each algorithm version.
5 THREATS TO VALIDITY
This section presents the threats to validity considered
in the experiments carried out. The size and diversity
of PLAs used in the experiments is a threat because
only 4 PLAs were used (only 1 is a real SPL). Ho-
wever, it is difficult to obtain PLA designs available
as the level of detail required to conduct experiments.
On regards to diversity, PLA designs have different
sizes and are from different domains minimizing this
risk.
Application of Memetic Algorithms in the Search-based Product Line Architecture Design: An Exploratory Study
183

The algorithms are non-deterministic. To mitigate
this threat, we performed 15 runs for each experiment.
We also used quality indicators, generally used in the
multi-objective optimization literature. The adoption
of the same population size, the same number of ge-
nerations independently of the PLA size and the fit-
ness functions CM and FM are other threats. Different
configurations of algorithms parameters could imply
in different, possibly better, results. We are aware that
we should perform other studies involving different
PLA designs and different parameters tuning.
6 EMPIRICAL EVALUATION
RESULTS AND ANALYSIS
In this section the results obtained in the exploratory
study (composed by the three experiments) are pre-
sented. In addition to discussing the results, the rese-
arch questions are answered at the end of the section
1
.
6.1 Exp 01
Table 2 shows the amount of solutions which compo-
ses the PF
true
of the Exp 01 as well as the cardinality
of the PF
known
obtained by the algorithms. This ta-
ble also presents the Error Ratio of each algorithm.
The PF
known
and the Error Ratio are indicated as PF
k
and ER, respectively. The lowest Error Ratio value
is highlighted in bold. The data of this table indica-
ted that the memetic approach, with the Bestof2 algo-
rithm, found a greater diversity of solutions, since it
cover a larger area in the space of solutions, presen-
ting lower Error Ratio in three of the four PLAs used.
The Genetic algorithm version produced identical
fitness values in all rounds for PLA BANK. The fit-
ness is CM = 141.5 and FM = 294. Comparing with
the original fitness value (CM = 157.0 and FM = 326.0
- Table 1) the optimization is clear. However, the ver-
sion of the Bestof2 memetic algorithm found a solu-
tion that overcomes Genetic with fitness CM = 141.5
and FM = 145, indicating that the solution found by
Genetic is not optimal.
Table 3 presents the PLA design solution optimi-
zation time in milliseconds. It was expected that the
runtime of the memetic algorithm versions would ex-
ceed the Genetic algorithm runtime. However, when
executing the versions of Bestof12 and UntilBest ver-
sions for PLA BET (the largest PLA), it was observed
1
The experimental package, encompassing
PLA designs, quality indicator data, statistical
data and the obtained solutions are available at
https://github.com/Oplamemetic/experimentalpackage/
that finishing its executions is impracticable. To per-
form 30000 evaluations the Bestof12 algorithm would
take approximately 10.7 days per round, for 15 rounds
161.5 days, and Untilbest algorithm would take about
22.6 days per round, for 15 rounds would be spent
339.7 days. For this reason, only the samples found in
the Genetic, Bestof2 and NoChoice experiments were
used for PLA BET.
The Hypervolume quality indicator was applied to
the standard samples of Exp 01 involving the Gene-
tic, Bestof2, Bestof12, NoChoice and UntilBest al-
gorithm versions. Table 4 presents the HV indica-
tor average for each algorithm version. The highest
average, by PLA, were highlighted in bold, since they
represent the version of the algorithm that obtained
the best yield. The Bestof2 and Bestof12 versions
found better HV averages in all the PLAs used.
Shapiro Wilk statistical test pointed out that the
data have a non-normal distribution. The only ex-
ception is for the Genetic version sample using PLA
BET, whose distribution is normal. Thus, Friedman’s
nonparametric test was applied to verify the statistical
difference between the versions of the algorithms for
HV, GD and IGD quality indicators.
As can be observed (last column of Table 4), with
95% of confidence, there is statistical difference bet-
ween the algorithms for BANK and BET. In this case,
the Bestof12 and Bestof2 version of the memetic al-
gorithm obtained the best performance, respectively.
The last column of Table 5 presents the fitness of
the ideal solution of each PLA. This fitness was obtai-
ned from the PF
true
of each PLA design used in the
study. The other columns of the table present the ED
of the solution closest to the ideal solution obtained
by the algorithms versions. The lowest ED of each
PLA is highlighted in bold. For this indicator, the Be-
stof2 version stood out getting better values in all four
PLAs, and the NoChoice version broke even with Be-
stof2 in the AGM and BET PLAs. With these results,
the Bestof2 version presented the best performance.
Friedman’s test showed statistical difference for
AGM (p-value = 0.003453), BANK (p-value =
0.03837) and BET (p-value = 0.0366) PLAs. In these
three cases, the versions with best performance were:
Bestof2 and Bestof12, respectively. In general, it can
be stated that the memetic approach equaled or over-
came the solutions found by the genetic approach.
The average of the GD quality indicator is presen-
ted in Table 6 and the last column shown the p-values
obtained by the Friedman test. In this table, it is pos-
sible to identify that the Bestof2 version was better in
AGM and BET PLAs, and the Bestof12 in BANK and
MOM PLAs. However, only BANK and BET PLAs
presented p-value < 0.05, with statistical difference,
ICEIS 2017 - 19th International Conference on Enterprise Information Systems
184
Table 2: Number of non-dominated solutions by algorithm.
PLA #PF
true
Genetic Bestof2 Bestof12 NoChoice UntilBest
#PF
k
ER #PF
k
ER #PF
k
ER #PF
k
ER #PF
k
ER
AGM 16 12 0.82 12 0.18 6 0.80 10 0.67 16 1
BANK 3 1 1 3 0 4 0,5 3 1 5 1
MOM 12 7 0.42 8 0.62 4 0.75 5 0.6 6 0.66
BET 13 13 0.69 10 0.2 — — 6 0.75 — —
Table 3: Solution optimization time in milliseconds.
PLA Bestof2 Bestof12 NoChoice UntilBest
AGM 161.9 999.5 124.4 1,651.5
BANK 65.3 244.8 34.6 412.0
MOM 197.5 836.4 98.6 1,889.9
BET 2,468.06 31,023.8 2,670 65,223.2
Table 4: Average values of HV.
PLA Genetic Bestof2 Bestof12 NoChoice UntilBest p-value
AGM 0.200845 0.227553 0.213305 0.209683 0.220646 0.28025
BANK 0.108785 0.271241 0.316004 0.195562 0.185855 1.29E-09
MOM 0.425223 0.437447 0.447239 0.382441 0.358863 0.428092
BET 0.223165 0.245368 — 0.162444 — 0.001273
Table 5: The best ED by Experiment.
PLA Genetic Bestof2 Bestof12 NoChoice UntilBest
Fitness of the
Ideal Solution
AGM 268.312601 51.0 130.146071 51.0 57.428216 (30.14, 256.0)
BANK 149.656272 14.0 36.619666 54.083269 36.619666 (127.5, 145.0)
MOM 36.124029 25.316541 42.106359 37.0 36.674241 (45.1, 795.0)
BET 762.0 162.000425 — 162.000425 — (276.02, 611.0)
where the Bestof2 version surpassed the Genetic one.
The average of IGD quality indicator is presented
in the Table 7 and the p-values obtained by the Fried-
man test are shown in the last column. The Bestof2
version obtained better results in BET, the Bestof12
version in BANK and MOM PLAs, and the UntilBest
version in AGM. As in the GD indicator, only BANK
and BET PLAs presented p-value < 0.05 indicating
statistical difference, where the Bestof2 version sur-
passed the Genetic one.
The results of Exp 01 show that the memetic ap-
proach achieved slightly better fitness solutions than
the genetic approach, but in the context of this study
the memetic approach is not statistically better than
genetic in all cases. One point observed in meme-
tic approach is that it can find a larger number of so-
lutions in PF
true
, which suggests that it explores the
solutions space more extensively than the genetic al-
gorithm.
There are indications that the PLA design provi-
ded as input may influence the performance of the lo-
cal search, because the greater number of suitable re-
gions to apply design patterns, the greater the chance
of local search to optimize the PLA. By analyzing the
PF
Knowns
of Exp 01 in Genetic, Bestof2, Bestof12,
NoChoice and UntilBest versions, no occurrences of
patterns were found in any of the non-dominated solu-
tions. This led to another study to investigate whether
design patterns were being applied during the opti-
mization process and the rate of pattern application.
Results of this study are presented in the next section.
6.2 Exp 02
As mentioned in Section 4, Exp 02 analyzed the rate
of application of design patterns in the solutions that
comprises each population of 100 generations. The
graphs of Figures 3 and 4 show the number of soluti-
ons that contained each design pattern, a combination
of them, or no applied pattern (due to space limitation
only the first and the last generations are presented).
Each design pattern, its combination or non-pattern
application was represented by a number, as follows:
(1) Strategy, (2) Bridge, (3) Mediator, (4) Mediator
and Strategy, (5) Strategy and Bridge , (6) Mediator,
Bridge and (7) No pattern applied. No solution con-
tained the three design patterns applied.
Analyzing Figure 3 it can be observed that the ap-
plication of patterns is more present in 40% of the
solutions in the 35 first generations. However, with
the generations evolution, the rate of patterns applica-
tion is steadily decreasing to the stage that (Figure 4)
approximately 2/3 of the solutions have no pattern.
Although at least 30% of the solutions have app-
Application of Memetic Algorithms in the Search-based Product Line Architecture Design: An Exploratory Study
185
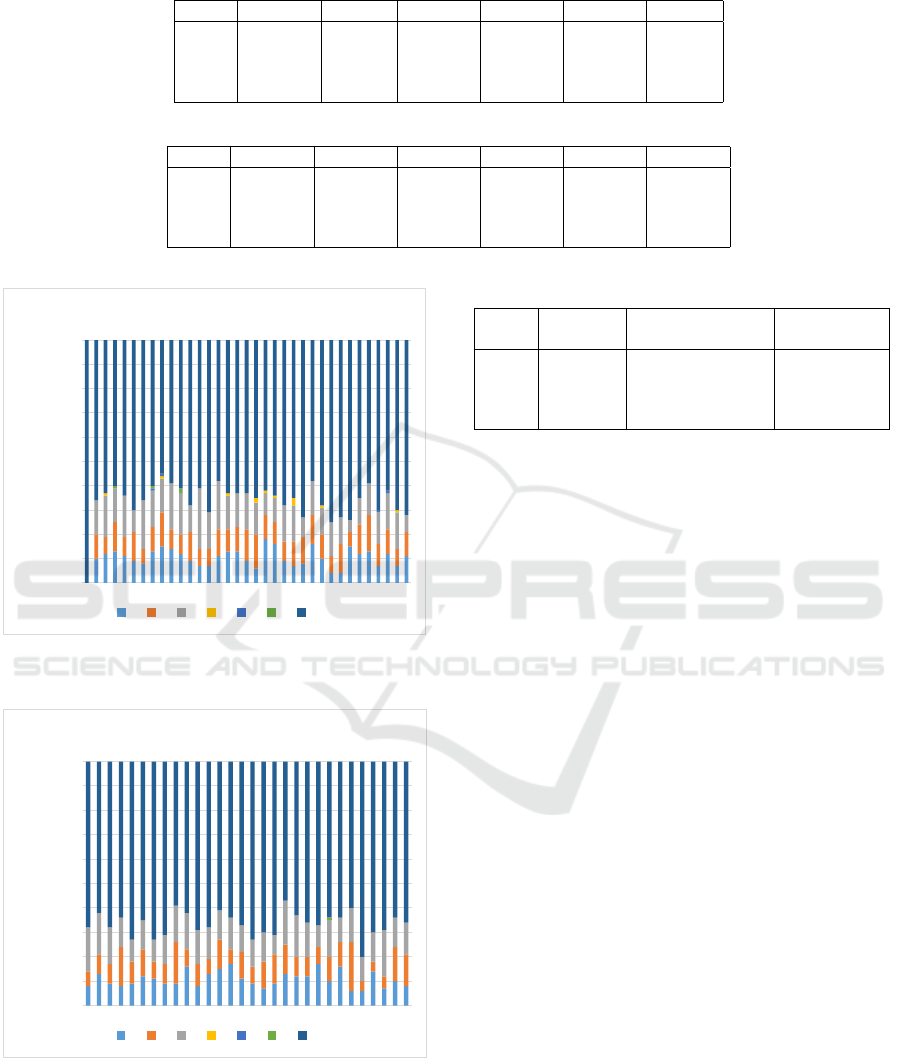
Table 6: Average values of GD.
PLA Genetic Bestof2 Bestof12 NoChoice UntilBest p-value
AGM 8.262073 7.328262 11.001264 7.574039 7.869226 0.5872
BANK 19.104973 7.840005 6.289115 17.577093 15.126942 0.000042
MOM 11.568652 9.484651 9.023561 10.802115 10.253804 0.7113
BET 10.307010 7.025358 — 21.678729 — 0.003698
Table 7: Average values of IGD.
PLA Genetic Bestof2 Bestof12 NoChoice UntilBest p-value
AGM 20.675618 19.455419 20.163540 19.708956 18.790651 0.2548
BANK 50.718176 43.639684 39.874537 44.345701 48.206297 0.0000036
MOM 3.781270 4.122948 3.724295 4.188424 4.171765 0.297
BET 53.477759 48.773528 — 59.169005 — 0.007699
0
10
20
30
40
50
60
70
80
90
100
Solutions
Generations 1-35
1 2 3 4 5 6 7
Figure 3: Number of solutions with patterns - 1 to 35 gene-
rations.
0
10
20
30
40
50
60
70
80
90
100
Solutions
Generations 71-100
1 2 3 4 5 6 7
Figure 4: Number of solutions with patterns - 71 to 100
generations.
lied patterns, some have not survived over the genera-
tions, since the percentage of application decreases as
the process progresses. Still, the surviving solutions
are dominated by others and therefore are not part of
Table 8: Patterns Application Rate.
PLA
Number of
Solutions
Number of Solutions
with Patterns
Application
Percentage (%)
AGM 298 6 2.01
BANK 140 71 50.71
MOM 225 13 5.77
BET 202 96 47.52
the PF
Knowns
.
A qualitative study (Exp 03) was developed in or-
der to understand the reasons that lead the discard of
solutions with pattern application over the generati-
ons, and why the solutions with pattern application
were dominated.
6.3 Exp 03
Exp 03 focuses on the PLA solutions found in meme-
tic algorithm versions of Exp 01 (Bestof2, Bestof12,
NoChoice and UntilBest) analyzing points where pat-
terns were applied as well as possible inconsistencies
in the patterns application. Initially, the solutions with
the lowest EDs of each algorithm version were analy-
zed. Considering the analyzed solutions, only the so-
lution obtained by the NoChoice version for the PLA
MOM had the Strategy design applied. All other so-
lutions had no pattern.
Based on this fact, the rate of patterns application
in all runs of the algorithm versions was investigated.
Table 8 shows the total number of solutions obtained
for each PLA in all runs of the algorithms versions in
Exp 01. The third column of the table shows the num-
ber of solutions that had at least one applied pattern,
and the fourth column shows the pattern application
percentage. It is noticed an incidence of patterns ap-
plication in around 50% in the solutions obtained by
the algorithms versions in BANK and BET PLAs, and
percentages lower than 6% in the other two PLAs (see
Table 8).
An analysis of the PLAs AGM and MOM, that
have the lowest percentage of pattern application,
ICEIS 2017 - 19th International Conference on Enterprise Information Systems
186
shows that they have at least 1 and at most 3 regions
suitable to patterns application. Original designs and
solutions that form the PF
Known
of each algorithm ver-
sion were analyzed. However, as local search rand-
omly selects the set of classes and interfaces that will
have its application scope analyzed, there is no gua-
rantee that the algorithm will specifically find the suit-
able scope to the design pattern application.
For BANK and BET, which had the highest rates
of pattern application, some solutions that have pat-
tern were randomly selected because the solutions of
PF
Known
did not contain patterns. BANK solutions
contained only the Strategy pattern, and BET soluti-
ons presented the Strategy and Mediator patterns.
Analyzing MOM solution obtained by NoChoice
version containing the Strategy pattern in BET and
BANK solutions, it was detected that there is in-
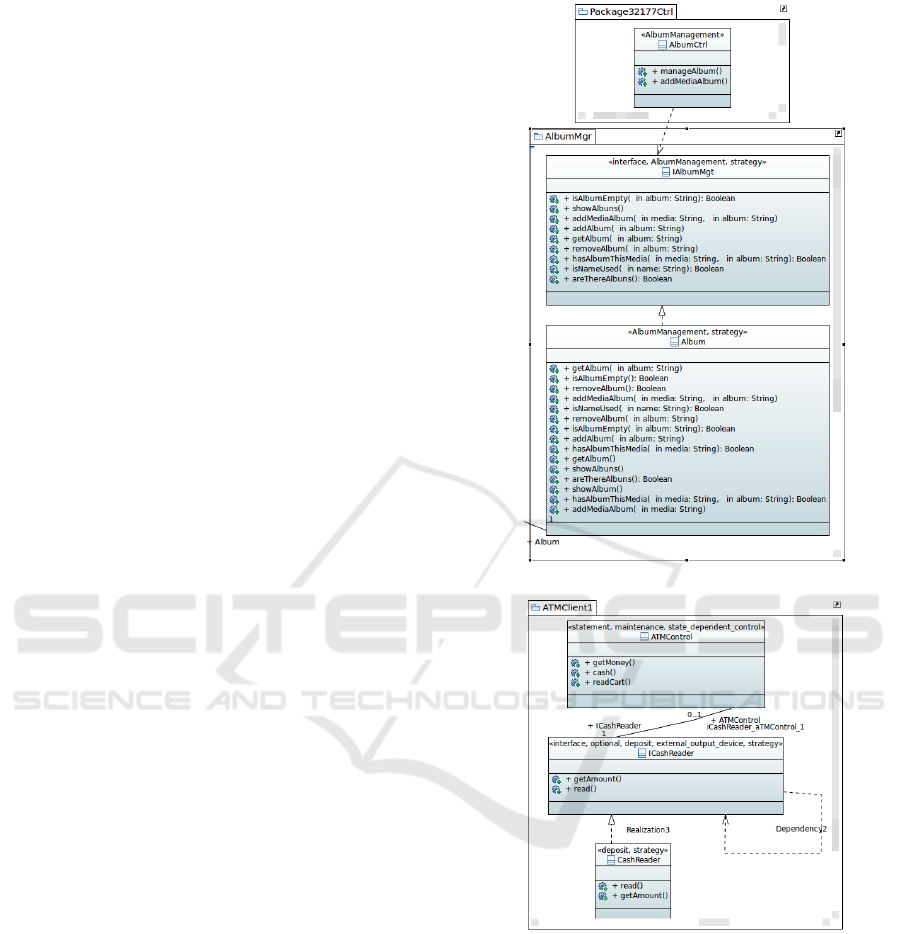
consistency in pattern application. An excerpt of
the MOM solution obtained by NoChoice version is
shown in Figure 5(a). In this solution, the applica-
tion of the Strategy pattern appears in two classes.
IAlbumMgt interface represents the Strategy inter-
face, and Album class is a member of the algorithm
family that implements the Strategy Interface. Besi-
des, AlbumCtrl class has a dependency relationship
with the Strategy Interface. Although the applica-
tion presents all the architectural artifacts necessary
for the Strategy pattern, the algorithm family contains
one member, unlike the behavior of the local search
operator that only applies Strategy if there are at least
two members to characterize a family. Thus, it is pos-
sible to conclude that the application of the pattern is
corrupted.
Figure 5(b) presents two architectural elements in
which Strategy is applied in a BANK solution (Be-
stof2 version). The ICashReader Interface repre-
sents the Strategy Interface and the CashReader class
represents the algorithm family that implements the
Strategy Interface. However, the algorithm family
does not have at least two members, the ATMCont-
rol class has no dependency relationship with the In-
terface, and the dependency self-relationship in the
ICashReader interface represents inconsistencies for
this pattern.
In all analyzed solutions it was possible to identify
that the applied design pattern is incomplete. The va-
lidation tests of the operator’s implementation in the
context of local search did not detected such a bug
probably because the tests was executed lower num-
ber of generations than the experiment. Our hypothe-
sis is that inconsistencies are caused by modifications
made by global search operators that corrupt the pat-
tern over the generations, because they have not been
prepared to do not change design-pattern regions.
(a) Exp 01 NoChoice MOM.
(b) Exp 01 Bestof2 BANK.
Figure 5: Solutions Excerpts with Incomplete Applied De-
sign Patterns.
As results presented in study Exp 02 it is under-
stood that during the generations, there are indivi-
duals that have some scope of pattern application,
in about 30%. Nevertheless, global search operators
causes changes in the application of design patterns,
creating damage to the structure of the PLA (pro-
ducing an incomplete design pattern), which conse-
quently undermines the fitness values of the objective
functions what causes the elimination of the solution
during the search process.
Application of Memetic Algorithms in the Search-based Product Line Architecture Design: An Exploratory Study
187
6.4 Answering the Research Questions
The research questions presented in this paper are
answered in this section. The answer to RQ1-“Does
memetic algorithm find better quality solutions than
the solutions obtained by the global search algo-
rithm in the context of PLA design optimization using
MOA4PLA?” is that in Exp 01, there was no signifi-
cant decrease in the solutions fitness of memetic ap-
proach, however, there is a slight improvement. This
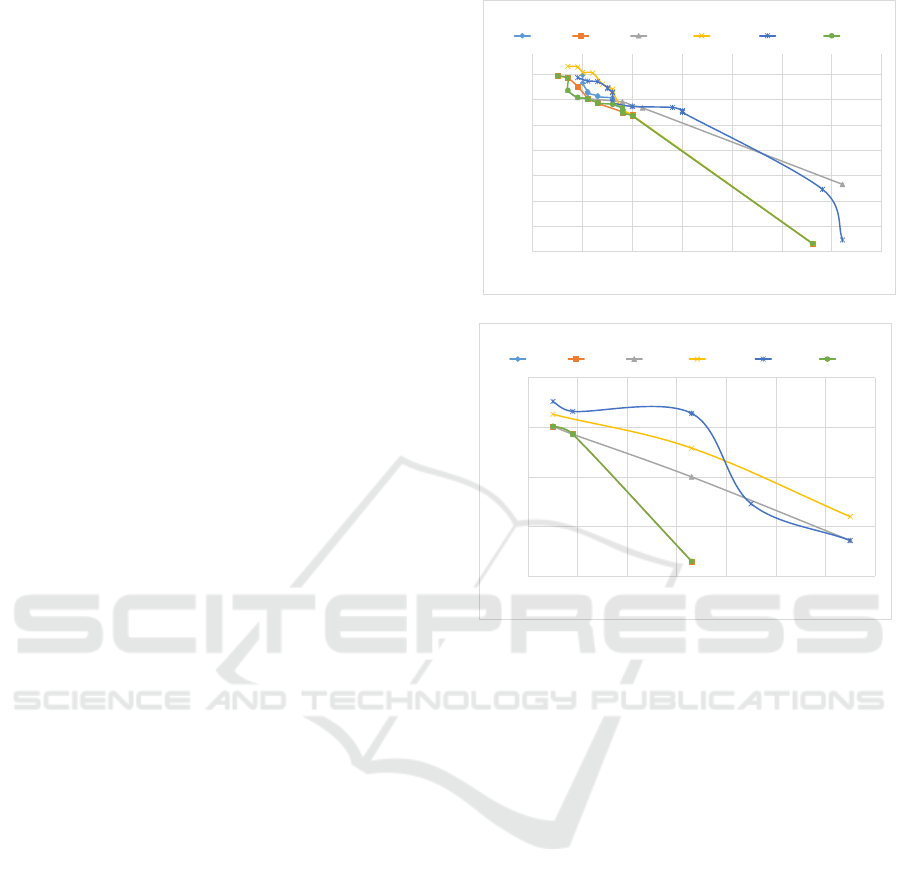
can be seen in Figures 6(a) and 6(b) which show
the PF
true
and PF
knowns
of each algorithm version for
AGM and BANK. It is possible to see that PF
knowns
are similar, but the front achieved by Bestof2 version
is nearer to PF
true
than the other fronts, confirming
the quality indicators results.
It is also noticed that the memetic approach obtai-
ned greater diversity of solutions exploring the soluti-
ons space in a different way. Studies Exp 02 and Exp
03 have provided clues that global search mutation
operators may be harming the results of the memetic
approach.
Based on this evidence, the hypothesis that the
memetic algorithm is able to find solutions of better
quality than the genetic algorithm in the context of
search-based PLA design can be maintained. To in-
vestigate this hypothesis, it is necessary to refine the
global search operators and repeat the experiments.
RQ2 is about “Which kind of local search is more
effective in the referred context?”. To answer this
question an analysis was performed on the results
found in the quality indicators of Exp 01. This ana-
lysis counted how many times each algorithm version
had the best performance in the five quality indicators.
Bestof2 version presented better results (with 12 best
performance), the Bestof12 version (with 6 best per-
formance) came in second and the other algorithms
have the best best at most 1 time.
Thus, local search using First Improvement appro-
ach which maintains, in the next generation, the best
solution among the solutions achieved by global and
local search was more effective in the context of PLA
design optimization.
7 CONCLUDING REMARKS
This work presented an exploratory study, subdivided
into three experimental studies, aiming to characterize
the application of memetic algorithms in the search-
based PLA design. The memetic approach found gre-
ater diversity of solutions showing that it is able to
explore the solutions space differently from the gene-
tic approach. A memetic algorithm version obtained
240
290
340
390
440
490
540
590
25 35 45 55 65 75 85 95
CM
FM
AG M
Genetic Bestof2 Bestof12 NoChoice UntilBest PFtrue
(a) PF
true
AGM
130
180
230
280
330
125 130 135 140 145 150 155 160
CM
FM
BA N K
Genetic Bestof2 Bestof12 NoChoice UntilBest PFtrue
(b) PF
true
BANK
Figure 6: PF
true
AGM and PF
true
BANK.
the best results in several cases, despite of it was not
statistically better than genetic.
In addition, patterns have been substantially app-
lied, although the solutions with patterns do not ap-
pear among the non-dominated solutions returned by
the algorithms. In one of the experiments, a proba-
ble cause was: the global search mutation operators
modify the architectural elements that contain applied
design patterns since there are no restrictions imple-
mented to prevent this.
A work in progress consists of implementing these
constraints on mutation operators to inhibit the altera-
tion of architectural elements presenting design pat-
terns and the repetition of all experiments. As future
work, we intend to use other objective functions di-
rectly related to the changes caused by the design pat-
terns in the optimized PLAs. There is also a need
for a qualitative study to evaluate the solutions found
by genetic and memetic approaches from the point of
view of software architects.
ICEIS 2017 - 19th International Conference on Enterprise Information Systems
188

ACKNOWLEDGEMENTS
The authors thank to CNPq and CAPES for financial
support.
REFERENCES
Chawla, P., Chana, I., and Rana, A. (2015). A novel strategy
for automatic test data generation using soft compu-
ting technique. Frontiers of Comp.Science, 9(3):346–
363.
Colanzi, T. E., Vergilio, S. R., Gimenes, I. M. S., and Oi-
zumi, W. N. (2014). A search-based approach for soft-
ware product line design. In Proc. of SPLC 2014.
Contieri Jr, A. C., Correia, G. G., Colanzi, T. E., Gimenes,
I. M., Oliveira Jr, E. A., Ferrari, S., Masiero, P. C., and
Garcia, A. F. (2011). Extending uml components to
develop software product-line architectures: lessons
learned. In European Conference on Software Archi-
tecture, pages 130–138. Springer.
Deb, K., Pratap, A., Agarwal, S., and Meyarivan, T. (2002).
A fast and elitist multiobjective genetic algorithm:
NSGA-II. IEEE Trans. Evol. Comput., 6(2):182–197.
Donegan, P. M. and Masiero, P. C. (2007). Design is-
sues in a component-based software product line. In
SBCARS, pages 3–16.
F
´
ederle, E. L., Ferreira, T. N., Colanzi, T. E., and Vergilio,
S. R. (2015). OPLA-Tool: A support tool for search-
based product line architecture design. In Proc. of
the 19th International Conference on Software Pro-
duct Line, SPLC ’15, pages 370–373.
Ferrucci, F., Harman, M., Ren, J., and Sarro, F. (2013). Not
going to take this anymore: Multi-objective overtime
planning for Software Engineering projects. Procee-
dings - International Conference on Software Engi-
neering, pages 462–471.
Fraser, G., Arcuri, A., and McMinn, P. (2015). A memetic
algorithm for whole test suite generation. Journal of
Systems and Software, 103:311–327.
Gomaa, H. (2011). Software modeling and design: UML,
use cases, patterns, and software architectures. Cam-
bridge University Press.
Guizzo, G., Colanzi, T., and Vergilio, S. (2014). A pattern-
driven mutation operator for search-based product line
architecture design. In Proc. of SSBSE, pages 77–91.
Harman, M. and McMinn, P. (2010). A theoretical and em-
pirical study of search-based testing: Local, global,
and hybrid search. IEEE Trans. Soft. Eng., 36(2):226–
247.
Jeya Mala, D., Sabari Nathan, K., and Balamurugan, S.
(2013). Critical components testing using hybrid ge-
netic algorithm. SIGSOFT Softw.Eng.Notes, 38(5):1–
13.
Nunes, C., Kulesza, U., Sant’Anna, C., Nunes, I., Garcia,
A., and Lucena, C. (2009). Assessment of the design
modularity and stability of multi-agent system pro-
duct lines. Journal of Universal Computer Science,
15(11):2254–2283.
Ochoa, G., Verel, S., and Tomassini, M. (2010). First-
improvement vs. best-improvement local optima net-
works of nk landscapes. In International Conference
on Parallel Problem Solving from Nature, pages 104–
113. Springer.
OliveiraJr, E., Gimenes, I. M., Maldonado, J. C., Masiero,
P. C., and Barroca, L. (2013). Systematic evaluation
of software product line architectures. Journal of Uni-
versal Computer Science, 19:25–52.
Radziukynien
˙
e, I. and
ˇ
Zilinskas, A. (2008). Evolutionary
methods for multi-objective portfolio optimization. In
Proceedings of the World Congress on Engineering,
volume 2.
Russell, S. J. and Norvig, P. (2003). Artificial Intelligence:
A Modern Approach. Pearson Education, 2 edition.
SEI (2016). AGM.
Smith, J. and Simons, C. L. (2013). A comparison of two
memetic algorithms for software class modelling. In
Proc. of GECCO, pages 1485–1492, New York, USA.
ACM.
van der Linden, F. and Rommes, E. (2007). Software Pro-
duct Lines in Action - The Best Industrial Practice in
Product Line Engineering. Springer.
Van Veldhuizen, D. A. (1999). Multiobjective evolutionary
algorithms: classifications, analyses, and new innova-
tions. Technical report, DTIC Document.
Van Veldhuizen, D. A. and Lamont, G. B. (1998). Multiob-
jective evolutionary algorithm research: A history and
analysis. Technical report, Citeseer.
Wust, J. (2016). SDMetrics. http://www.sdmetrics.com/.
Accessed on 05/12/2016.
Yoo, S. and Harman, M. (2007). Pareto efficient multi-
objective test case selection. In Proceedings of the
2007 international symposium on Software testing
and analysis, pages 140–150. ACM.
Zeleny, M. and Cochrane, J. L. (1973). Multiple criteria
decision making. University of South Carolina Press.
Zitzler, E., Laumanns, M., Thiele, L., et al. (2001). Spea2:
Improving the strength pareto evolutionary algorithm.
In Eurogen, volume 3242, pages 95–100.
Zitzler, E., Thiele, L., Laumanns, M., Fonseca, C. M.,
and Da Fonseca, V. G. (2003). Performance asses-
sment of multiobjective optimizers: an analysis and
review. IEEE transactions on evolutionary computa-
tion, 7(2):117–132.
Application of Memetic Algorithms in the Search-based Product Line Architecture Design: An Exploratory Study
189
