
Towards Improving Resilience of Smart Urban Electricity Networks by
Interactively Assessing Potential Microgrids
Eng Tseng Lau
1
, Kok Keong Chai
1
, Yue Chen
1
and Alexandr Vasenev
2
1
School of Electronic Engineering and Computer Science, Queen Mary University of London,
Mile End Road, E1 4NS, London, U.K.
2
Faculty of Engineering, Mathematics and Computer Science, University of Twente, Drienerlolaan 5,
Keywords:
Critical Infrastructure, Grid Architecture, Grid Planning, Grid Resilience, Smart Grid.
Abstract:
When a city adds a renewable generation to improve its carbon footprint, this step towards a greener city
can be a step towards a smarter city. Strategical positioning of new urban electricity components makes the
city more resilient to electricity outages. Money and resilience are two conflicting goals in this case. In case
of blackouts, renewable generation, other than distributed combustion generations, can serve critical demand
to essential city nodes, such as hospitals, water purification facilities, and police stations. Not the last, the
city level stakeholders might be interested in envisioning monetary saving related to introducing a renewable.
To provide decision makers with resilience and monetary information, it is needed to analyze the impact of
introducing the renewable into the grid. This paper introduces a novel tool suitable for this purpose and
reports on the validation efforts. The outcomes indicate that predicted outcomes of two alternative points of
introducing renewables into the grid can be analyzed with the help of the tool and ultimately be meaningfully
compared.
1 INTRODUCTION
Integration of a renewable into the grid is an entangled
task that concerns multiple domains. One might con-
sider the renewable energy-related landscape (Barjis,
2009) and have the overall aim to reduce greenhouse
gas emission (Zubelzu et al., 2015). For instance, to
find a suitable location for a biogas plant, one should
account for distances from the site to the biomass
sources is needed (Dugan and McGranaghan, 2011).
In case of solar urban planning, an important concern
is the interplay between the urban form and solar en-
ergy inputs (Amado and Poggi, 2014). Importantly,
planners should consider how the grid can behave
in case of undesirable conditions (see e.g. (Bennett,
2007; Jung et al., 2016)).
Additionally, there is a need to account for grid
resilience – the ability of the grid to withstand a
failure in an efficient manner. Specifically, it con-
cerns supplying electricity to critical infrastructures
(e.g., hospitals) during blackouts, as well as the ability
to quickly restore normal operation state. (Bollinger,
2015). Threat analysis related to non-adversarial
and intentional threats (e.g., (Vasenev and Mon-
toya Morales, 2016; Vasenev et al., 2016a)) can high-
light which components may deserve particular atten-
tion. Distributed Generations (DGs) can also be used
to compensate for the discontinuity of electricity pro-
duced by renewables. However, optimizing the cost
of dispatches of DG units is needed to ensure that this
task performed efficiently.
To account how the city can benefit from intro-
ducing a new generation, stakeholders might consider
both monetary and resilience aspects. Such decisions
might be located in the context of larger considera-
tions on improving efficiency of fault and attack mit-
igation measures, threat ranking, the energy cost and
resilience analysis, and the impact on different critical
infrastructures.
Even though numbers of tools exist to model grids
(as described in Section 2), they lack important fea-
tures to enable an interactive resilience analysis, such
as user interfaces and resilience calculations mod-
ules. To enable city-level stakeholders to account
for resilience, an Overall Grid Modelling (OGM)
was developed to account for introducing renewables
into low voltage (LV) and mid voltage (MV) grid
nodes. The methodology, policy and the development
352
Lau, E., Chai, K., Chen, Y. and Vasenev, A.
Towards Improving Resilience of Smart Urban Electricity Networks by Interactively Assessing Potential Microgrids.
DOI: 10.5220/0006377803520359
In Proceedings of the 6th International Conference on Smart Cities and Green ICT Systems (SMARTGREENS 2017), pages 352-359
ISBN: 978-989-758-241-7
Copyright © 2017 by SCITEPRESS – Science and Technology Publications, Lda. All rights reserved

governing the OGM is available in the documenta-
tions (IRENE, 2016a; IRENE, 2016b). The decision
makers are able to manipulate/control the tool and va-
rieties of resilience coefficient metric and cost analy-
sis across the grid are illustrated whenever a grid com-
ponent modification is applied.
This paper reports initial validation efforts related
to the features and functionalities of the tool in terms
of its practicability and efficiency. The tool is at the
center of an interactive approach where information
is given to decision makers, who make their choice
which is the best option in terms of grid planning, and
also to evaluate how the introduction of a renewable
increases grid resilience and also account for possible
monetary savings.
The overall organisation structure of the paper
is as follows: Section 2 reviews the state-of-the-
art modelling tools to ensure that the OGM tool is
aligned with standard core functionalities of the ex-
isting tools. Section 3 presents the methodology of
OGM tool usages. Section 4 reports the methodology
of workshop organized that validates the functionali-
ties of the OGM tool. Finally, Sections 5 and 6 dis-
cusses and concludes.
2 STATE-OF-THE-ART
MODELLING TOOLS
In this section, a state-of-the-art modelling and con-
trolling smart grid tools are reviewed. The function-
ality of the smart grid tools and the OGM tool are
cross-related for the functionalities in order to iden-
tify the desired functionality of the advanced smart
grid modelling tools.
DNV GL, the international certification body has
developed a microgrid mathematical optimization
tool (DNV GL, 2016) to evaluate the full integration
of distributed generations, electrical, thermal stor-
ages, new innovative technological updates, building
automation and customers behavioural usages. The
simulation is holistic-based and aims at maximizing
the economic value and reliability of electrical sys-
tem and power. The whole model simulates the day-
ahead energy prices, demand forecasts, weather fore-
casts, dynamic performance of the buildings, stor-
age, and distributed generation, and management of
the controllable resources (CHP, storage, and Demand
Response (DR)) that optimize the energy economics
during the day. The optimization problem is formu-
lated through the Mixed Integer Linear Programming
(MILP) approach. The optimization tool is also capa-
ble of shifting its operational module from optimizing
energy economics to maximizing the uninterruptable
and critical load that can be served from available re-
sources during the outage period.
The Massachusetts Institute of Technology (MIT)
has built a laboratory-scale microgrid based on the
earlier model developed from computer simulation
studies (Stauffer, 2012). The project focuses on a
small-scale power system that combines the energy
generation and storage devices to serve local cus-
tomers at low level grid. The Masdar Institute cor-
porates with MIT by concentrating on developing an
analytical-based weighted multi-objective optimiza-
tion within the Microgrid (Stauffer, 2012). The an-
alytical methods analyses the two factors (system
configuration and operation planning) simultaneously
that determines the costs and emissions. The method
generates a set of optimal planning/designs and op-
erating strategies that minimizes costs and emissions
simultaneously.
Siemens PTI provides a consulting, software and
training program to optimize system networks for
generation, transmission and distribution and power
plants for smart grids (Siemens PTI, 2016). The con-
sulting services offer expertise in power system stud-
ies. This includes the system dynamics and threat
analysis, energy markets and regulation, control sys-
tems, power quality, and steady-state and dynamic
system evaluations.
Etap grid has developed a Microgrid Master Con-
troller software (Etap Grid, 2015). The software con-
troller is capable of predicting and forecasting energy
generations and loads. The controller also integrates
and automatically control (automated load shedding
and generation) of microgrid elements, such as PVs,
energy storages, back-up generations, wind, gas tur-
bines, CHP, fuel cells, and demand management. The
software automatically manages and optimizes the
load during grid-connected or islanded grid opera-
tions. The software aims to lower the total cost of
ownership by reducing the average cost of electricity
from the national electricity price.
2.1 Summary of Smart Grid Modelling
Tool Functionalities
Table 1 summarizes important features of the men-
tioned modelling tools. Importantly, most of them
do not provide user interfaces between the software
and users. This can hamper their use in an interactive
manner. Besides, having user interface enables inter-
actions with less experienced users. Also, only the
DNV GL tool accounts for critical loads. As some
urban-level loads in times of blackouts can be more
critical than others, this functionality is particularly
relevant for resilience tools. The same applies for re-
Towards Improving Resilience of Smart Urban Electricity Networks by Interactively Assessing Potential Microgrids
353

silience analysis.
The OGM tool, as described next, particularly fo-
cus on these aspects. Through the mathematical op-
timization module implemented, the important fea-
tures such as the simulation of outage, islanding oper-
ation, cost and resilience analysis are performed. The
users are able to manipulate/control the tool and to
calculate changes in the resilience coefficient when-
ever a new case/scenario is applied (i.e., adding or
remove a local generator). The tool does not only
supports the simulation of electricity continuity plan-
ning (adding/removing alternate generation sources)
from the technical perspective, but also ensures the
cost concerned through the interventions for benefits
of business planning (International Electrotechnical
Commision (IEC), 2014).
Table 1: Summary of microgrids modelling tools in com-
parison with the OGM tool.
Tool DNV GL MIT Masdar Siemen Etap OGM
Institute PTI Grid tool
Functionality
Mathematical
optimization
User interface ready
Demand forecasts
Generation and
storage modelling
Account for critical
loads
Support of
threat ranking
Islanding operation
Scenario/case studies
Outage/contingency
simulations
Cost analysis
Emission analysis
Resilience analysis
Reliability analysis
Power flow analysis
3 THE OGM TOOL
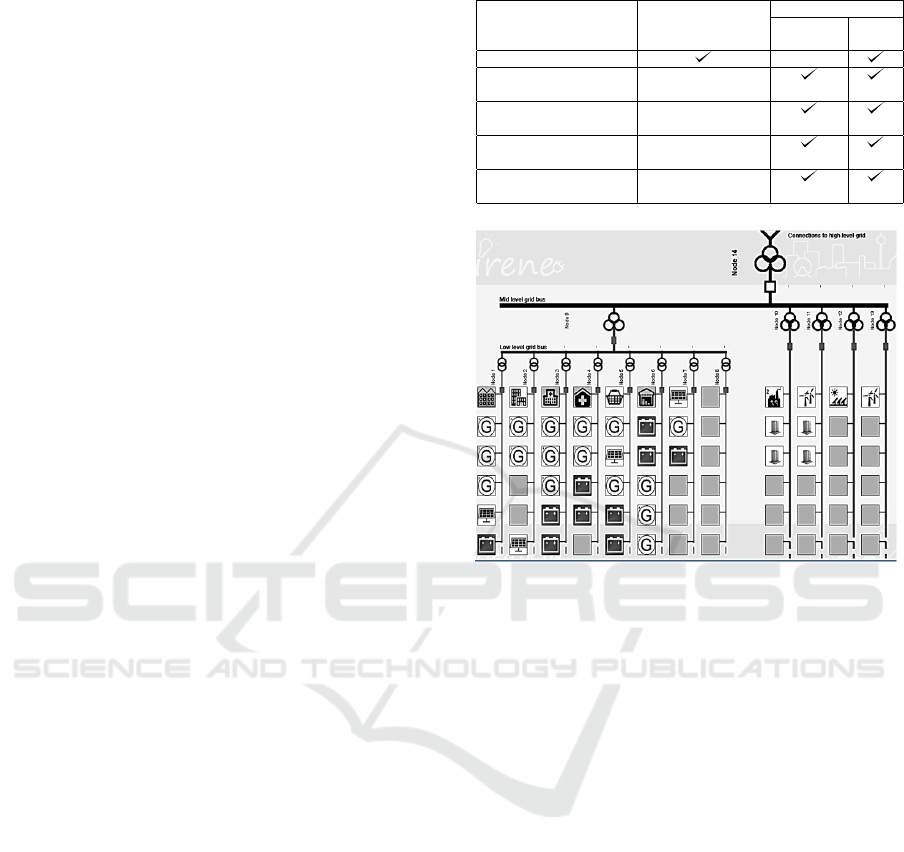
The network topology tree (or the system architec-
ture) is loaded into the GUI and as shown in Fig. 1,
where the architecture included a number of city grid
components. The distribution of grid components as
in Fig. 1 is presented in Table 2.
The OGM tool incorporates a graphical-based
user interface (GUI) (see Table 1). The GUI is to
facilitate continuous interactions with the tool that is
user-friendly, easily controllable and manipulated.
As the tool is aimed for decision makers (Munic-
ipal authority planner, DNO, Developers, Critical In-
frastructure Operator, Business and Citizen Represen-
tative) with various technical/conceptual background,
the tool aims to be easily-interpretable for fellow de-
cision makers, without incorporating complex power-
flow model and analysis. The components can be in-
troduced/removed/moved within the grid.
The tool simulates outage consequences using
the input of known outage scenario (winter/summer;
Figure 1: The baseline system architecture of the OGM tool.
Table 2: Number of distributed generators, energy storages,
types of consumer profiles and their populations included.
Node Number of generators Number of
Profiles included Populations
no. Non-renewable Renewable energy storage
1 2 2 1 Households 15000
2 3 2 0 Offices 2
3 4 0 1 Hospitals 2
4 2 0 2 Outpatient clinics 5
5 2 1 2 Supermarkets 5
6 2 0 2 Warehouses 5
7 0 0 0 - -
8 0 0 0 - -
9 0 0 0 - -
10 1 0 2 - -
11 0 1 2 - -
12 0 1 0 - -
13 0 1 0 - -
14 0 0 0 - -
start/stop time) Critical loads are known, as well as
specifics of generation profiles. Then, computations
modules will process the outage scenario. Output
results will demonstrate the monetary savings and
resilience indicator through the component changes.
The decision makers will select most suitable alterna-
tive for grid outage mitigations and repeat the simula-
tion if needed.
This tool assumes that hardware solutions to is-
land a microgrid (de-attach and re-attach it to the
main grid) can be located at the point of coupling
nodes (transformers). Thus, each node with a crit-
ical load might strive to be self-sustaining: balance
the (critical) supply and demand. A node can be ei-
ther connected or disconnected completely from the
main grid. Thus, we have only one connection to the
main grid for each single nodes in the tool. We do
not account for mesh networks. The tool particularly
focuses on threats that lead to outages: (1) those re-
sulting in the disconnection of a node from the main
grid; and (2) outage of a component (e.g., a DG as an
electricity generation element).
Support for threat ranking is another distinctive
feature of the OGM tool. Taking as input threat
analysis methodologies, such as the need to envi-
SMARTGREENS 2017 - 6th International Conference on Smart Cities and Green ICT Systems
354
sion which grid component approaches should be
paid particular attention to. Such analysis can be re-
lated to non-adversarial threats (e.g., (Vasenev and
Montoya Morales, 2016; Vasenev et al., 2016a)) as
well as threats related to intentional disruptive actions
(e.g., (Le et al., 2016; Vasenev et al., 2016b)). This
provides opportunities to enter threat characteristics
to calculate relative value of threat event frequencies.
Analysts, equipped with this information may focus
on grid components where this value is higher of a
predefined threshold.
Concerning technical implementation details, the
GUI of the OGM is developed using IntelliJ IDEA,
the Java IDE software. For the numerical optimiza-
tion algorithm, the dual-simplex algorithm is applied
for such Linear Programming problem of the grid op-
timization. The lp solve 5.5.2.3 (lp solve, 2015) is
applied as the library file for Java that is called to per-
form the optimization algorithm for the OGM tool.
The configuration as defined in Fig. 1 is simulated.
The tool calculates two indicators – resilience co-
efficients and monetary costs (with or without sav-
ings) – to inform users how the grid would operate
during a blackout. The resilience coefficient in this
paper is computed based on the extents in which the
amount of energy demand within consumers are met
when there is an outage in the grid (Bollinger, 2015).
The resilient coefficient is determined as the mean
fraction of the demand served for the outage node di-
vided by the overall demand to be served. The re-
silience coefficient in this case is therefore the frac-
tion of demand served at dth consumer (P
d,t
) divided
by the total demand D (P
D,t
) in the contingency state
at time t:
α(t) =
P
d,t
P
D,t
. (1)
A grid is robust and resilient when the com-
puted resilient coefficient is high, or is maintained
throughout the outage period. The cost savings are
determined based on the difference in between the
business-as-usual operation of the traditional grid
(without capability of islanding, and also without im-
plementation of DGs, energy system storages and re-
newables), and the alternative operation mode, when
DGs, energy storage systems and renewables are acti-
vated.
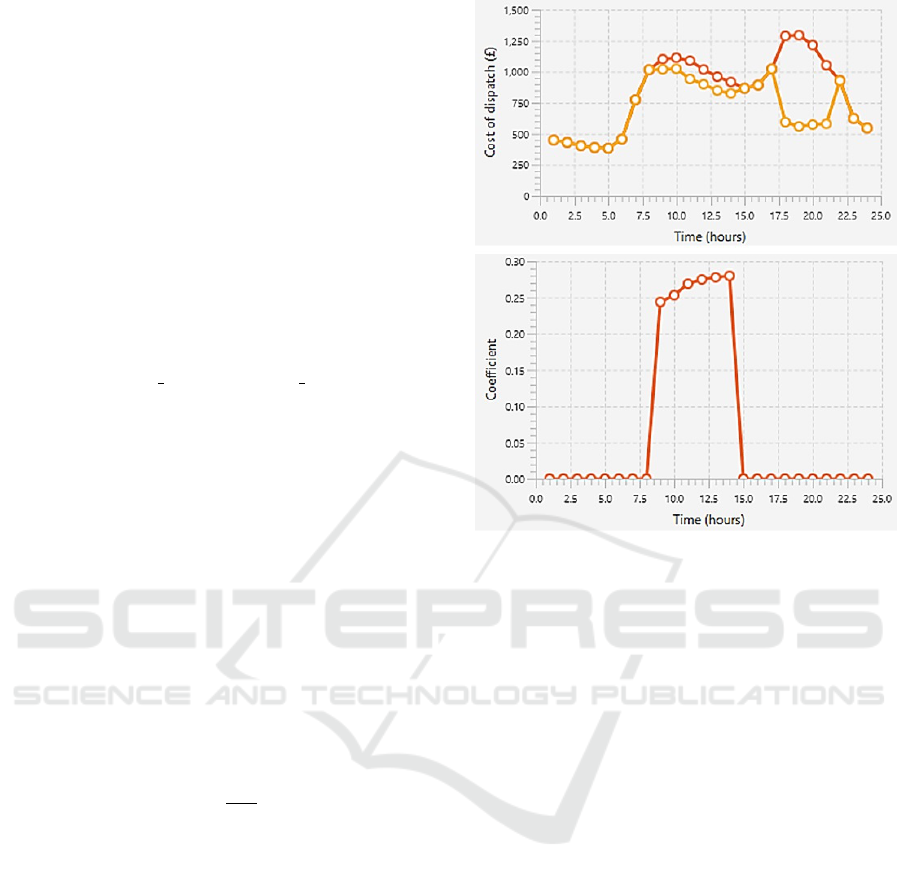
Fig. 2 shows the example of resilience coeffi-
cient and monetary costs calculated for the grid de-
scribed in Fig. 1, where the top panel presents the
plot of monetary savings in relation to the business-
as-usual and the optimised grid planning, and the bot-
tom panel that illustrates the distribution of resilience
coefficient. Negative monetary savings indicate addi-
tional costs, whereas positive savings indicate the cost
Figure 2: Resilience coefficient and monetary costs calcu-
lated for the grid: top panel – plot of monetary savings in
relation to the business-as-usual and the optimised solution;
bottom panel – the distribution of resilience coefficient.
saved through the grid planning improvement. The
resilience coefficient would be between 0 – 1 (the re-
silience coefficient is computed as zero at a particular
time interval when no outage occurs) because of the
fraction of demand served over the overall demand
during an outage event.
4 VALIDATING THE TOOL
4.1 Methodology
The gaming workshop with students was conducted
to validate the applicability of the OGM tool as a sup-
port tool for improving the resilience of the urban
electrical grids. In the beginning of the workshop,
mini-lectures on smart grids were delivered to intro-
duce students to major ideas of smart grids, as well
as the current issues and challenges. The OGM tool
was demonstrated to students to clarify the idea how
modelling tools can be used to improve the resilience
of the overall grid.
During the gaming session, exercise handouts
were given to six PhD students. Students formed
two groups (Group A & B). Within each group stu-
Towards Improving Resilience of Smart Urban Electricity Networks by Interactively Assessing Potential Microgrids
355
dents represented stakeholders (City planner, DNO,
and Citizen & Business Representative). These stake-
holder roles correspond to professionals who might
benefit from using the OGM tool. These profession-
als need to collaborative decide how to introduce new
components or modifying the existing components to
improve resilience of the grid. The system architec-
ture as illustrated in Fig. 1 and Table 2 was used as
the baseline configuration, where the amount of re-
newable sources are low. In addition to the descrip-
tion of the grid architecture, students were briefed on
the changes that the grid context might undertake. It
was suggested that the city grows, hence the popula-
tions within the city are increased, and towards the de-
carbonization plan. Specifically, amount of city com-
ponents would be as follows: Households = 25000;
Offices = 3; Hospitals = 3; Outpatient clinics = 5; Su-
permarkets = 5; Warehouses = 6.
After providing the information, students were
asked to discuss what grid updates might be intro-
duced to ensure that a city can withstand a blackout
with less negative impact. The aim of this exercise
is to investigate how the manipulation of the OGM
tool can guide the fellow professionals to improve the
resilience of a complex urban grid, in the context of
collaborative decision making in the situation of un-
certainty.
Two different outage scenarios (4 and 8 hours)
were chosen to examine the resilience of the city in
sustaining both the shorter or longer outages. The
outage in every single node is also examined, be-
cause it is intended to examine the outage effects on
the changes of the supply towards the demand pro-
file across individual consumer and the overall de-
mand, as well as the changes in the monetary sav-
ings and resilient coefficient in the grid level city as
shown in Table 3. The ‘economic-islanding’ capabil-
ity during the normal grid operation is enabled that
employs DGs, renewable sources and energy storage
systems to provide power at times of high electric-
ity price, rather than drawing the electricity from the
main grid (IRENE, 2016b).
Questionnaires were disseminated to fellow stu-
dents at the end of the workshop.
4.2 Results
In order to access the effectiveness of the collabora-
tive decisions as made by Groups A & B, normal and
failure of grid operations are simulated for each node,
and also the entire microgrid level. Failures occur
when there is a line-disconnection between the mi-
crogrid and main grid level, and also the line discon-
nection within the microgrid nodes. When there is a
Table 3: Type of grid operations and the indicators applied.
Grid operation Economic islanding Indicators
capability Resilient Cost
coefficient saving
Normal
Outage 4 hours
for single node
Outage 8 hours
for single node
Outage 4 hours
for complete grid outage
Outage 8 hours
for complete grid outage
Figure 3: The modification of the grid architecture as pro-
posed by Group A.
line-disconnection due to a failure event, the island-
ing capability is activated to ensure uninterrupted op-
eration during a utility system outage with N-1 com-
pliance (IRENE, 2016b). Decisions placed and the
performance of the implemented decisions by each
groups are compared with the baseline case in terms
of resilience coefficients and monetary savings.
The decisions are simulated using the OGM tool
and the timeline for the simulation is allowed for 24
hours. The grid with various operating conditions are
simulated for the baseline case, Groups A & B.
Group A after some discussions proposed to up-
date the base scenario (Fig. 1) as shown in Fig. 3. The
updates were:
i. Move solar PV from Node 2 to Node 7;
ii. Remove one non-renewable generation in Node 2;
iii. Remove one non-renewable generation and add
one energy storage in Node 3;
iv. Add one non-renewable generation in Node 6;
v. Remove solar PV and add one non-renewable
generation in Node 1;
vi. Add one non-renewable generator and one energy
storage in Node 7.
The collaborative decisions as proposed by
Group B, using the base configuration of Fig. 1 were
SMARTGREENS 2017 - 6th International Conference on Smart Cities and Green ICT Systems
356
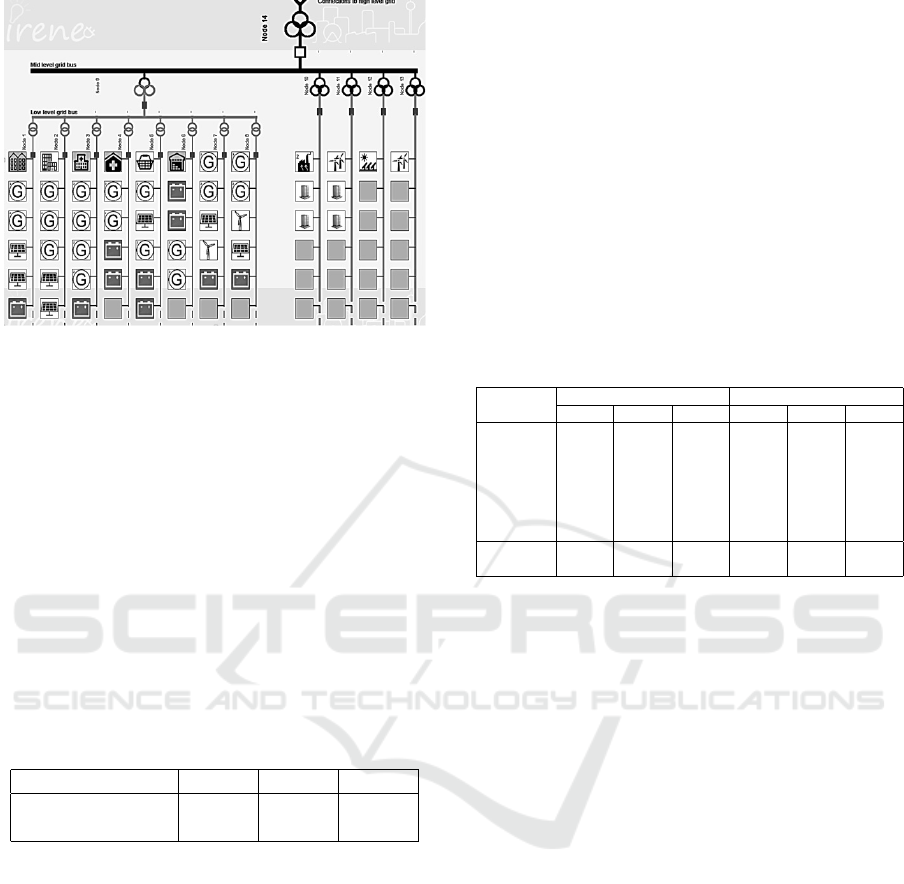
Figure 4: The modification of the grid architecture as pro-
posed by Group B.
presented in Fig. 4, which were:
i. Add two non-renewable generations in Nodes 7 &
8;
ii. Add one solar PV in Nodes 7 & 8;
iii. Add one small-scale wind turbine in Nodes 7 & 8;
iv. Add one energy storage in Nodes 7 & 8.
4.2.1 Case 1 – Normal operation
In this case, assuming no failure occurs, the normal
mode of operation is applied. The cost savings and
resilience coefficient achieved for baseline, Groups A
& B are shown in Table 4.
Table 4: Cost savings and resilience coefficient for normal
operations.
Baseline Group A Group B
Cost savings (£) 1865.39 2112.27 2136.36
Resilience coefficient 0 0 0
Based on Table 4, the collaborative decisions pro-
posed by Group B achieve higher amount of cost
savings than Group A, and also higher than the
Baseline scenario. Hence the decision by Group B
achieves higher amount of cost savings, particularly
for ‘economic-islanding’ normal mode of grid opera-
tions. The resilience coefficients are all zeros. This
is because the grid resilience is not considered dur-
ing the normal mode of operation (without any out-
age events). The simulation excludes the addition of
installation and maintenance costs of individual gen-
erators.
4.2.2 Case 2 – Four Hours of Outage Duration
In this case, it is assumed that an outage within the
microgrid or the entire grid occurs at 0900 for the du-
ration of four hours. The ‘economic-islanding’ capa-
bility is disabled in the case of outage events. Table 5
shows the result of the simulation using the baseline
scenario, Group A & B. Negative sign indicates that
additional costs are introduced (no monetary savings
are achieved). Overall Group A’s collaborative de-
cision promotes highest amount of cost savings than
Group B, and also the baseline case. In all cases crit-
ical loads were served during the outage events. The
computed resilience coefficients are identical.
Table 5: Case 2 – cost savings and resilience coefficient for
outage operations.
Outage Node
Cost savings (£) Resilient coefficient
Baseline Group A Group B Baseline Group A Group B
Node 1 208.47 138.98 208.47 0.21 0.21 0.21
Node 2 -94.79 -29.06 -94.79 0.218 0.218 0.218
Node 3 198.33 368.82 198.33 0.242 0.242 0.242
Node 4 211.16 259.30 211.16 0.131 0.131 0.131
Node 5 206.19 125.25 206.19 0.109 0.109 0.109
Node 6 321.80 205.25 321.80 0.007 0.007 0.007
Grid outage 1286.65 1559.54 1558.27 1 1 1
Total savings
2337.81 2628.08 2609.43 – – –
(£)
4.2.3 Case 3 – Eight Hours of Outage Duration
In the final case, it is assumed that an outage within
the microgrid or the entire grid occur at 0900 with
prolonged outage duration of eight hours compared
to Case – 2. The ‘economic-islanding’ capability is
also disabled. Each outage node disconnections is
evaluated. Table 6 shows the result of the simula-
tion using the baseline scenario, Group A & B. Sim-
ilarly as in the previous case, Negative sign indicates
additional costs are introduced (no cost savings are
achieved). ‘Invalid’ indicates that monetary savings
are not calculated as the proportions of the demand at
the particular node during the outage is not met. Over-
all Group B’s collaborative decision promotes highest
amount of cost savings. The installation of a new en-
ergy storage system and also the removal of one of
the non-renewable generation in Node 3 proposed by
Group A results in insufficiency of energy supply to
match the fraction of demand to be served for hospital
loads during the outage in Node 3. The low resilient
coefficient as computed in Node 3 suggests the failed
portion of demand (0.252 − 0.15 = 0.105) served in
Node 3 during the outage.
Towards Improving Resilience of Smart Urban Electricity Networks by Interactively Assessing Potential Microgrids
357
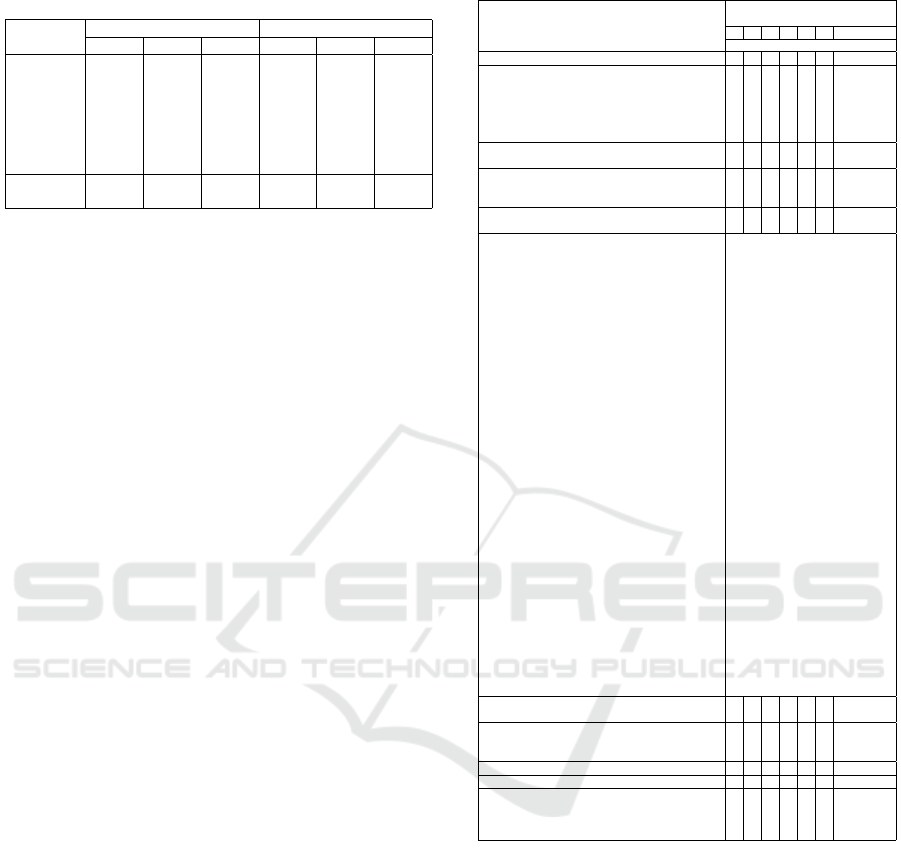
Table 6: Case 3 – cost savings and resilience coefficient for
outage operations.
Outage Node
Cost savings (£) Resilient coefficient
Baseline Group A Group B Baseline Group A Group B
Node 1 310.83 136.55 310.83 0.219 0.219 0.219
Node 2 -189.66 -159.42 -189.66 0.208 0.208 0.208
Node 3 272.31 Invalid 272.31 0.252 0.12 0.252
Node 4 225.49 116.06 225.49 0.132 0.132 0.132
Node 5 234.59 -12.35 234.59 0.106 0.106 0.106
Node 6 546.84 267.97 546.84 0.064 0.064 0.064
Grid outage 1817.43 1850.51 2118.89 1 1 1
Total savings
3217.83 – 3519.29 – – –
(£)
5 DISCUSSION
Overall, the gaming exercise was successfully con-
ducted with pros and cons of the grid component al-
terations within the collaborative decisions made by
two groups, in comparison with the baseline case. Ad-
ditionally, the gaming workshop also noted the exten-
sive collaboration within students in successfully in-
creasing the resilience of the electricity network that
is prone to outage events.
The feedback questionnaire is shown in Table 7.
Based on Table 7, the outcomes of the gaming ses-
sion showed that the tasks related to grid update (in-
cluding the introduction of renewables and changes in
the consumption) could be effectively performed in an
understandable manner. Results can be compared and
a better alternative (with respect to some criteria) can
be selected.
Participants indicated that the tool can be
used even without having advanced domain-specific
knowledge. Five participants also agreed that the
OGM tool is practicable for evaluation of urban elec-
tricity network. Positive scores were obtained about
the practicability of the demand management, con-
trolled generations, islanded operations, critical loads,
disconnected and uninterruptible loads in the OGM
tool.
However, one of the participant outlined the dif-
ficulty in understanding the given scenario and de-
manded more relevant data in order to provide better
decisions, rather than the overall grid outlook. Sev-
eral participants also pointed out the need for addi-
tional amount of data given (particularly to advanced
knowledge of decision makers) in order to provide a
clearer indication of grid component modifications.
Still, some additional explanations are needed before
using the tool through the lectures. For instance, the
participant indicated that the resilience coefficient ap-
plied is not completely understandable, as well as
some advanced functionalities of the OGM tool were
not clear.
Table 7: Questionnaire results.
Question Rating scale
(1 – Very negative, 7 – Very positive)
1 2 3 4 5 6 7
Number of respondents
Q1. Knowledge on Smart Grids 0 0 1 4 1 0 0
Q2a. Practicability of demand management capability 0 0 0 2 2 1 1
Q2b. Practicability of controlled generations 0 0 0 1 2 3 0
Q2c. Practicability of islanded operation during outage 0 0 0 0 2 1 2
Q2d. Practicability of disconnected load during outage 0 0 0 1 2 3 0
Q2e. Practicability of critical loads 0 0 0 0 1 2 3
Q2f. Practicability of uninterruptible loads 0 0 0 2 1 2 1
Q3a. Effectiveness of OGM tool in addressing outage 0 0 0 1 2 1 2
Q3b. Effectiveness of threat ranking support 0 0 2 0 3 1 0
Q4a. Speed of OGM tool to run/re-run a simulation 0 0 0 1 2 0 3
Q4b. Speed of OGM tool to construct/re-construct 0 0 0 1 1 1 3
grid components
Q5a. Level of knowledge required in using the tool 1 0 2 1 0 1 1
Q5b. Level of easiness in using the tool 1 0 0 1 1 0 3
Q6. Reason for rating as 5 or above in Q5. –There are many components and
the users must have knowledge
in understanding them.
–The GUI of the toolset is
easy to use.
–The scenario is complex, and
more data is preferred to make
decision, instead of just having
an overview.
There are many components in the
tool which will require background
knowledge.
It would be more useful to indicate
electricity flow direction.
It is very convenient to add/delete
a component in the tool.
–Functionality of the component
is not quite clear.
–Types of power supplies are not
illustrated accurately.
–The tool is useful for designing
the city development.
–Key parameter can be provided
graphically.
–Panel to support add/drag icons.
–More data to make decisions.
–More description of components.
–Specify the different kind of
threat and the type of hazardous
disconnection.
–Distance or distribution of grid
planning is not fully presented.
–Capacity of generators should be
provided.
–Costs and distance analysis
should be considered in the tool.
Q7a. Understandable of resilient coefficient metric 0 0 2 2 2 0 0
Q7b. Understandable of threat ranking 0 1 1 2 1 1 0
Q8a. Practicability of resilient coefficient metric 0 0 0 2 3 1 0
Q8b. Practicability of threat ranking 0 0 0 2 2 2 0
Q8c. Practicability of grid evaluation 0 0 1 1 1 1 2
Q9. Speed in providing analysis 0 0 0 0 1 2 3
Q10. Usefulness in addressing outage 0 0 0 1 0 4 1
Q11a. Usefulness of the tool as a collaborative 0 0 0 1 2 2 0
decision support system
Q11b. Usefulness of the tool in establishing 0 0 0 1 2 3 0
collaborative frameworks among stakeholders
6 CONCLUSION
This paper presents an approach to improve resilience
of smart urban electricity networks by using a deci-
sion support tool to assess the potential microgrids.
The OGM tool is developed that allow fellow deci-
sion makers to manipulate/control the tool in examin-
ing the resilience coefficient metric and the potential
monetary savings across the grid are illustrated when-
ever a grid component modification is applied.
Overall, the obtained perspectives of the OGM
tool from decision makers (simulated by students)
through the workshop are indeed useful not only to
improve the usability of the OGM tool, but also to
SMARTGREENS 2017 - 6th International Conference on Smart Cities and Green ICT Systems
358

improve the overall understanding of decision mak-
ers. Different cases and solutions were presented
that showed the trade-off in between the resilient co-
efficient and monetary savings (e.g. one may wish
to increase the resilience of electricity network but
may result in extra investments). The tool would be
needed to make the point that all those complex as-
pects should be considered by minimizing such trade-
offs.
In summary, the idea and logic of using the tool
for grid planning are well-received. Based on the
feedback obtained, the tool can be further improved
by providing more descriptions of the grid scenario,
data information such as the capacity of generations
and demands, better navigation of adding/removing
components, and a clearer description of the OGM
tool.
The tree representation of the grid architecture is
a first step in the OGM tool. As the grid architecture
does not account for mesh networks, moving to the
meshed grid is the future work.
REFERENCES
Amado, M. and Poggi, F. (2014). Solar urban planning:
a parametric approach. Energy Procedia, 48:1539–
1548.
Barjis, J. (2009). Collaborative, participative and interac-
tive enterprise modeling. In Enterprise Information
Systems, Proceedings of the 11th International Con-
ference ICEIS 2009, Milan, Italy, May 6 – 10 2009,
pages 651–662. Springer Berlin Heidelberg.
Bennett, B. (2007). Understanding, assessing, and respond-
ing to terrorism: Protecting critical infrastructure and
personnel, volume 4 of 10. John Wiley & Sons.
Bollinger, L. A. (2015). Fostering climate resilient
electricity infrastructure. [Online]. Available:
http://repository.tudelft.nl/islandora/object/
uuid:d45aea59-a449-46ad-ace1-
3254529c05f4/datastream/OBJ/download. [accessed
06.12.16].
DNV GL (2016). Microgrid optimizer - a holistic oper-
ational simulation tool to maximize economic value
or electrical power reliability. [Online]. Available:
http://production.presstogo.com/fileroot7/gallery/
DNVGL/files/original/
3a1dd794f6ff46b9a279175c15af0f11.pdf. [accessed
05.12.16].
Dugan, R. and McGranaghan, M. (2011). Sim city. IEEE
Power and Magazine, 9(5):74–81.
Etap Grid (2015). Power technologies
international. [Online]. Available:
http://etap.com/Documents/Download [accessed
19.01.17].
International Electrotechnical Commision (IEC) (2014).
White paper - microgrids for disaster preparedness
and recovery with electricity continuity and systems.
Technical report, IEC WP Microgrids, Switzerland.
IRENE (2016a). D2.2 – root causes identification and soci-
etal impact analysis. Technical report.
IRENE (2016b). D3.1 – system architecture design, supply
demand model and simulation. Technical report.
Jung, O., Bessler, S., Ceccarelli, A., Zoppi, T., Vasenev,
A., Montoya, L., Clarke, T., and Chappell, K. (2016).
Towards a collaborative framework to improve urban
grid resilience. In Proceedings of 2016 IEEE Inter-
national Energy Conference (ENERGYCON), 4 – 8
April, pages 1–6. IEEE.
Le, A., Chen, Y., Chai, K. K., Vasenev, A., and Mon-
toya Morales, A. L. (2016). Assessing loss event fre-
quencies of smart grid cyber threats: Encoding flex-
ibility into fair using bayesian network approach. In
Proceedings of the 1st EAI International Conference
on Smart Grid Inspired Future, 19 – 20 May 2016,
Liverpool, United Kingdom, pages 43–51. Springer
Verlag.
lp solve (2015). Introduction to lp solve 5.5.2.5. [Online].
Available: http://lpsolve.sourceforge.net/5.5/. [ac-
cessed 19.10.16].
Siemens PTI (2016). Power technolo-
gies international. [Online]. Available:
http://w3.siemens.com/smartgrid/global/en/products-
systems-solutions/software-solutions/planning-
data-management-software/PTI/Pages/Power-
Technologies-International-(PTI).aspx. [accessed
19.01.17].
Stauffer, N. (2012). The microgrid - a small-scale flexi-
ble, reliable source of energy. [Online]. Available:
http://energy.mit.edu/news/the-microgrid/. [accessed
19.01.17].
Vasenev, A. and Montoya Morales, A. L. (2016). Analysing
non-malicious threats to urban smart grids by interre-
lating threats and threat taxonomies. In Proceedings
of 2016 IEEE International Smart Cities Conference
(ISC2), 12 – 15 September 2016, Trento, Italy, pages
1–4. IEEE.
Vasenev, A., Montoya Morales, A. L., and Ceccarelli, A.
(2016a). A hazus-based method for assessing robust-
ness of electricity supply to critical smart grid con-
sumers during flood events. In Proceedings of the 11th
International Conference on Availability, Reliability
and Security, ARES 2016, 31 August – 02 September
2016, Salzburg, Austria., pages 223–228. IEEE.
Vasenev, A., Montoya Morales, A. L., Ceccarelli, A., Le,
A., and Ionita, D. (2016b). Threat navigator: group-
ing and ranking malicious external threats to current
and future urban smart grids. In Proceedings of the
1st EAI International Conference on Smart Grid In-
spired Future, 19 – 20 May 2016, Liverpool, United
Kingdom, pages 184–192. Springer Verlag.
Zubelzu, S., Alvarez, R., and Hernandez, A. (2015).
Methodology to calculate the carbon footprint of
household land use in the urban planning stage. Land
Use Policy, 48:223–235.
Towards Improving Resilience of Smart Urban Electricity Networks by Interactively Assessing Potential Microgrids
359
