
Analysis on the Graph Techniques for Data-mining and Visualization of
Heterogeneous Biodiversity Data Sets
V
´
ıctor M
´
endez Mu
˜
noz
1
, Anna Cohen-Nabeiro
2
, Romain David
3
, Vicente Jos
´
e Ivars Cam
´
a
˜
nez
1
,
Alfons Nonell-Canals
5
, Miquel Angel Senar
1
, Denis Couvet
4
, Jean-pierre Feral
3
,
Aur
´
elie Delavaud
2
and Thierry Tatoni
3
1
Department of Computer Architecture & Operating Systems (CAOS), Universitat Aut
`
onoma de Barcelona (UAB),
Bellaterra (Barcelona), Spain
2
Fondation pour la Recherche sur la Biodiversit
´
e (FRB), Paris, France
3
Institut M
´
editerran
´
een de Biodiversit
´
e et d’Ecologie marine et continentale (IMBE), CNRS, Aix Marseille Universit
´
e, IRD,
and Universit
´
e d’Avignon, France
4
Museum National d’Histoire Naturelle, Paris, France
5
Mind the Byte, Barcelona, Spain
Keywords:
Biodiversity Data Mining, Ontology Engineering, Biodiversity Metadata Visualization, Graph.
Abstract:
Extisting biodiversity databases contain an abundance of information. To turn such information into know-
ledge, it is necessary to address several information-model issues. Biodiversity data are collected for various
scientific objectives, often even without clear preliminary objectives, may follow different taxonomy standards
and organization logic, and be held in multiple file formats and utilising a variety of database technologies.
This paper presents a graph catalogue model for the metadata management of biodiversity databases. It explo-
res the possible operation of data mining and visualization to guide the analysis of heterogeneous biodiversity
data. In particular, we would propose contributions to the problems of (1) the analysis of heterogeneous dis-
tributed data found across different databases, (2) the identification of matches and approximations between
data sets, and (3) the identificaton of relationships between various databases. This paper describes a proof of
concept of an infrastructure testbed and its basic operations, presenting an evaluation of the resulting system
in comparison with the ideal expectations of the ecologist.
1 INTRODUCTION
Accurate and publicly available information on bi-
odiversity observations can contribute to scientific
knowledge, foster multidisciplinary studies, and pro-
vide new perspectives to environmental and societal
responses including decision-making (Lausch et al.,
2015). To this end, several biodiversity metadata pro-
jects have been established which describe and cha-
racterize the information hosted in a range of distribu-
ted databases (David et al., 2016; Dodge et al., 2013).
As these metadata projects grow horizontally,
with more databases and types of data sets, as well
as vertically, with more documents, the ecologist will
need information management tools to enable the fol-
lowing common tasks:
1. To discover existing but heterogeneous, dispersed
data sets of different origins and scales of obser-
vation;
2. To discover relationships between documents of
potential interest to the scientist;
3. To interpret the semantic meaning of relations
without the need to know the meta-model;
4. To enable the scientist to understand the data con-
text and collection methods of multiple fields and
topics;
5. To determine the quality associated with the data,
including the data sets inter-calibration; and
6. To be aware of the conditions of access and use.
This proof of concept presents a case study of the
ECOSCOPE metadata catalogue (Taffoureau et al.,
2016; Eco, ) which provides data mining and visu-
alization capabilities. ECOSCOPE is a metadata col-
lection service for databases of different fields of eco-
logy in lato sensu.
We follow a behaviour-driven development
(BDD)(Solis and Wang, 2011) of a minimal ope-
rational set and the assessment of the ecologist at
each operation. The resulting evaluation is used to
144
Muñoz, V., Cohen-Nabeiro, A., David, R., Camáñez, V., Nonell-Canals, A., Senar, M., Couvet, D., Feral, J-p., Delavaud, A. and Tatoni, T.
Analysis on the Graph Techniques for Data-mining and Visualization of Heterogeneous Biodiversity Data Sets.
DOI: 10.5220/0006379701440151
In Proceedings of the 2nd International Conference on Complexity, Future Information Systems and Risk (COMPLEXIS 2017), pages 144-151
ISBN: 978-989-758-244-8
Copyright © 2017 by SCITEPRESS – Science and Technology Publications, Lda. All rights reserved

propose a new graph catalogue service architecture.
The new graph catalogue can be used for metadata
discovery and visualization, integrated with the
existing and future data management service. The
current ECOSCOPE web catalogue is used to collect
metadata in a standardized way, using an authoriza-
tion service which provides the ecologist accredited
access to various storage systems.
2 RELATED WORK AND
MOTIVATION
The consortium IndexMed (renamed recently “Index-
Meed - Indexing for Mining Ecological and Environ-
mental Data” to build international projects) was cre-
ated by the axis ” Management of biodiversity and
natural spaces ” of the IMBE (Mediterranean Insti-
tute of freshwater and marine Biodiversity and Eco-
logy) (David et al., 2015). Its main goal is to develop
awareness of databases and their effective use in the
ecological research community. This consortium is
particularly useful as a bridge between existing net-
works and initiatives at national and international le-
vels. The aim of the consortium is to index biodiver-
sity data (and to provide an index of qualified existing
open datasets) and to make it possible to build graphs
to assist in the analysis and the development of new
ways to mine data. Standards and specific protocols
can be applied to interconnect databases. Semantic
approaches greatly increase data interoperability. The
project should develop new transdisciplinary methods
of data analysis, focusing on open data, open source
and free methods and development tools.
ECOSCOPE is an infrastructure funded and ma-
naged by French research organisations through
the Foundation for Research on Biodiversity (FRB)
which ensures its coordination. The scientific aim
is to document the state and trends of biodiversity
and ecosystem services, enabling scenarios for the
future to be built. In this framework, ECOSCOPE
promotes the complementarity of observations and
links between research observation systems that vary
across spatial and temporal scales, variables, studied
ecosystems and kingdoms, levels of organization and
data sources. In cooperation with existing initiatives,
ECOSCOPE provides an entry point for the discovery
of observations and datasets for research on biodiver-
sity across the entire data life cycle, facilitating links
between data producers and users.
Note - for deletion on final version: Scholes does
not refer to ECOSCOPE. hence it cannot be used in
this manner as a reference. You could say ”These
aims are consistent with Scholes et al.(2012).”
The ECOSCOPE metadata catalogue delivers
freely available online information about who, where,
what, when, why and how the research observation
data were collected. It is build on the EBV concept,
developed by GEO BON (Group on Earth Observa-
tion Biodiversity Observation Network), which is de-
signed to serve as the foundation for interoperable
sub-national, national, regional and global monitoring
initiatives.
Precise and public information on biodiversity
observation datasets contribute to data openess and
reuse, in full conformity with data producers and ow-
ners. Metadata formats the description, characterisa-
tion and specification of data hosted in datasets, allo-
wing the discovery of data, whether heterogeneous or
dispersed and across locational and observational sca-
les. Metadata permits the understanding of the con-
text of the dataset, collection methods and data qua-
lity. It gives information on access and use of data
and other resource conditions and the contact persons
(Michener 2006).
Michener W.M. (2006) Meta-information con-
cepts for ecological data management. Ecological In-
formatics 1:3-7
The ECOSCOPE metadata catalogue answers to
this need thanks to providers and exchanges with ot-
her information systems. As it is based on standards
in use, the metadata profile can be exported into other
information systems, and metadata files (such as Eco-
logical Metadata Language: EML) can be imported
into the ECOSCOPE metadata portal. It contributes
to global efforts to make research on biodiversity data
more available for scientific projects, synthesis and
indicators.
In this context of a prototype for collecting ecolo-
gical metadata of various fields and topics, our moti-
vation is to explore the possibilities of graph techni-
ques for visualization and data mining supported in
graph databases. The graph databases have been a
proven feasible backend to provide semantic servi-
ces (Riesen and Bunke, 2008; Angles and Gutier-
rez, 2008). Furthermore, the indexing capabilities of
graph databases ensures the scalability of the system
response (Williams et al., 2007), which is a critical
factor in our needs to increase various databases, data
sets, and document integration.
In a graph catalogue the database mapping mo-
del is isomorphic with the represented structure. The
resulting model enables the evolution of applications
with linear complexity in the data mining operation,
which is critical for scale-up in data volume and vari-
ety.
The overall architecture of our vision is shown in
Figure 1. There are increasing number of database
Analysis on the Graph Techniques for Data-mining and Visualization of Heterogeneous Biodiversity Data Sets
145
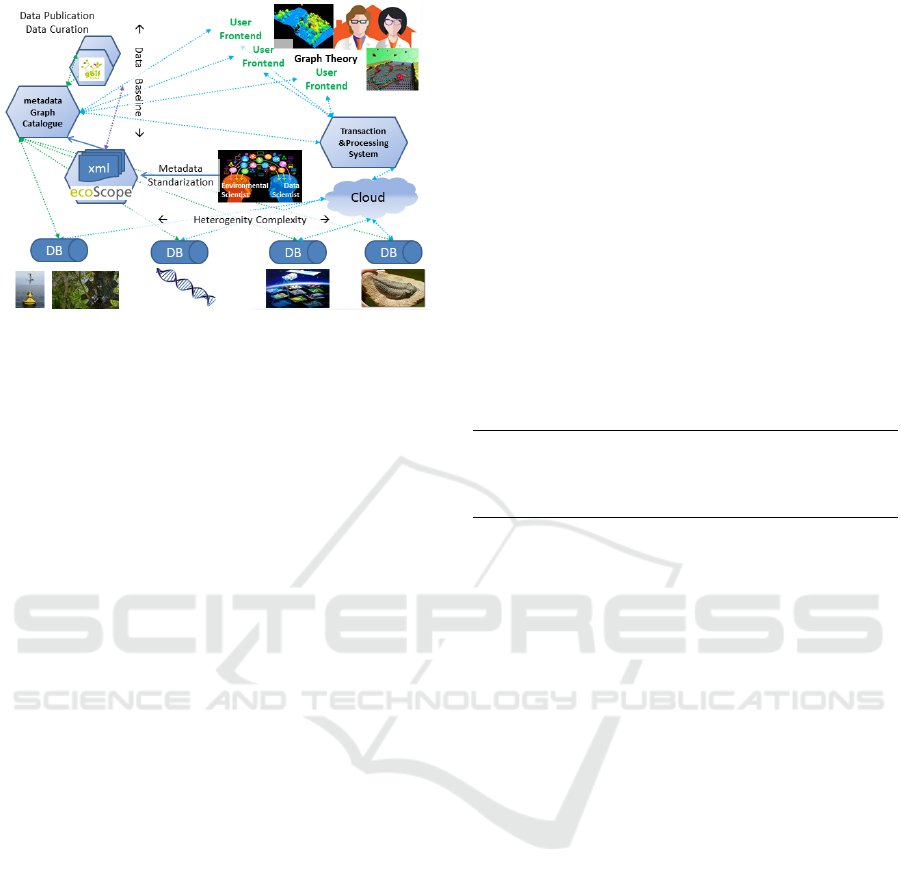
Figure 1: The proposed metadata graph catalogue in the
IndexMed overall architecture.
managers adopting a metadata standarization process,
using the ECOSCOPE portal to deliver a meaningful
metadata description into the ECOSCOPE database.
Other external sources are used to complement related
information about curation and publication, like GBIF
(Flemons et al., 2007). GBIF attempts to bring toget-
her all biodiversity and collections data to make them
available to researchers and the general public. To do
this, the GBIF provides a search engine for databases
connected to GBIF in a standardized way. Data ow-
ners can connect all or part of their resources to GBIF
to make them visible and interoperable, but they keep
the control of their data, which they continue to host
and use in their work.
In the current prototype architecture of GBIF,
there is no vertical solution to secure access into the
storage systems, neither high level facilities for se-
mantic data. In this paper we are exploring and ana-
lyzing the possibilities of the high level semantic data
operations.
3 A SEMANTIC METADATA
SERVICE WITH GRAPH
CATALOGUE
To prove the concept, we have dumped the current
ECOSCOPE document database into a graph data-
base and we test the ecologist operations. Scientists
produce knowledge by analysing data into informa-
tion and the goal is to elaborate theories from infor-
mation. Data constitute the primary material from
which hypotheses are first formulated, then refined
and validated. Metadata permit the data openness and
data sharing, as the way to give value to data after
their primary use (McNutt et al., 2016).
3.1 Basic Visualization Operations
This section presents the general visualization of the
graph with all the metadata nodes, and two other ge-
neral visualizations of all data sets, but without all the
metadata nodes.
3.1.1 Operation: Show All Graph
Given ecologist could not be aware of the meta
models of multidisciplinary data sets.
When ecologist likes to analyze the possibilities of
multidisciplinary studies because it is the only way to
better understanding systemic interactions between
factors.
Then it is needed and overall meta model view with
browse capabilities.
Test:
MATCH (n)
OPTIONAL MATCH (n)-[r]-()
RETURN n,r
Assets: Displays the hold graph of the me-
tadata catalogue without any previous knowledge
of the meta-model. It can be a good starting
point to get the number of nodes (300) and rela-
tions (1137). The nodes are: Address(5), Attri-
bute(48), Dataset(30), Description(17), GPolygonOu-
terRing(14), GeographicCoverage(19), Keyword(79),
Person(8), TaxonomicClassification(45), Taxonomic-
Coverage(31), TemporalCoverage(4)
Weakness: There is limited interactive usability
of the graph method in large meta models, because it
is difficult to visually manage too many objects—300
in our proof of concept—ideally less than 100 nodes
are recommended.
3.1.2 Operation: Show Graph for Spatial and
Temporal Relations
Given the complete graph nodes and their direct rela-
tions can be categorized as follows:
• Data set core information: Dataset→Description;
Person→Address
• Temporal and spatial information:
GeographicCoverage→GPolygonOuterRing;
TemporalCoverage
• Information of data set classification: Attribute;
TaxonomicCoverage→TemporalCoverage; Key-
words
When core information is the spine in the structure
and the two other categories are more specific,
Then it can be of interest the visualization and
COMPLEXIS 2017 - 2nd International Conference on Complexity, Future Information Systems and Risk
146
browse of a graph focused in the core information
with temporal and spatial information.
Test:
MATCH (n)
WHERE NOT n:Attribute
AND NOT n:Keyword
AND NOT n:TaxonomicClassification
AND NOT n:TaxonomicCoverage
RETURN n
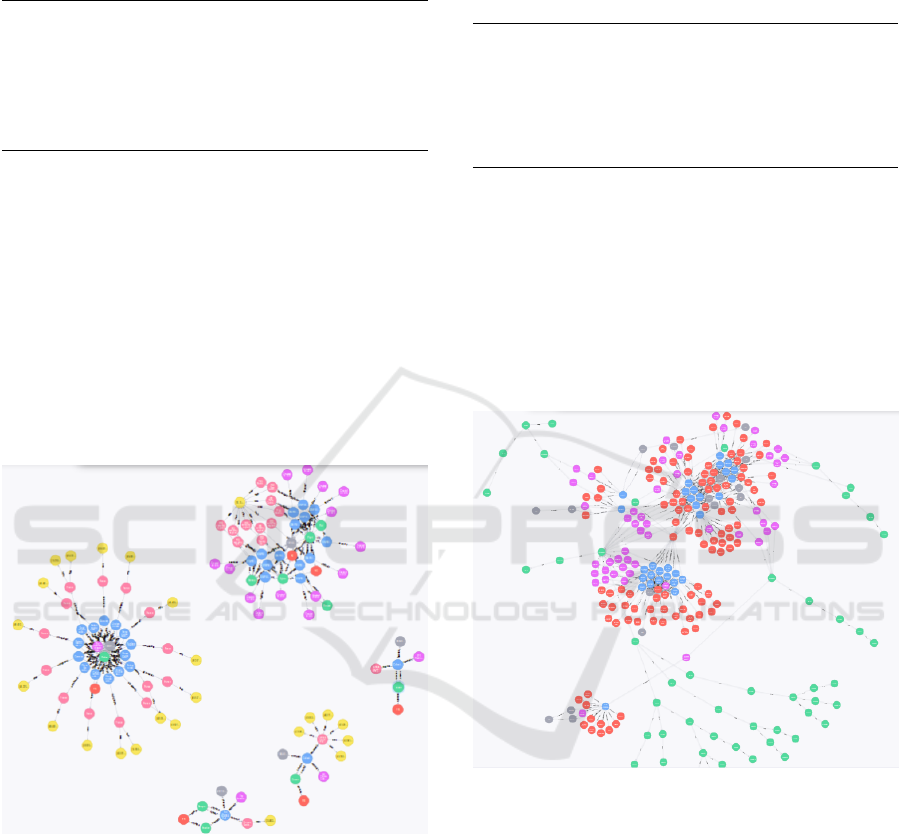
Assets: Here a clear segmentation of the graph
in 5 categories is obtained (Figure 2). This general
spatial temporal graph shows two types of node seg-
ments. On one hand, some segments are irrelevant be-
cause a single data set (in blue) is related to its core in-
formation: the three segments in the bottom right. In
the other hand, node segments with several data sets
are related with temporal spatial information. For ex-
ample, the segment on the top shows all the data sets
(nodes in blue) are related to a single geographical
area (node in yellow), even when they have been tag-
ged with different geographical names in the database
(nodes in pink).
Figure 2: A general view of the spatial temporal graph.
Weakness: The resulting segmentation does not
show relations between data sets of different data-
bases. Eventually, a more precise matching in geo-
graphical area is needed, for example by area proxi-
mity or overlap. Another approach could be to draw
such areas in the map to give to the ecologist a visual
map of the data sets.
3.1.3 Operation: Show Graph for Taxonomy
and Organizational Relations
Given the node classification above.
When it is needed for analysis of data set categories,
Then it can be of interest to the visualization and
browse of a graph focused in core information with
the organizational logic metadata.
Test:
MATCH (n)
WHERE NOT n:Attribute
AND NOT n:TemporalCoverage
AND NOT n:GeographicCoverage
AND NOT n:GPolygonOuterRing
RETURN n
Assets: Figure 3 shows a clear segmentation of
data sets (nodes in blue) by the organization logic me-
tadata of Keyword (in red), TaxonomicClassification
(in green) and TaxonomicCoverage (in pink), but with
all the nodes connected, which is of high interest to
enable multidisciplinary relationship discovery. Our
results show some metadata fields which are relation-
hubs between data sets of different databases, particu-
larly a few generalist TaxonomicClassification values
and Keywords.
Figure 3: A general view of the organizational logic graph.
Weakness: Even when the visualization tool is
able to do a zoom of Figure 3, this is not enough to
ensure a systematic discovery.
3.2 Common Data Mining Operations
This sub-section presents operations in the metadata
graph database to provide a subset of the graph ac-
cording to the behaviours requited by the ecologist,
which have been described in the enumeration of the
introduction section.
3.2.1 Operation: Common 1
Given the general graph visualizations above,
When ecologist want to discover existing but hetero-
Analysis on the Graph Techniques for Data-mining and Visualization of Heterogeneous Biodiversity Data Sets
147
geneous, dispersed data sets of different origins and
scales of observation;
Then restrict the graph of visualization operation
3.1.2, which contains geographical origins and tem-
poral scales, to match a single hub node and related
data sets. The hub node is taken from previous
general view of operation 3.1.3
Test:
START keyword=node(*)
MATCH (n)<-[]-(d)-[r]->(keyword)
WHERE keyword.word = "AGROVOC"
AND NOT n:Attribute
AND NOT n:Keyword
AND NOT n:TaxonomicClassification
AND NOT n:TaxonomicCoverage
RETURN n,d,r,keyword
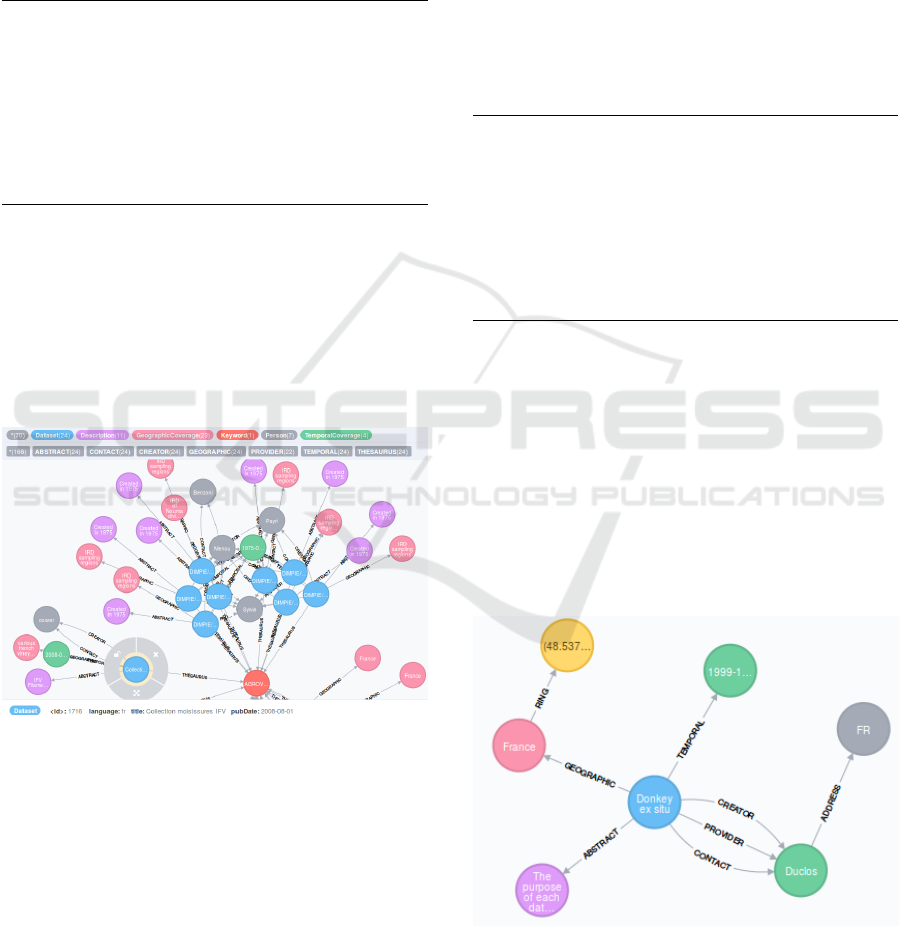
Assets: In Figure 4 a zoom view of all the data
sets related to the hub metadata. In red the hub node
(Keyword=AGROVOC). The cluster on the top is a
segment of DIMPIE data sets, of the same database,
with a temporal coverage in green (1975) and to the
left there is a blue data set (Collection moisissures
IFV), whith temporal coverage of 2008 in green. So
both databases and datasets are related by the hub
node.
Figure 4: A zoom of different origins and scale matching
with a hub node.
Weakness: There is no systematic way of filte-
ring origins and scales.
3.2.2 Operation: Common 2
Given the metadata catalogue,
When the ecologist wants to discover relationships in
a document of potential interest;
Then starting from operations to match data sets, fil-
ter the desired documents.
Weakness: In our case study the metadata source
has not the details of each document. It is necessary
to collect the metadata information of the document
in the meta catalogue.
3.2.3 Operation: Common 3
Given a data set,
When the ecologist wants to interpret the semantic
meaning of relationships without the need to know
the meta-model;
Then to dig in the relationships without an explicit
relationship label
Test:
START d1=node(*)
MATCH (d1)-[*1..5]->(n)
WHERE d1.title =˜ "Donkey.*"
AND NOT n:Attribute
AND NOT n:Keyword
AND NOT n:TaxonomicClassification
AND NOT n:TaxonomicCoverage
RETURN d1,n
Assets: Figure 5 illustrates the great possibi-
lities of the graph approach to describe meta-model
semantics, without explicit knowledge of the model.
The clause MATCH (d1)-[*1..5]→(n) gets a maxi-
mum depth of 5 levels, and the result shows a max-
imum of only two levels of relations from the given
data set (node in blue). The rest of the MATCH clause
is restricting the results to the basic information and
the spatial temporal information of the visualization
operation in 3.1.2. Another interesting filter would be
to show the taxonomy and organizational relations of
the visualization operation in 3.1.3.
Figure 5: Semantic visualization of relations of a given data
set.
Weakness: The test command shows only out-
bound relations from the given data set. Eventually,
a more generalist operation shall ask the ecologist
COMPLEXIS 2017 - 2nd International Conference on Complexity, Future Information Systems and Risk
148
whether it is requested outbound, inbound or both re-
lations to or from a given data set.
3.2.4 Operation: Common 4
Given a data set,
When To guide the ecologist to understand the data
context and collection methods;
Then to dig in the collection and context information
of the data set.
Test:
START d1=node(*)
MATCH (d1)-[*1..8]->(n)
WHERE d1.title =˜ "Donkey.*"
AND NOT n:Address
AND NOT n:Person
AND NOT n:TemporalCoverage
AND NOT n:GeographicCoverage
AND NOT n:GPolygonOuterRing
RETURN d1,n
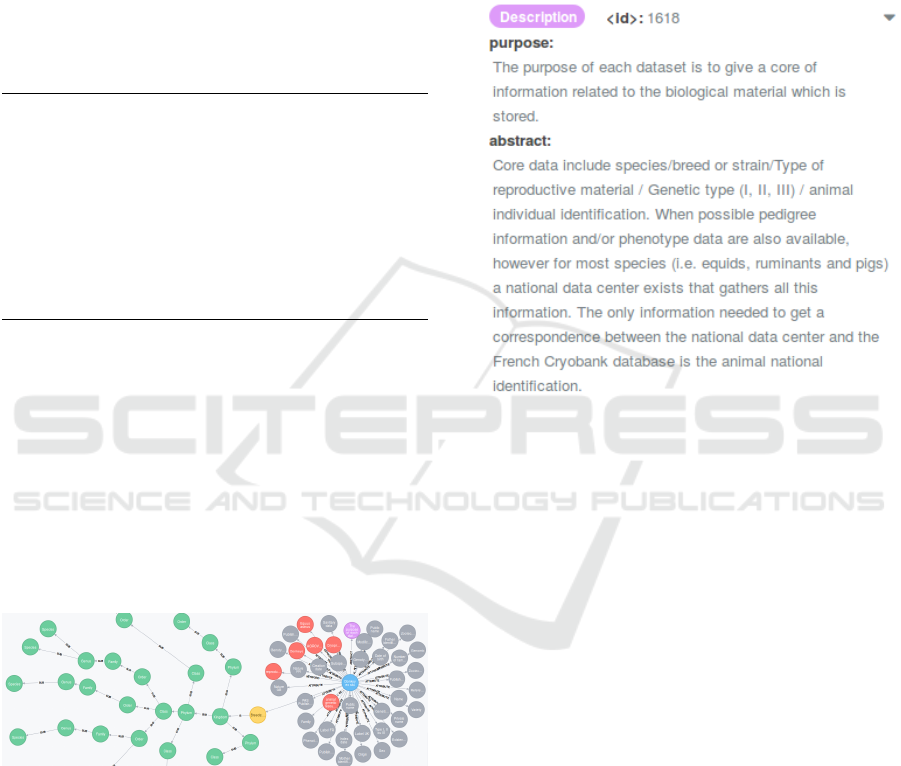
Assets: Given a data set in blue, Figure 6 shows
on one hand the information on collection methods
about taxonomic coverage (in yellow) and the corre-
sponding sub-graph of the taxonomic classification in
green. The names displayed are the category of the
classification, while by clicking in a particular green
node will give the corresponding value for the data
set. On the other hand, the context information is
shown in the attributes (in grey) of the documents in
the data set, as well as the keywords (in red) of the
data set. Spatial and temporal information would be
other interesting data context information.
Figure 6: Data context and collection methods.
Weakness: Even when we have the attribute list
of the documents, we don’t have a document cata-
logue, so this information is of little value. Eventu-
ally we should include the document catalogue in the
graph catalogue.
3.2.5 Operation: Common 5
Given a data set,
When the ecologist would like to estimate the quality
associated with the data, including the data sets
inter-calibration;
Then Show detailed information about the data qua-
lity of the corresponding nodes and inter-calibration.
Assets: Figure 7 shows the content of the Des-
cription node of a data set, which gives information
about the associated data quality and a few calibra-
tion details.
Figure 7: Data quality and callibration details.
Weakness: There is more quality and calibration
information in some of the Attribute nodes. However,
the name of the Attribute with valuable information
is dependent on the particular data set. Therefore, it
will be necessary to include a label in those Attribute
nodes which are related to calibration and data qua-
lity to display such nodes for a given data set so the
ecologist could browse the details.
3.2.6 Operation: Common 6
Given the metadata catalogue,
When the ecologist wants to be aware of the condi-
tions of access and use of data sets and more docu-
ments;
Then provide access policy to sets and objects
Weakness: In our case study the metadata source
only provides a secondary way to obtain the data, by
giving the contact person and web information for a
data set. So the ecologist can manually manage their
access to the data, and there is no automation in this
behaviour. This is a critical point to overcome the cur-
rent collection scope by tools and methods to enable
the access policy to the existing database objects.
Analysis on the Graph Techniques for Data-mining and Visualization of Heterogeneous Biodiversity Data Sets
149
4 SERVICE ARCHITECTURE
These tests have demonstrated the feasibility of graph
techniques to provide semantic features in visualiza-
tion and data mining of ecological metadata. Howe-
ver, to facilitate the ecologist’s discovery and visua-
lization, it also is necessary to provide high level ap-
plications alongside the existing graph database. The
weakness analysis on the common expected operati-
ons, points to the need for more generic operations
and systematic approaches, adapted to the characte-
ristic multidisciplinary database of the ecologist.
The required behaviour on several of the common
operations needs the inclusion of the metadata of the
documents, not only as generic information of the
data set.
• Common 2 and Common 4 need the integration
metadata of the documents in the catalogue.
• Common 6 is a critical operation to provide auto-
mated access policies to the documents.
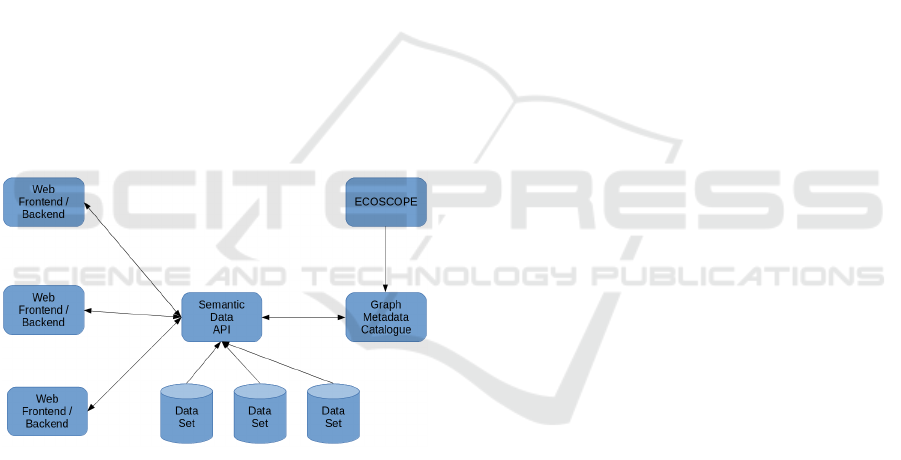
For these reasons the present paper proposes
a model-view-controller (MVC) service architec-
ture(Deacon, 2009) as show in Figure 8
Figure 8: Proposed MVC Service Architecture.
• View-Controller
– Web Frontend/Backend a common web fra-
mework for all the specific webs of the mul-
tidisciplinary studies, including basic frontend
forms, backend handlers and driver connecti-
vity to the common API. It supports the identity
management and it is the user entry point to the
data.
• Model
– Semantic Data API Including all the high le-
vel methods for visualization, data mining and
the gateway for data access policies to various
storages.
– Graph Metadata Catalogue With the exis-
ting meta model for data sets, but also inclu-
ding the metadata of the documents, as well as
the access policies between identities and docu-
ments.
– Data Set with secured access to the documents
– ECOSCOPE the metadata collection and stan-
dardization portal.
The developing, releasing and deployment of the
service components can be enabled by a container
compose (Mulfari et al., 2015) or virtual machine in-
frastructure manager (Caballer et al., 2015).
5 CONCLUSIONS
This paper presents preliminary studies on metadata
semantics. Indeed, it demonstrates improved meta-
data qualification needs using tools, standards and re-
commendations at both national (SINP [National In-
formation System on Biodiversity], RBDD [Network
of Research Databases]) and international levels (Me-
dOBIS [Mediterranean Ocean Biogeographic Infor-
mation System], OBIS, GBIF (Cryer et al., 2009),
Life-Watch, GEO-BON, etc.) or shared by other re-
search entities (i.e. IRD [Institute of Research for the
Development] or MNHN [National Museum of Natu-
ral History, Paris])
The proof of concept demonstrates the pontential
of graph databases to enable metadata visualization
and common operations in a scalable way through the
graph database capabilities in the horizontal relations.
Furthermore, it has identified the commonalities for a
high level semantic data API, into a service architec-
ture for several specific web front-ends, contributing
to economies of scale in the development and exploi-
tation of the information system.
The promising results encourage future work fol-
lowing the proposed service architecture, to facilitate
ecological studies in heterogeneous fields and topics
with their increasingly complex requirements.
ACKNOWLEDGEMENTS
The authors would like to thanks Alison Specht,
director of CESAB (FRB) and to Robin Goffaux
from FRB for they advisory and support to this pa-
per. This work is co-funded by the EGI-Engage pro-
ject (Horizon 2020) under Grant number 654142 and
by the Spanish MICINN project number TIN2014-
53234-C2-1-R. IndexMed consortium is funded by
the CNRS d
´
efi “VIGI-GEEK (VIsualisation of Graph
COMPLEXIS 2017 - 2nd International Conference on Complexity, Future Information Systems and Risk
150

In transdisciplinary Global Ecology, Economy and
Sociology data-Kernel)”, CNRS INEE through the
“CHARLIEE” project in 2015 and CNRS ”Mission
pour l’Interdisciplinarit
´
e” in 2016. Data used for
this article were obtained through ECOSCOPE me-
tadata tools. The authors acknowledge the support
of France Grilles for providing computing resources
on the French National Grid Infrastructure. Supple-
mentary acknowledgement to organisers of the EGI
workshop “design your e-infrastructure” which star-
ted this work.
REFERENCES
Ecoscope metadata portal.
http://ecoscope.fondationbiodiversite.fr/fr/portail-
de-metadonnees. Accessed: 2017-01-30.
Angles, R. and Gutierrez, C. (2008). Survey of graph da-
tabase models. ACM Computing Surveys (CSUR),
40(1):1.
Caballer, M., Blanquer, I., Molt
´
o, G., and de Alfonso, C.
(2015). Dynamic management of virtual infrastructu-
res. Journal of Grid Computing, 13(1):53–70.
Cryer, P., R., H., C., M., Nicolson, N., Tuama, ., Page, R.,
Rees, J., Riccardi, G., Richards, K., and Whitev, R.
(2009). Adoption of persistent identifiers for biodi-
versity informatics.
David, R., Feral, J.-P., Archambeau, A.-S., Bailly, N., Blan-
pain, C., Breton, V., De Jode, A., Delavaud, A., Dias,
A., Gachet, S., et al. (2016). Indexmed projects: new
tools using the cigesmed database on coralligenous
for indexing, visualizing and data mining based on
graphs.
David, R., Feral, J.-P., Gachet, S., Dias, A., Blanpain, C.,
Lecubin, J., Diaconu, C., Surace, C., and Gibert, K.
(2015). A first prototype for indexing, visualizing and
mining heterogeneous data in mediterranean ecology:
Within the indexmed consortium interdisciplinary fra-
mework. In Signal-Image Technology & Internet-
Based Systems (SITIS), 2015 11th International Con-
ference on, pages 232–239. IEEE.
Deacon, J. (2009). Model-view-controller (mvc) architec-
ture. Online][Citado em: 10 de marc¸o de 2006.]
http://www. jdl. co. uk/briefings/MVC. pdf.
Dodge, S., Bohrer, G., Weinzierl, R., Davidson, S. C., Kays,
R., Douglas, D., Cruz, S., Han, J., Brandes, D., and
Wikelski, M. (2013). The environmental-data automa-
ted track annotation (env-data) system: linking animal
tracks with environmental data. Movement Ecology,
1(1):3.
Flemons, P., Guralnick, R., Krieger, J., Ranipeta, A., and
Neufeld, D. (2007). A web-based gis tool for ex-
ploring the world’s biodiversity: The global biodi-
versity information facility mapping and analysis por-
tal application (gbif-mapa). Ecological Informatics,
2(1):49–60.
Lausch, A., Schmidt, A., and Tischendorf, L. (2015). Data
mining and linked open data–new perspectives for
data analysis in environmental research. Ecological
Modelling, 295:5–17.
McNutt, M., Lehnert, K., Hanson, B., and Nosek, B.
A.and Ellison, A. M. K. J. L. (2016). Liberating field
science samples and data. Science, 6277:1024–1026.
Mulfari, D., Fazio, M., Celesti, A., Villari, M., and Puli-
afito, A. (2015). Design of an iot cloud system for
container virtualization on smart objects. In European
Conference on Service-Oriented and Cloud Compu-
ting, pages 33–47. Springer.
Riesen, K. and Bunke, H. (2008). Iam graph database re-
pository for graph based pattern recognition and ma-
chine learning. In Joint IAPR International Works-
hops on Statistical Techniques in Pattern Recognition
(SPR) and Structural and Syntactic Pattern Recogni-
tion (SSPR), pages 287–297. Springer.
Solis, C. and Wang, X. (2011). A study of the characteris-
tics of behaviour driven development. In Software En-
gineering and Advanced Applications (SEAA), 2011
37th EUROMICRO Conference on, pages 383–387.
IEEE.
Taffoureau, E., Cohen-Nabeiro, A., and Touroult, J. (2016).
Metadata on biodiversity: definition and implementa-
tion. In DCMI International Conference on Dublin
Core and Metadata Applications: DC 2016 Confe-
rence.
Williams, D. W., Huan, J., and Wang, W. (2007). Graph
database indexing using structured graph decomposi-
tion. In Data Engineering, 2007. ICDE 2007. IEEE
23rd International Conference on, pages 976–985.
IEEE.
Analysis on the Graph Techniques for Data-mining and Visualization of Heterogeneous Biodiversity Data Sets
151
