Data Driven Web Experimentation on Design and Personalization
Rasika Irpenwar, Nakul Gupta, Rahul Ignatius and Mathangi Ramachandran
[24]7 Ilabs, Bangalore, India
Keywords: Design of Experiments, Big Data, Experimentation in Big Data, User Experience.
Abstract: In today's world for we use online medium for virtually every aspect of our lives. Companies run controlled
web experiments to make data driven decisions, to provide an intuitive online experience. We see a big
correlation between online customer behaviors and designs and personal treatment, which could be used to
create better customer engagement. In this paper we have studied the impact of design elements on chat
invites*, by running experiments on a small population, using machine learning algorithms. Based on this
we identify
significant elements and build the most opportune personalized messages on invites. Statistical
results show that, more visitors on the website accept chat invites which are personalized and optimized for
the design.
At [24]7, we have experimented extensively on user inter- face designs and journey based personalization
which resulted in positive impact on our annual revenue.
1 INTRODUCTION
At 24/7, we provide predictive chat* solutions
followed by various levels of optimization, which
involves a lot of re- search around design and
context. Design of Experiments (DOE) is one of the
important levers for optimization. DoE’s are
traditionally used in industrial engineering
/mechanical/ in manufacturing units to maximize the
outcomes.
We use DoE for online controlled
experimentation on chat invites / forms / web page /
feedback forms etc. The readings from DoE
(significant variables) give the optimized invites.
Since chat text came to be one of the significant
variables in DoE, we extended the scope of
experimentation to context driven text on chat
invites.
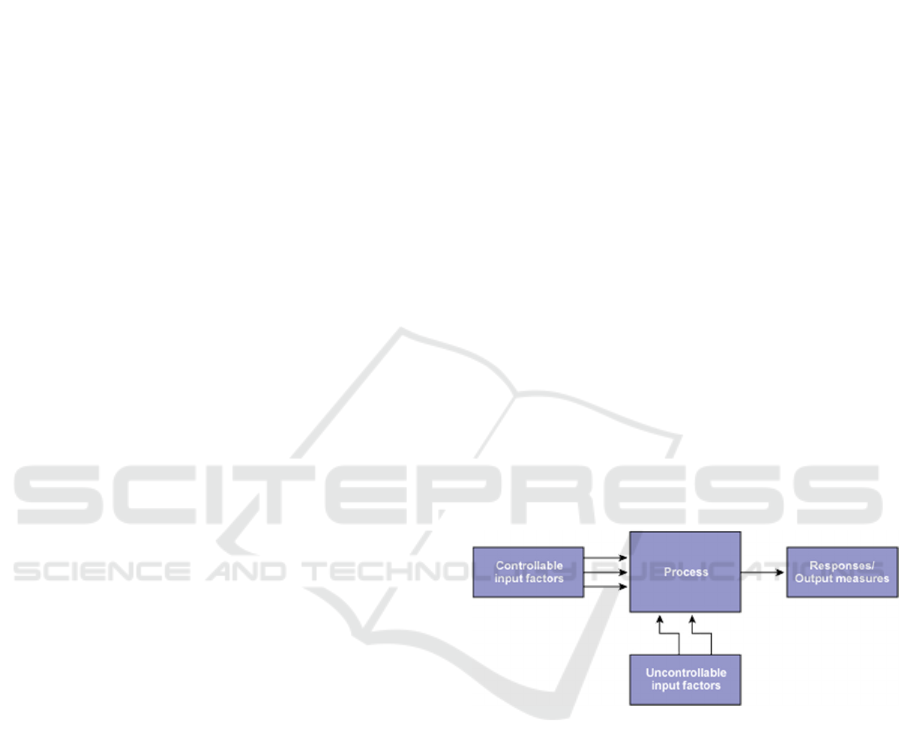
Defining Design of Experiments: helps in
breaking the experiment into components and
identifying which of those components would make
an impact on the conversions and we can test
different Variables/ factors in one experiment. Here
we know the factors affecting a process and the
output of that process. Unlike traditional A/B test or
one at a time test, where we would know the better
performing template but we would not know why it
is performing
better? DoE gives us an edge over other types of
experimentation and answers more granular detail of
what works.
Figure 1.
*image from online article.
https://www.isixsigma.com/tools-templates/design-
of-experiments-doe/design-experiments-
%E2%90%93-primer/
For ex: One of the retail client, we saw low
acceptance of the chat invites. Here our outcome
was to improvise the acceptance rate of the invite.
We have taken a Proactive chat invite as an example
be- low, proactive chat invite, hereafter referred as
chat invite are chat invitations that pop-up on a
website asking the user if she/he would like to chat
with a customer service representative. This is more
powerful than the button chat invites as these are
targeted at specific audiences who have high
152
Irpenwar, R., Gupta, N., Ignatius, R. and Ramanchandran, M.
Data Driven Web Exper imentation on Design and Personalization.
DOI: 10.5220/0006379801520158
In Proceedings of the 2nd International Conference on Complexity, Future Information Systems and Risk (COMPLEXIS 2017), pages 152-158
ISBN: 978-989-758-244-8
Copyright © 2017 by SCITEPRESS – Science and Technology Publications, Lda. All rights reserved

propensity to buy or need help in solving their
issues. Increasing the *acceptance rate is the
outcome here. * Acceptance rate= (Number of
customers who accepted the invites)/ (Number of
chat invites shown)
2 DEFINING THE OBJECTIVE
We need to answer the questions below:
a. Why do we want to run an experiment? What
is the outcome we want to measure?
b. What is the effect of experiments on
conversion?
c. Is he a potential buyer customer etc.?
d. What can be specifically done to reduce the
decline rate of the invite?
Design of Experiments can be used to find answers
in situations such as:
e. What are the main contributing factors to
enrich the user experience / improving conversions
etc.?
f. How well does the system/process perform in
the presence of noise?
g. What is the best configuration of factor values
to minimize variation in a response?
This can shed light on complex aspects of
decision making during the buying cycle of the
customer.
3 DETERMINING THE FACTORS
AFFECTING THE WHOLE
PROCESS
A lot of research on the brand goes into this. The
brand connects to its audience through different
medium like TV, radio, stores and online market.
The behavior on the different medium needs to be
studied with the brand guidelines. Factors are
determined after quite a lot research on usability
perspective, competitor analysis and call to actions.
Factors: Determining X parameters having Y
levels. Parameters are variables within the process
that affects the performance measure such as sound,
color etc. that can be easily controlled. The number
of levels to the parameters should be varied and
must be specified. Increasing the number of levels to
vary a parameter increases the number of
experiments to be conducted.
As we use Taguchi's method for designing the
experiment. Hence we should ensure that the factors
are independent of each other. Hence we need not
measure the interaction effect. The factors should be
independent of each other, if we are not measuring
the interactions.
For example: It can be anything from imagery, size,
place, font, color, shape. In experiment we used
these factors with 2 levels each.
Factors being: Sound (yes or no), text color (blue
vs red), content on the invite, transition, text cases
etc.
Here levels being: Yes vs no, for Sound.
Design the Experiment: Once we have the
factors and levels to it, we design our experiments.
We design a matrix in such a way that all the factors
and its levels are being experimented. There are
many ways in which a DOE can be applied, but here
we are sticking to Taguchi’s method to run
experiments. This approach uses the fundamental
idea of DOE, but simplifies and standardizes the
factorial and fractional factorial designs.
Fractional Factorial: is used to reduce the number
of experiments. A fractional factorial design of
experiment (DOE) includes selected combinations
off actors and levels; it is a representative subset of a
full factorial design. A fractional factorial DOE is
used when the number of potential parameters is
relatively large because they reduce the total number
of runs required. In general, higher-order
interactions are confounded with main effects or
lower-order interactions. Since higher order
interactions are rare, usually you can assume that
their effects are minimal and that the observed
effects are caused by the main effect or lower-level
interaction.
Taguchi’s way uses orthogonal arrays, as this makes
it possible to carry out fewer fractional factorial
experiments than full factorial experiments.
Orthogonal Arrays: are used to determine the
matrix. Orthogonal arrays are a set of tables of
numbers, each of which can be used to lay out
experiments for a number of experimental situations.
Types of Fractional Factorial Design: Orthogonal
(balanced) arrays, Latin Squares etc.
Example: Factors = 5 and levels=2, Full Factorial
Experiment = 2
5
= 32.
Full factorial leads to 32 experiments to run. Hence
using fractional factorial we can run 8 experiments.
Data Driven Web Experimentation on Design and Personalization
153
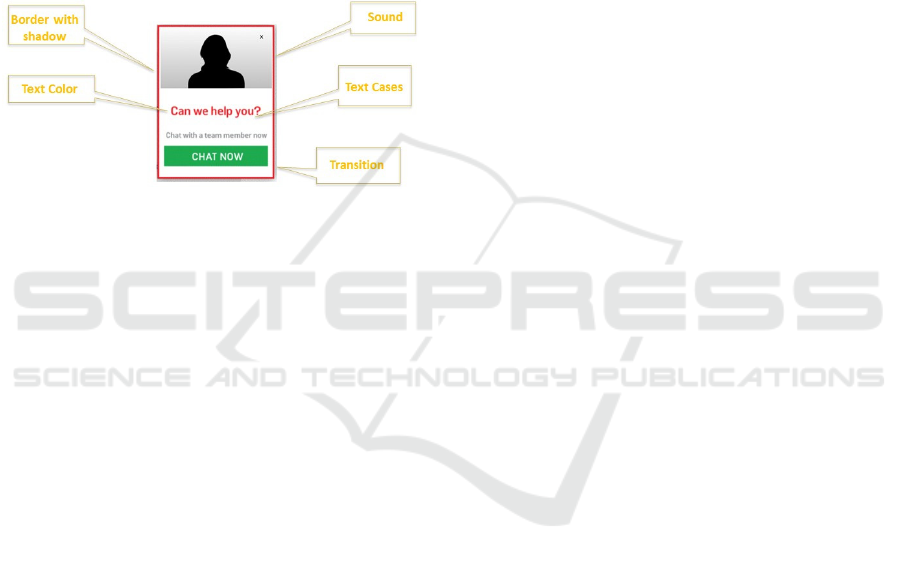
As our outcome is acceptance rate, we define it as
Acceptance Rate = fn (Text Color, Text Cases,
Transition, Sound (notification), Border with
Shadow)
Orthogonal arrays are used to determine the matrix.
Orthogonal arrays are a set of tables of numbers,
each of which can be used to lay out experiments for
a number of experimental situations.
We design a matrix in such a way that all the factors
and its levels are being experimented.
Fractional factorial to reduce the number of
experiments.
Figure 2.
4 TARGET AUDIENCE
The target audience is the ones who will actually see
these experiments. Knowing the target audience is
one more crucial step. Which means who do you
want to target, what % of your total population you
want to experiment with and when?
5 VOLUME ESTIMATES
Volume estimates can be determined as per the
number of experiments and duration of the
experiment. The traffic per page can be considered
and desired % can be given for each experiment.
Each experiment, falls into particular target
population (TP) bucket. We would a control group,
against which we would measure our test group
performance.
Example: Here each experiment gets an exposure of
10% of total traffic/population of the website.
Visitors are divided into 8 + 1 = 9 random groups i.e.
8 Test groups and one control group. 8 test groups
were show one of the 8 invites and the control group
was shown the existing invite.
6 EXPERIMENTATION
DURATION
During the course of the experiment, the data starts
to flow into our servers for analysis. We collect data
such as number of invites shown, number of invites
accepted etc. We ran this experiment for 2-3 weeks.
The duration of the experiment is based on the
number of experiments, traffic/volume, seasonality
etc.
7 ANALYZING DATA / RESULTS
The initial step is finding the significant variables
and finding the interaction between variables if any.
After this we interpret ANOVA results. ANOVA
(Analysis of Variance) is a statistical technique that
identifies factors significantly affecting the
experimental results.
ANOVA (Analysis of Variance) is a statistical
technique that identifies factors significantly
affecting the experimental result.
ANOVA consists of summing squares for
distributions of all characteristic values
(experimental data), unbiased variance,
decomposing this total sum into the sums of
squares for all factors used in the experiment,
calculating unbiased variances through the sums of
squares for all factors over their DOF and
searching which factors significantly affect
experimental results by analyzing the error
variance.
For example: Of the original 5 variables which we
experimented, only two are statistically significant
variables.
• Sound: Invite with Sound (yes), was one of
the most significant variables
• Transition: Invite with middle right
transition was the second most significant
variable.
We analyzed the data using Generalized Linear
Model (GLM) and ANOVA.
GLM Model to estimate the effect of factors on
Acceptance Rate
Y
i
= β
0
+ β
1
x
i
+ e
i
‘k’ factor ANOVA Test of significance of factors
COMPLEXIS 2017 - 2nd International Conference on Complexity, Future Information Systems and Risk
154
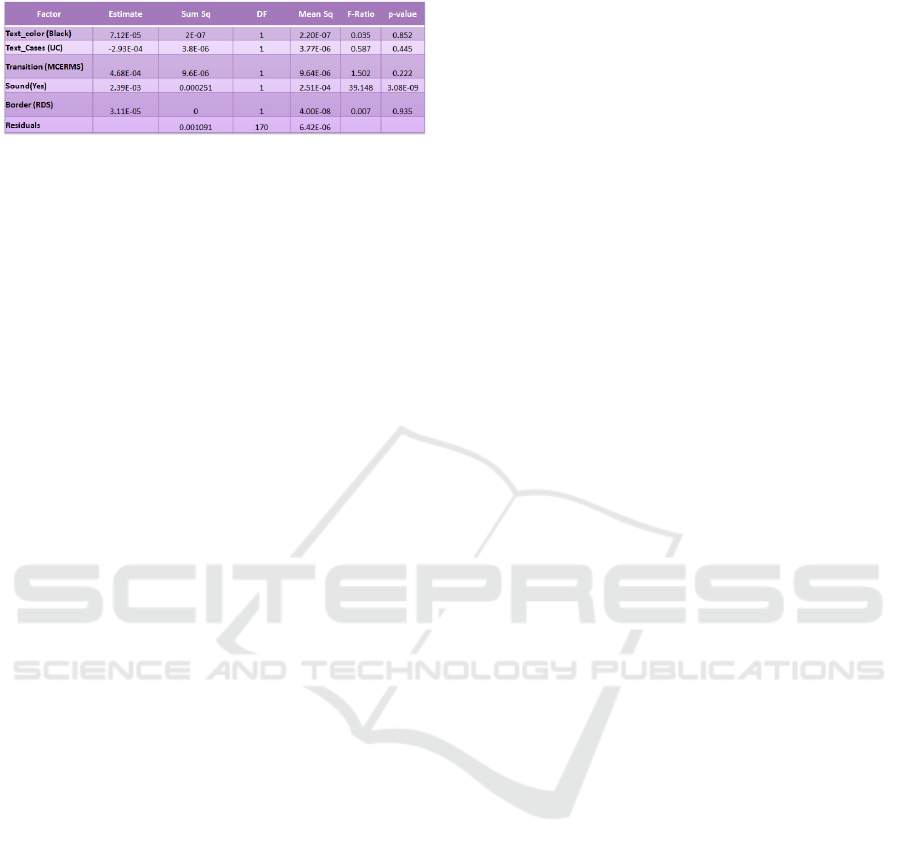
Table 1.
Acceptance: 14.3\% incremental chat assisted
sales over the control group. The best combination
had the sound and transition. Wherein text color,text
cases, border were not the significant variables; they
had no impact on the acceptance rate.
Post Experiment Results: The winning invite was
ramped up to the whole population. And further used
for contextual invites.
Impact of DOE: The winning invite is then used as
base invite for any initiatives.
After running the experimentation with different
design variables on the invite and arriving on the
optimized design, the next phase involves
experimentation on the invite text. In the following
section of the paper we will discuss the
experimentation on invite text based on customer web
journey, personalization etc. to bring in value to
business with more acceptance rates on chat invites
8 OPTIMIZING CONTENT ON
CHAT INVITES BASED ON
USERS JOURNEY
Personalization of experience for end users is of
utmost importance for any industry in the online
space. Companies typically use significant amount of
data from the below streams to identify segments and
devise their targeting strategy.
• Demographics Age, Gender, Employment
status, etc.
• Psychographic Lifestyle, Interests, Opinion,
etc.
• Behavioral Browser History, Purchase
History, Internet Behavior, etc.
*In the following sections of the paper personalized
invites should be referred as chat invites shown to the
customers on a website based on the intent of the
customer.
Personalized invites introduces a sense of relevance
in otherwise generic chat invites and results in more
people accepting the chat invites as compared to the
number of people who would have accepted the chat
invites in generic scenario (i.e. without
personalization). Personalized chat invites generally
works on top of already existing predictive data
models, which identifies what customers should be
shown chat invites.
For example: Following are some of the contexts
which were passed in the proactive invites on the
website of one of our retail clients. Following are
some of the contexts which were passed in the
proactive invites-
”Welcome Back” on the pro-active chat invite to a
repeat visitor
”Looking for Furniture?” or ”Buying a washing
machine?”
Above exercise was intended to accomplish higher
chat acceptance rates by showing personalized
invites based on customers intents.
9 UNDERSTANDING
CUSTOMER INTENTS,
QUERIES AND TARGETED
SEGMENT
We identified top intents by analyzing one month of
chat transcript data. High volume intents revolved
around seeking help on product (e.g. product info,
Comparison, offers, features etc.) and cart related
activities.
To roll up intents under meaningful boundaries we
took following into consideration
• Understanding and analyzing the granularity
of in- tents.
• Finalizing the granularity of personalized
invites de- pending on the variations in
resolution types, query types etc.
• Estimating the volumes of the finalized
intents
We dived deep into these intents using a
supervised learning approach and identified top
products which drive high chat volumes.
We started with identifying the intents based on
chat acceptance on various pages, manually tagged
transcripts to intents and then ran a supervised text
classification to estimate the volumes. Below are
some statistics used in above analysis :
• Chat volume: 25,000 to 30,000 sales chat
transcripts.
Data Driven Web Experimentation on Design and Personalization
155
• Chats from Product Pages:
∼
90% of sales
chats
• Chats from product pages:
∼
86% (In
which customer come to chat about
product)
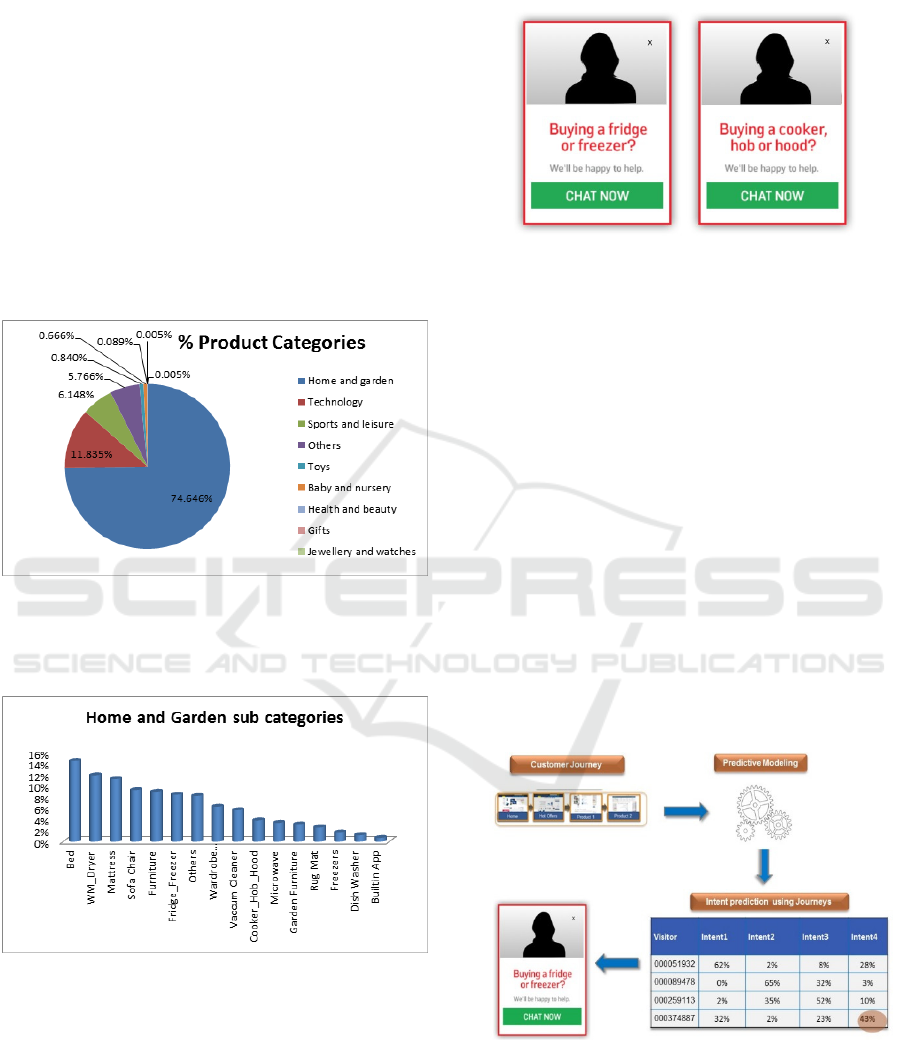
Top Product Categories:
*We choose ”Home and Garden”, ”Technology”,
”Sports and Leisure” and ”Toys” categories for
personalized chat invites since most of the chat
volumes fell under these product Categories.
*Since ”Home and Garden” Category was one of
the biggest chat drivers we broke it down further
into product sub product categories.
Figure 3.
Following are the intent categories for which
personalized invites were created:
Figure 4.
Below are few examples
Figure 5.
10 INTENT PREDICTION AND
INTERVENTION
We attributed concatenated customer web journeys
and other customer attributes and used supervised
text classification algorithms to predict customer
intents real-time.
Examples:
1.
A visitor whose last two pages were
refrigerator pages and has spent at least 30
seconds on the current page would be shown
a personalized refrigerator invite.
2.
A visitor, who spends at least 40 seconds
on a hob page, will be shown a personalized
hob invite.
Figure 6.
11 EXPERIMENTATION
Based on randomization algorithms visitors were
COMPLEXIS 2017 - 2nd International Conference on Complexity, Future Information Systems and Risk
156
made to fall under test and control groups.
1.
Test Group: Where a set of personalized invites
were thrown based on customers journey. If the
customer is not eligible for a personalized invite
then they are shown generic “Can we help you?”
invite.
2.
Control Group: Generic “Can we help you?”
message was shown in all the cases irrespective of
customer’s web journey.
Some Statistics:
Total Number of chats (Sales) per day:
∼
1100
Chats on Product Pages:
∼
90% of 1100 = 990
Test Group = 10%
Chats per day for Experimentation = 10% of
990 =
100
Personalized chats in test group:
∼
80%
* To establish which of the group has better
acceptance rate among test and control with 95%
confidence we need approximately 1300 data points,
which in this case is represented by number of chats
No. of days of Experimentation = 1300/80:
∼
2.5
weeks
12 DATA ANALYSIS AND
RESULTS
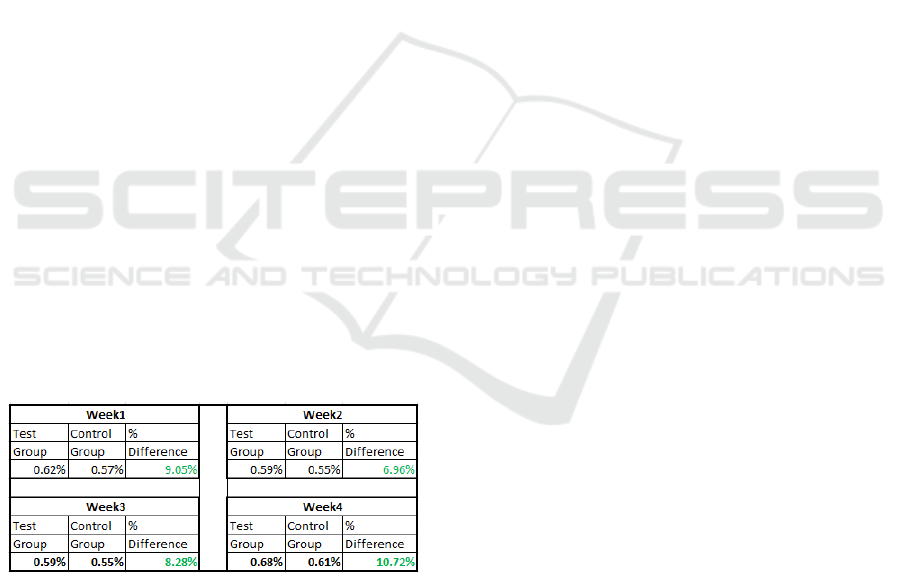
We observed the acceptances rate for both the groups
for a period of 4 weeks and found that the test group
with personalized invites had an overall impact of
∼
9% increase over control group.
Figure 7.
Significance Testing: We performed significance
testing on Acceptance rates on a daily basis and
concluded that the Test Group Acceptance rates are
greater than Control Group acceptance rates at p <
0.001, using Wilcoxon Test.
13 CONCLUSION AND FUTURE
OPTIMIZATION
As the above example shows we can measure the
impact of factors being changed.
• DOE is economical technique as it takes
less runs of experimentation. Results can be
obtained based on a performing small
number of experiments.
• These well-designed experiments will yield
statistically sound interpretations. For
further work we are Optimizing content
based on user journey and personalization
of the invites. Also, we are trying new
approaches using other statistical methods,
introducing new tools to fasten the process.
Also implementing new innovative ideas
and techniques to make the system for
robust and getting good conversions.
• For further work we are Optimizing content
based on user journey and personalization
of the invites.
• Also, we are trying new approaches using
other statistical methods, introducing new
tools to fasten the process.
• Implementing new innovative ideas and
techniques to make the system for robust
and getting good conversions.
14 COMMON CHALLENGES
• Identifying the variables. The system
should be robust and strong to take up these
changes.
• Read out time can vary and also interfere
with seasonality or other changes.
• Overall coherence with the site in defining
the factors.
• Nearly similar intents like setting up vs
setting password for an email client
• Performance challenges after going live,
due to change in interface.
REFERENCES
Kohavi, Ron, Henne, Randal M and Sommerfield, Dan
Data Driven Web Experimentation on Design and Personalization
157

Practical Guide to Controlled Experiments on the
Web: Listen to Your Customers not to the HiPPO The
Thirteenth ACM SIGKDD International Conference
on Knowledge Discovery and Data Mining (KDD
2007). August 2007, pp. 959-967.
Engineering Methods for Robust Product Design: Us- ing
Taguchi Methods in Technology.
Solutions Manual Design and Analysis of Experiments
Book by Douglas Montgomery.
M. van der Laan and S. Rose Targeted Learning Causal
Inference for Observational and Experi- mental Data.
New York, NY: Springer Publishing Company, 2011.
https://www.isixsigma.com/tools- templates/design-of-
experiments-doe/design- experiments-
Design and Analysis of Experiments 2015 conference.
https://community.jmp.com/t5/JMP-Blog/Design-and-
Analysis-of-Experiments-2015-conference/ba-p/30486
Kohavi Ron : Controlled experiments and outcomes
http://www.ruxizhang.com/uploads/4/4/0/2/44023465/
puzzlingoutcomesincontrolledexperiments.pdf
Optimizley blog: https://blog.optimizely.com/2010/
11/29/how-obama-raised-60-million-by-running-a-
simple-experiment/
COMPLEXIS 2017 - 2nd International Conference on Complexity, Future Information Systems and Risk
158
