
An Image Data Learning Method by Discriminating Multiple ROIs Data
Patterns for Extracting Weather Information
Jiwan Lee, Sunghoon Jung, Kijin Kim, Minhwan Kim and Bonghee Hong
Department of Electrical and Computer Engineering, Pusan National University, Busan, South Korea
Keywords:
Image Data Analysis, Weather Information, Time-series Data Analysis, Learning, Clustering, CCTV Images.
Abstract:
In order to generate weather information about rainfall and foggy visibility through analysis of CCTV images,
the analysis on the changing patterns of time-series image data is a new approach to generating weather in-
formation from CCTV images. This paper demonstrates a method to generate optimum ROIs for extracting
subtle weather image changes caused by fog and rainfall. It suggests the optimum ROI size and distance inter-
val between ROIs through experiments. Finally, a clustering-based method for extracting weather information
is proposed that has different data pattern difference between ROIs as a learning model, which is based on the
suggested optimum ROI size and interval.
1 INTRODUCTION
Weather information on dangerous roads such as rain-
fall on the forward side of the moving car while driv-
ing, precipitation and foggy visibility is highly valu-
able for the safety of drivers. This study suggests
that the extracted date pattern data based on image
changes is a viable option. Furthermore, applying pat-
tern graphs as a clustering learning model will facili-
tate the extraction of rainfall amount and foggy visi-
bility to be computed from real-time CCTV images.
The related studies that extracted weather infor-
mation from CCTV images(Beung Raul Park and
Lim, 2007; Beung Raul Park, 2007), or those that
measured foggy visibility(Bong-Keun Kim and Lee,
2008) were mainly based on discrimination of the
converted values of hue, saturation, and brightness.
However, these existing methods do not measure the
distance of foggy visibility and precipitation by an-
alyzing the time-series data of CCTV images. An-
other problem present in the existing method is the
reduced accuracy caused by the averaging of the con-
verted values for entire CCTV images, as it selects
entire CCTV images as Region Of Interest (ROI).
In order to extract time-series data changes from
CCTV images, the problem of configuring the time
interval between frames and selecting a target area
within an image for change detection should be ad-
dressed. The configuration of the time interval for
change detection may be determined through a rel-
atively easy experiment, whereas there are various
options such as an entire screen, specific ROI, and
multiple ROIs for the selection of target detection
area. Time-series data pattern appears differently de-
pending on the image characteristics influenced by
selection of target regions, in other words, based on
whether the target area is the sky, forest, or roads.
This paper suggests a method for identifying ROIs
and determining the number of ROIs that demon-
strate time-series images changes following weather
changes through real data analysis and experiments.
In this study, experiments were conducted to find out
what the optimal number of ROIs within a specific
CCTV images is. By considering different change
patterns for each weather condition concerning road
area and forest area, the size and number of optimal
ROI size and interval were determined in order to dis-
criminate slightly image change patterns.
The image data differences between multiple
ROIs result in different pattern graphs that would be
used for determining weather information. Pattern
graph changes reflecting subtle image changes be-
tween multiple ROIs were rendered into a clustering
learning model to demonstrate the discrimination of
weather information.
This paper consists of the following contents:
Chapter 2 introduces related studies. Chapter 3 ex-
plains the data used for this study and the data anal-
ysis results. Chapter 4 describes the method for se-
lecting multiple ROIs using CCTV images. Chapter
5 suggests the technique for producing weather in-
formation through clustering patterns. The Chapter
438
Lee, J., Jung, S., Kim, K., Kim, M. and Hong, B.
An Image Data Learning Method by Discriminating Multiple ROIs Data Patterns for Extracting Weather Information.
DOI: 10.5220/0006380404380443
In Proceedings of the 2nd International Conference on Internet of Things, Big Data and Security (IoTBDS 2017), pages 438-443
ISBN: 978-989-758-245-5
Copyright © 2017 by SCITEPRESS – Science and Technology Publications, Lda. All rights reserved
7 presents the conclusion of this study and future re-
search plan.
2 RELATED STUDIES
Studies on the extraction of road weather information
from CCTV images are mainly categorized into two
types the entire image and specific areas of the image
depending on ROI selection methods(Jonsson, 2011;
Jokela et al., 2009). In the case of selecting the entire
image as ROI, the accuracy varies depending on the
components of the image such as roads, forest, and
sky areas, and their proportion. Consequently, there
arises the problem in which the selection of target area
has shown deep influence of data pattern changes for
example, forest or road. Therefore, this option is not
viable for suggesting a detailed method for area selec-
tion.
For the extraction of weather information, char-
acteristics such as RGB average, temperature, and
humidity information, HSV value, and the amount
of edge pixels(Yongdeok Sin and Lee, 2015) from
CCTV images were utilized for conversion of the
extraction values. In practice, the converted values
extracted from still images at specific time points
are commonly used. This method is not based on
the time-series change patterns of CCTV images that
show time-series changes in weather, and thus, it is
unable to extract changes in rainfall and foggy visi-
bility.
3 IMAGE TRANSFORMATION
METHOD FOR WEATHER
DISCRIMINATION
In this paper, real images of 480 x 272 pixels in reso-
lution at 24 fps taken from CCTV data were used. The
feasibility of extracting changing weather information
was assessed with real data through the adjustment of
various image characteristics and parameters.
Various image transformation values were ex-
tracted in order to extract useful characteristics ap-
pearing on CCTV images according to weather
changes. The characteristics of image transforma-
tion values were analyzed in road area and forest area
in accordance with weather conditions sunny, cloudy,
light rain, and heavy rain. The analysis results showed
that both the brightness value through HSV color
space changes and the amount of edge within ROIs
through edge extraction expressed weather changes
satisfactorily.
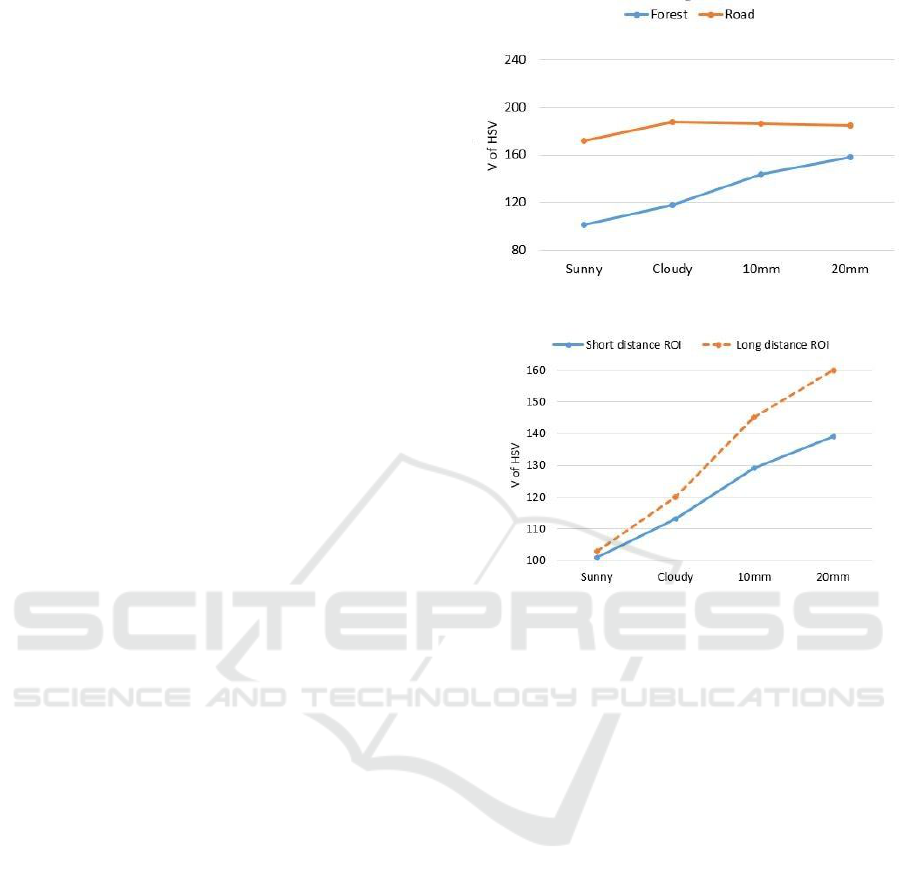
Figure 1: Comparison of brightness values with each
weather condition in forest and road areas.
Figure 2: Changes in brightness according to short dis-
tance/long distance ROIs.
As shown in Figure 1, the brightness value is
lower in the sunny condition than in the cloudy con-
dition in the forest area. Higher values were extracted
for brightness in the rainy conditions than the cloudy
one. However, in the case of roads, no specific pattern
was extracted for each weather condition, and the pat-
terns overlapped with one another. In other words, no
characteristics of sunny, cloudy, light rain, and heavy
rains were demonstrated in the road area. This result
shows that using the brightness data from the forest
area helps determine the discrimination of different
weather changes.
We observe the changes in brightness according to
short distance or long distance ROIs, as the results in
Figure 2. In the sunny condition, the brightness values
barely changed between short distance ROI and long
distance ROI. As the weather gradually worsened to
cloudy, and further to 5, 10, 15, and 20 mm rainfall,
the brightness values between the short distance and
long distance ROIs eventually increased. This signifi-
cant difference in brightness values indicates that long
distance areas become blurry and less visible when
weather changes occur.
An Image Data Learning Method by Discriminating Multiple ROIs Data Patterns for Extracting Weather Information
439
4 METHOD FOR MULTIPLE ROI
SELECTIONS
In this chapter, forest area favourable for weather dis-
crimination was identified through image segmenta-
tion (Meyer, 1992). Further, a technique for auto-
matically selecting multiple short-distance and long-
distance ROIs within given areas is suggested.
In order to identify graph patterns for subtle
changes such as a change in rainfall, it is more effi-
cient to select a multiple numbers of ROIs at different
distance intervals rather than a single ROI. Therefore,
a method was devised for determining the optimum
number of and an optimum interval for ROIs.
The straight lines of roads are all parallel in reality,
but they come to cross at a single vanishing point on
CCTV images through the projective transform. In
order to select multiple ROIs along the direction of
the roads, a vanishing point was first drawn out of the
straight lines of the roads. A segmented line which
passes through this vanishing point and overlaps with
the forest area was then drawn, which becomes the
reference line for multiple ROIs.
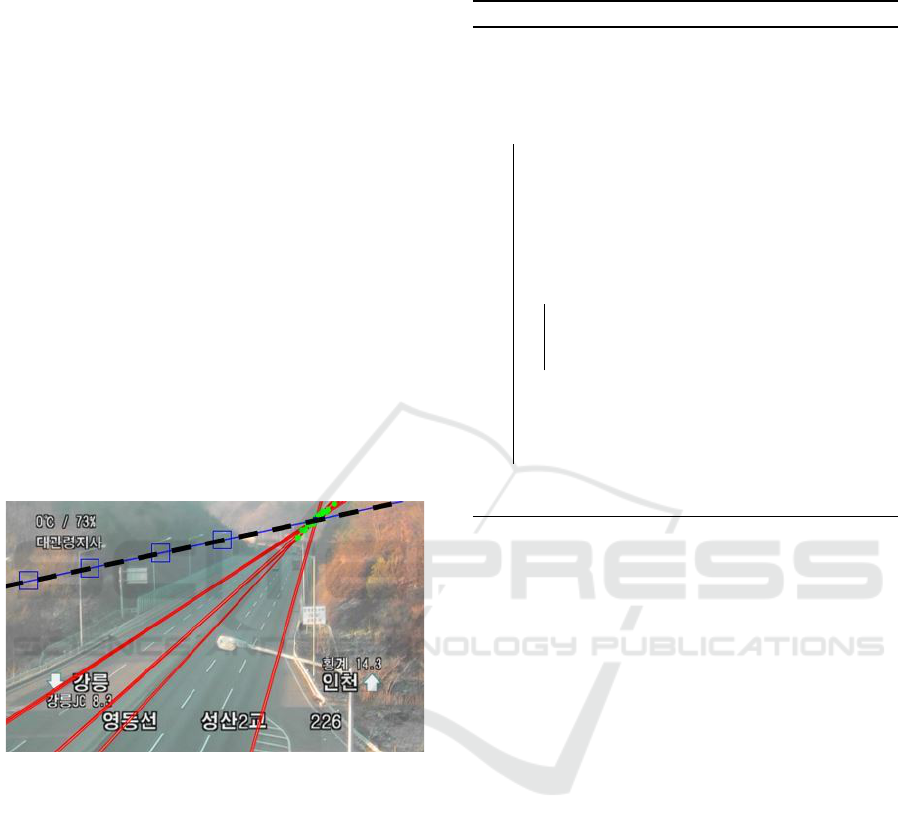
Figure 3: Example of multiple ROIs.
In order to calculate the vanishing point on
straight road lines, straight lines within the segmented
road areas were identified by the Canny edge de-
tector(Canny, 1986) and Hough transform(Duda and
Hart, 1972). The average point of the intersection
where the identified straight lines cross one another
was selected as the vanishing point of the roads. The
reference line for multiple ROIs stretches through the
designated vanishing point with a gradient ranging
between 0 and that of straight lines. It is determined
with a line that overlaps most with the target detection
area. ROIs were selected by moving the coordinates
from short distance to long distance along the deter-
mined reference line. In the mean process of the ROI
selection, those areas were excluded when their pro-
portion of non-target areas within the ROI exceeded
a certain ratio. In Figure 3, the dotted line represents
Segment Line, and the squares indicate candidats of
multiple ROIs.
Algorithm 1: Producing multiple ROIs.
Input: Segment Line SL, , Size s
Output: multiple ROI ROIs
1 R
i
is a first position of ROI, where i is 1
2 Centroid Point (CP) of R
i
is represented by CP
i
3 while until ROIs are generated do
4 CP
i+1
is a point moved by DI from CP
i
on
SL
5 LTP
i+1
are (x of CP
i
size/2, y of CP
i
size/2)
6 RBP
i+1
are (x of CP
i
+ size/2, y of CP
i
+
size/2)
7 while until choose optimal distance do
8 Move CP
i+1
to right along segment line
9 Compute difference of brightness
between R
i
and R
i+1
10 end
11 Choose optimal distance between R
i
and
R
i+1
12 i = i +1
13 end
14 Return ROIs
Algorithm 1 is to produce multiple ROIs around
the roads in the forest area, which are identified
through the image segmentation. This algorithm takes
segment line, size of ROI for input parameters. Lines
1 and 2 set the initial ROI. Lines 3 through 6 are logics
for selecting ROIs after the second one. A square co-
ordinate consists of a left top and right bottom. They
are generated with the coordinate of a middle point
moved by the ROI interval from the middle point of
the previously generated ROI along the segment line
in Line 8. In Line 11, we can find out optimal distance
between ROIs by comparing difference of brightness.
Finally, Line 14 ends the algorithm when the ROIs are
generated.
5 METHOD FOR GENERATING
WEATHER INFORMATION BY
IMAGE DATA PATTERN
CLUSTERING BASED ON
MULTIPLE ROIS
In this chapter, a difference graph of image transfor-
mation data for multiple ROIs is demonstrated. Then,
the new algorithm that discriminates weather condi-
tions using the clustering technique is described.
IoTBDS 2017 - 2nd International Conference on Internet of Things, Big Data and Security
440
5.1 Selection of Multiple Optimum
ROIs from CCTV Images
According to the multiple ROI algorithms from the
Chapter 4, the optimum number of ROIs and their
size suitable for CCTV images from each region are
automatically selected. The results of the experiment
suggested 14-20 ROIs to be the optimum number per
CCTV image, and the ROI size of 25x25 was most
suitable.
5.2 Extraction of Time-series Changes
in Image between Multiple ROIs
Time series image data are defined as graph
g
i
={v
1
,v
2
,v
3
,...,v
n
}, where n is number of the frame,
and i is an id for identifying ROI on the CCTV image.
The component v
n
of graph g represents the represen-
tative brightness value of the nth frame. Representa-
tive brightness can be set to the minimum, maximum,
or average brightness value of the pixels of ROI. For
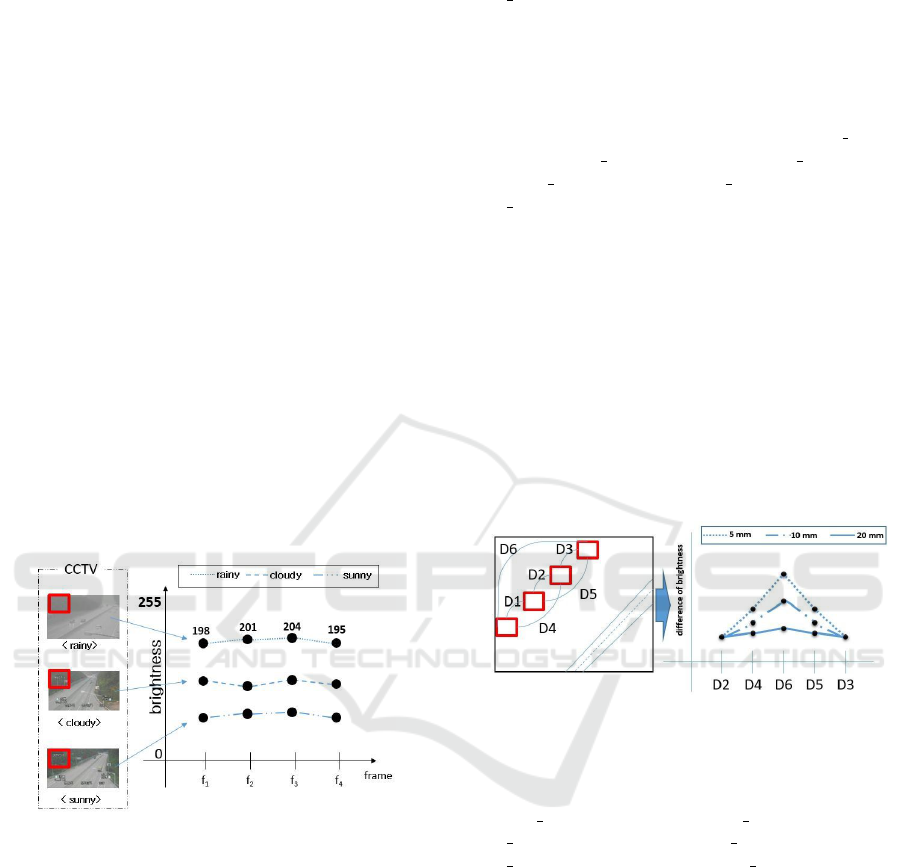
example, if the time-series image data of the rainy
image in Figure 4 is represented in a graph, it is ex-
pressed as g
1
={198, 201, 204, 195}.
Figure 4: Image transformation pattern graph of time-series
image data per ROI.
Time series transformation image graph is gener-
ated in two different forms for analysis. First, a pat-
tern graph is generated for image transformation val-
ues at the same region with a regular time interval as
in Figure 4. This is clustered to discriminate sunny,
cloudy, rainy, and foggy conditions. The clustering
results would group the image transformation value
patterns, which express the weather changes of the
same place at different time frames.
Second, a pattern graph for image transformation
values of the configured long distance, mid, and short
distance areas is generated with the selected multi-
ple ROIs in a single CCTV image. The graph of dif-
ference in image transformation values of the long
distance, middle distance, and short distance areas at
the same time frame in the same ROI is defined as
Diff Graph (R1, R2). The input parameters R1, and
R2 of this function represent two different ROIs. As-
suming that different graphs are extracted from the
CCTV images of a single region, a total of 6 differ-
ence graphs are generated. For example, with a to-
tal of 4 multiple ROIs R1, R2, R3, and R4 in Fig-
ure 5, a total of 6 difference graphs as Diff Graph
(R1, R2), Diff Graph (R2, R3), Diff Graph (R3,
R4), Diff Graph (R1, R3), Diff Graph (R2, R4), and
Diff Graph (R1, R4) are generated.
5.3 Measuring Similarity between
Graphs of each Weather Condition
and Producing Weather
Information through Hierarchical
Clustering Technique
Weather conditions are discriminated by comparing
the image transformation pattern graphs of each ROI
generated in section 5.2 for multiple ROIs with those
clustered per weather condition.
Figure 5: Example of difference graphs extracted from mul-
tiple ROIs pattern graph.
In order to perform hierarchical clustering,
the similarity between the six generated graphs
as Diff Graph (R1, R2), Diff Graph (R2, R3),
Diff Graph (R3, R4), Diff Graph (R1, R3),
Diff Graph (R2, R4), and Diff Graph (R1, R4)
should be calculated as shown in Figure 5. The
similarity is calculated using the Euclidean distance
which is frequently used for calculating shortest
distance. The equation is given below.
similarity =
n
∑
i=1
(v
i
o f Graph
p
, v
i
o f Graph
k
), (1)
here, n represents the total number of frames. All the
six difference graphs similarities with the clusters for
past weather conditions were calculated to identify
the most similar cluster.
Algorithm 2 describes to produce weather infor-
mation using the clustering technique based on mul-
tiple ROIs. Line 1 through line 3 produce image
An Image Data Learning Method by Discriminating Multiple ROIs Data Patterns for Extracting Weather Information
441
transformation graphs for four multiple ROIs from
CCTV images. Line 4 to line 6 are stages of extract-
ing difference graphs using the information of the im-
age transformation graphs of the previously generated
four multiple ROIs. Line 7 through line 11 compare
all the similarities between the difference graph for
past weather condition clusters and those of the im-
ages used as input data. Line 12 generates clusters for
each weather condition using the hierarchical cluster-
ing() function. At the final stage of line 13, the past
weather condition cluster, which is most similar to the
difference graphs of the inputted images, is identified.
The corresponding weather condition is returned, and
weather information is produced.
Algorithm 2: Production of weather information
using the clustering technique based on multiple
ROI.
Input: Historical Difference Graph HDG,
Current CCTV video cv, Multiple ROI
mROI
Output: Weather Condition WC
1 for each roi ∈ mROI do
2 Extract image data from roi in CCTV video
Then Make graph data g Add g to G
3 end
4 for each g ∈ G do
5 Calculate difference graph Diff Graph(g,
g + 1) Then Insert data into difference
graph dg Add dg to Difference Graph DG
6 end
7 for each dg ∈ DG do
8 for each dg‘ ∈ HDG do
9 result = calculating similarity between
g and g Add result to DistanceMatrix
10 end
11 end
12 Clusters C= hierarchical clustering(
DistanceMatrix)
13 return (finding weather condition in C)
6 EXPERIMENT
6.1 Comparison of Weather
Characteristics by ROI Size
A comparative experiment was performed in this sec-
tion by varying ROI sizes from CCTV images. The
experiment conditions were the interval of ROIs to be
set at 150, with the number of ROIs fixed at 4. The
brightness value was extracted from each ROI area.
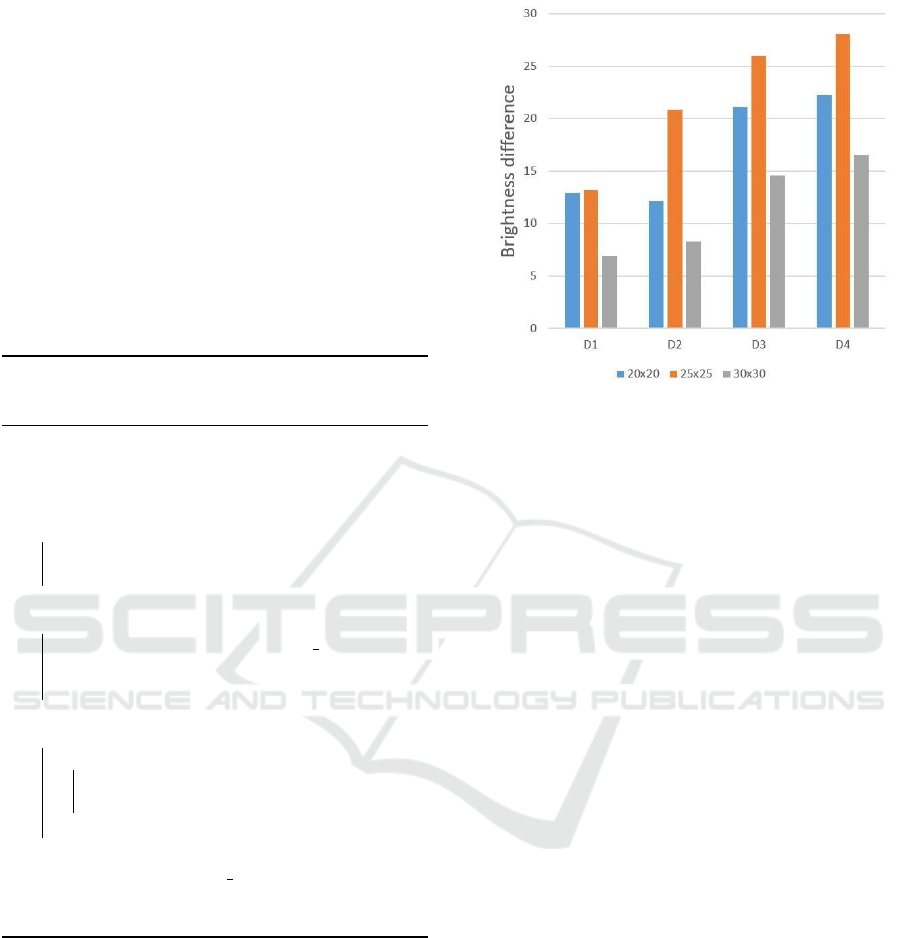
Figure 6: Comparison of brightness value difference ac-
cording to ROI sizes in precipitation as weather condition.
The X axis of the graph in Figure 6 can be ex-
pressed as domain D
n
(n is a natural number). D
n
represents the distance between two ROIs, and bigger
n values indicate the farther distance between ROIs.
There are 4 values on the X axis, namely, D1, D2,
D3, and D4, in the graph in Figure 6. The function
for calculating Y values corresponding to D
n
is as be-
low:
f (n) = |BT o f ROI
n−1
− BT o f ROI
n
|, (2)
where BT is brightness. This function is used to cal-
culate the difference between the brightness values of
2 ROIs. Figure 6 shows the experiment results of
D1, D2, D3, and D4 with ROI sizes 20x20, 25x25,
and 30x30. The ROI size of 25x25 yielded the great-
est difference between the brightness values. In or-
der to identify the characteristics of images appear-
ing depending on short distance/long distance ROI of
each weather condition, it is most suitable to deter-
mine them by applying the ROI size of 25x25.
6.2 Determination of Precipitation
using the Generated Multiple ROI
Information
In this section, the optimum ROI size and interval ob-
tained through the experiment in 5.1, and 5.2 were
applied to the algorithm proposed in Chapter 4. Us-
ing the generated multiple ROIs, the level of precip-
itation was determined through this experiment. The
data used for the experiment were categorized into 3
types 20 mm, 15 mm, and 7 mm by screening the
CCTV image data for precipitation with the observa-
tion measurement.
IoTBDS 2017 - 2nd International Conference on Internet of Things, Big Data and Security
442
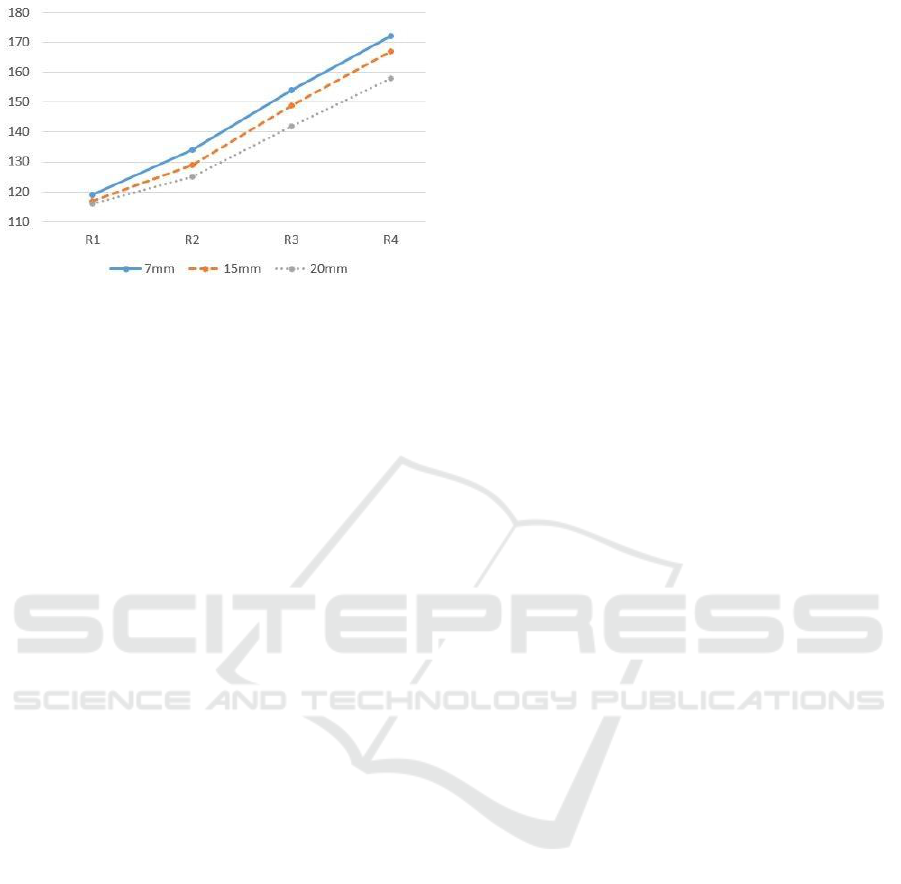
Figure 7: Changes in brightness values according to precip-
itation amount.
Figure 7 shows the experiment results of changing
brightness values according to precipitation amount.
The X axis of the graph indicates multiple ROI val-
ues, a total of four regions expressed as R1, R2, R3,
and R4. The R4 is the longest distance of ROI. The
brightness values increase as the amount of rainfall
does in the experiment results. The reason for this
is because the background color turns blurry due to
rainfall, which subsequently increases the brightness
value. In this experiment, the brightness of 20 mm in
R1, R2, R3, and R4 was always higher than that of 15
mm and 7 mm. This provides the evidence in that the
brightness becomes higher as it rains more.
7 CONCLUSION
This study investigated ways to select multiple ROIs
that best demonstrate time-series changes caused by
weather changes. It was found that using multiple
ROIs is a key success factor for resolving the prob-
lem related to producing weather information based
on CCTV image data analysis. The results of the
experiments show that the ROI property information
was most suitable for discriminating weather condi-
tions when it was configured as 25x25 in size and
over 150-pixel distance. As the rainfall increased,
the brightness of CCTV images changed greatly, and
ROIs at farther distances yielded greater changes in
brightness value that were affected by precipitation.
As for the future application of this method for dis-
criminating weather condition using the multiple ROI
selection techniques, it is urgently required to refine
the clustering learning model of image transforma-
tion difference graph using existing past data with real
data references.
ACKNOWLEDGEMENTS
This work was funded by the Korea Meteorological
Administration Research and Development Program
under Grant KMIPA2015-4020.
REFERENCES
Beung Raul Park, J. T. L. (2007). Development of the
weather detection algorithm using cctv images and
temperature, humidity. Korea Multimedia Society,
10(2):209–217.
Beung Raul Park, S. N. and Lim, J. T. (2007). Multime-
dia: Development of the road weather detection al-
gorithm on cctv video images using double decision
trees. Journal of Information Processing Systems,
14(6):445–452.
Bong-Keun Kim, I. J. and Lee, G. (2008). Real-time road-
visibility measurement using cctv camera. Journal of
Korean Society of Transportation, pages 514–517.
Canny, J. (1986). A computational approach to edge de-
tection. IEEE Transactions on pattern analysis and
machine intelligence, (6):679–698.
Duda, R. O. and Hart, P. E. (1972). Use of the hough trans-
formation to detect lines and curves in pictures. Com-
munications of the ACM, 15(1):11–15.
Jokela, M., Kutila, M., and Le, L. (2009). Road condi-
tion monitoring system based on a stereo camera. In
Intelligent Computer Communication and Processing,
2009. ICCP 2009. IEEE 5th International Conference
on, pages 423–428. IEEE.
Jonsson, P. (2011). Classification of road conditions: From
camera images and weather data. In Computational
Intelligence for Measurement Systems and Applica-
tions (CIMSA), 2011 IEEE International Conference
on, pages 1–6. IEEE.
Meyer, F. (1992). Color image segmentation. In Image
Processing and its Applications, 1992., International
Conference on, pages 303–306. IET.
Yongdeok Sin, B. H. and Lee, J. (2015). Weather condition
distinguishing method based data analysis using cctv
video. Proc. of the KIISE Korea Computer Congress,
pages 247–249.
An Image Data Learning Method by Discriminating Multiple ROIs Data Patterns for Extracting Weather Information
443
