National Survey of Japanese Universities on IT Education
Overview of the Entire Project and Preliminary Analysis
Tetsuro Kakeshita
Graduate School of Information Science, Saga University, Saga, Japan
Keywords: IT Education, Survey, College Level Education, Learning Analytics.
Abstract: We are conducting a national survey of Japanese universities on IT education under the support of Japanese
Mistry of Education. This paper describes the overview of the survey project and preliminary analysis of the
survey result. The survey is composed of five different types: (1) survey of IT education as a major field of
study, (2) survey of IT education as a part of a major field other than IT, (3) survey of general IT education
for college students belonging to all faculties, (4) survey of IT education for the students willing to have a
licence to be a high school teacher on IT, (5) survey of computing environment for IT education. The survey
contains various questions about outline of the educational program, educational contents and achievement
level for independent topic, students, teaching staff, educational environment and future plan. We collected
about 3,000 answers from 650 universities using a Web-based survey system. The survey covers 85% of the
Japanese universities.
1 INTRODUCTION
Information technology (IT) is an essential topic for
university education. Not only the departments
majored in IT, non-IT departments also require IT
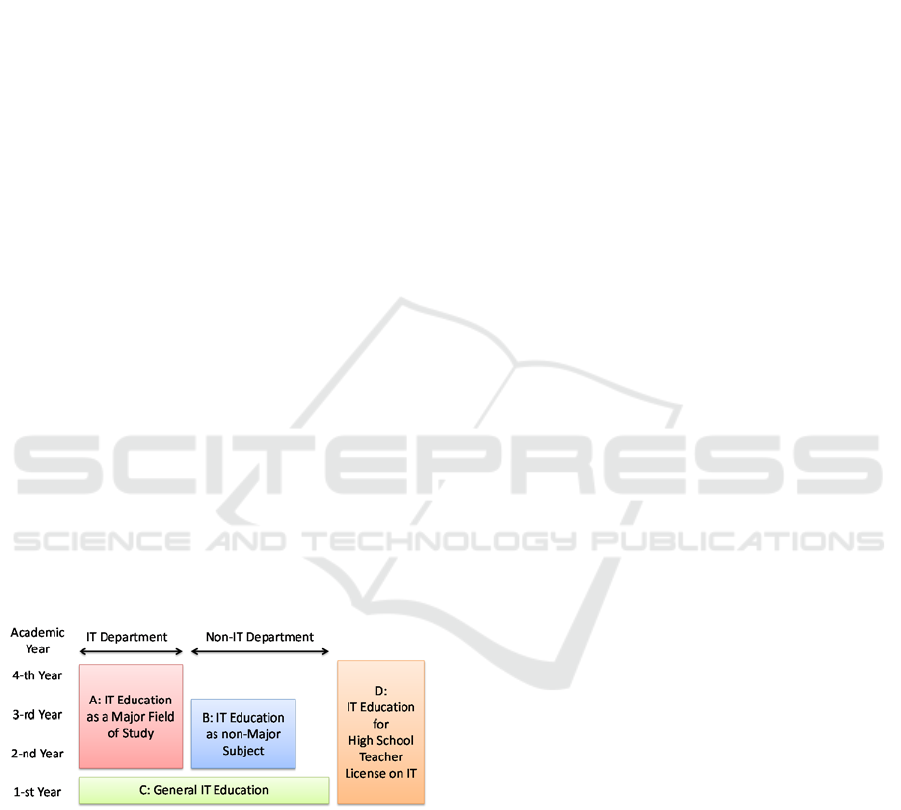
education. In Japanese universities, there are four
types of IT education illustrated in Figure 1.
Figure 1: Typical Organization of IT Education at
Japanese Universities.
A. IT education at a department or a course majored
in IT discipline
B. IT education at a non-IT department or a course
as part of their major field of study
C. General IT education for all university students
typically at the first or second academic year
D. IT education for the students willing to have a
high school teacher lisence on IT education
For type A departments (IT departments), ACM
and IEEE Computer Society published a series of
computing curricula recommendations such as
CC2005 (ACM, 2005) and CS2013 (ACM, 2013).
Information Processing Society of Japan (IPSJ) also
developed computing curricula standard J07 (IPSJ,
2008) based on CC2005. However, currently there
is no standard for IT education of types B and C.
Although the Japanese government established a
regulation for type D education, the regulation is
quite simple compared with the recent curriculum
standards.
IPSJ is currently working to develop curriculum
recommendations for the above types of IT
education. To this end, we conducted a Web-based
survey of Japanese universities. The survey contains
IT education of types A-D as well as computing
environment for IT education. The survey result
will be utilized to understand the current situation of
IT education at Japanese universities and to develop
the new IPSJ curriculumn recommendations and
national policy for IT education in Japan.
Science Council of Japan (SCJ) published the
“Reference Standard of Informatics for University
Education” in March 2016 (Hagiya, 2015). Our
survey utilizes the reference standard as a common
body of knowledge (BOK) to investigate topics of
IT education at Japanese universities. We expect to
compare various types of IT education in a uniform
Kakeshita, T.
National Survey of Japanese Universities on IT Education - Overview of the Entire Project and Preliminary Analysis.
DOI: 10.5220/0006380806070618
In Proceedings of the 9th International Conference on Computer Supported Education (CSEDU 2017) - Volume 1, pages 607-618
ISBN: 978-989-758-239-4
Copyright © 2017 by SCITEPRESS – Science and Technology Publications, Lda. All rights reserved
607

manner through the common BOK. Our survey is
actually the first national level survey on IT
education at Japanese unversities.
This paper describes the overview of the survey
project and the preliminary analysis result of the
collected data.
2 SURVEY TYPES AND
QUESTIONS
In this section, we explain the survey types and the
outline of the questions collected in each survey type.
Since survey types A to D covers various types of IT
education, the survey questions are almost the same.
However the survey questions for type E is focused
on computing facilities for IT education.
2.1 Survey Type Description
Survey type A is prepared for IT education at a
department or a course majored in IT discipline.
Education program of such department or course
focuses on IT so that the major portion of the
educational contents is contained in the “Reference
Standard of Informatics for University Education”.
An IT department or an IT course is expected to
develop IT professionals.
IT education is necessary even at a non-IT
department. Survey type B is prepared for IT
education at a department not majored in IT
discipline. Since there are quite many departments
of this type, we allow that a faculty containing
several non-IT departments can respond to the
survey as a delegate of these non-IT departments.
Survey type C is prepared for the general IT
education typically at a university or a faculty.
General IT education is provided as an interface
between high school IT education and college level
IT education. Thus it is commonly provided for all
students belonging to both IT departments and non-
IT departments.
Survey type D is prepared for the students
willing to have a high school teacher licence on IT
education. In Japan, the Ministry of Education
accredits education programs of this type using the
national regulation as the evaluation criteria. Only
the accredited programs can issue high school
teacher licensure.
Survey type E is prepared for the educational
computer system at a department, a faculty or a
university. Educational computer system includes
servers, LAN infrastructure, PCs, various types of
educational software and educational contents. It is
essential to support IT education particularly for
skill development.
2.2 Questions for Survey Types a to D
The questions for survey types A to D are almost
common. The following is the list of questions for
these surveys.
Names of university, faculty, department and
course
Position of the respondent (education
committee member, secretariat staff, faculty
member, etc.)
Program Organization
Day time, Night or Remote program
Category of the course such as engineering,
science, social science, humanities, etc.
Corresponding J07 domain such as
computer science (CS), computer
engineering (CE), software engineering
(SE), information systems (IS) and
information technology (IT)
Required number of credits for graduation
Number of subjects
Achieved knowledge/skill level and the
number of students for each knowledge and/or
skill item. Knowledge/skill levels are defined
as illustrated in Tables 1 and 2.
Enrolled Students
Academic year
Number of students
Student’s choice of career after graduation
Teaching Staff
Number, educational background,
specialized field, tenure of faculty members
Number and workload of support staffs
Number and workload of teaching assistant
students
Educational Environment
Computer system
Student’s own PC
Utilization of student PC at class
Educational programming language
Other Topics
Future plan
Strength of the education program
Utilization of IT certification and/or
qualification
Special topics
A2E 2017 - Special Session on Analytics in Educational Environments
608
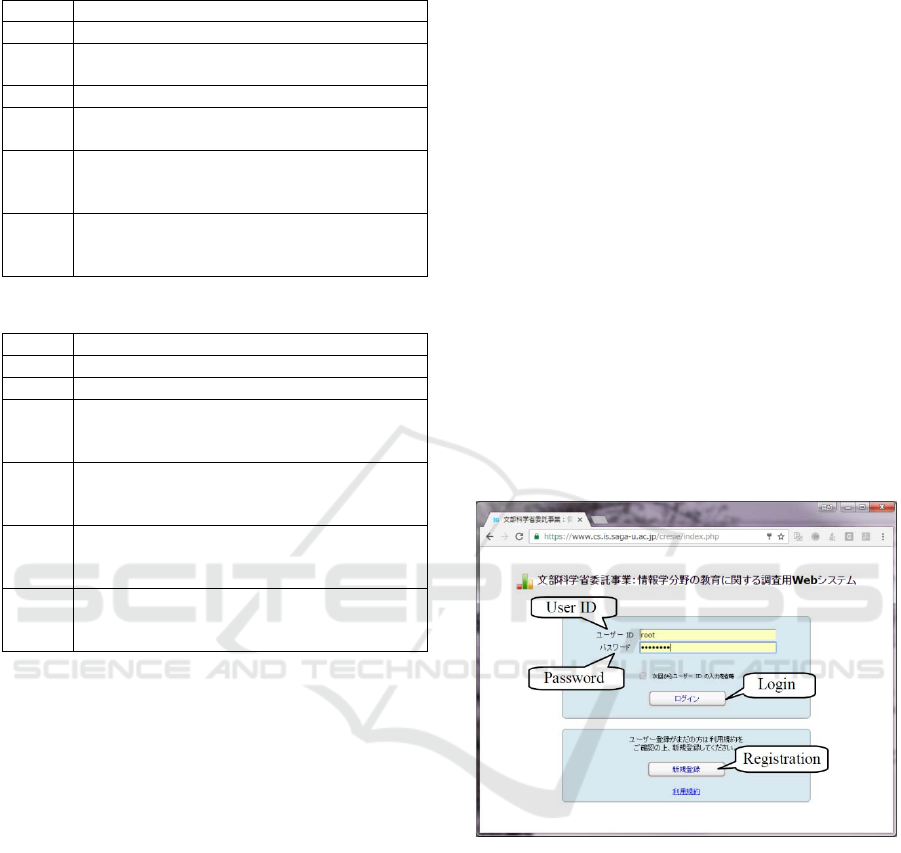
Table 1: Knowledge Level Description.
Level Knowledge Level Description
0 Not taught (unnecessary or already taught)
1
Not taught because of the time limitation or
because the level of the contents is too high.
2 Taught at class. Students know each term.
3
Taught at class. Students can explain the
meaning of each term.
4
Taught at class. Students can explain
relationship and/or difference among related
terms.
5
Taught at class or graduation research project.
Students can teach related domain or subject
of the terms to the others.
Table 2: Skill Level Description.
Level Skill Level Description
0 Not taught (unnecessary or already taught)
1 Taught at class with simple exercise
2
Taught at class with some exercise. Students
can perform the topic if detailed instructions
are provided.
3
Taught at experiment with more complex
exercise. Students can perform the topic with
simplified instructions
4
Students perform combined research theme
containing the topic so that the students can
autonomously perform the topic.
5
Students perform combined research theme
containing the topic and the students can
teach how to perform the topic to the others.
2.3 Questions for Survey Type E
The following is the list of questions for survey type
E, educational computer systems.
Name of university, faculty and department
Contract
Rental term and fee per month
Hardware and Software
Number of PCs or terminals
Education software such as OS, office
software, communication software,
multimedia software, IDE, database,
modelling tool, learning management
system (LMS)
Digital contents for education
Administration
Faculty members and staffs
Student assistant
Committee
Outsourcing
Other Topics
Future plan
Strength of the computer system
Special topics
3 SURVEY PROCESS
The survey is carried out in three phases: preparation,
survey and review. The preparation phase ended on
October 2016. The survey phase started at the
beginning of November 2016. We distributed the
survey to the 750 universities in Japan and
responded to the inquiries from the universities. The
survey phase ended on December 26, 2016.
Currently we are in the review phase which started
on January 2017.
3.1 Preparation Phase
We utilize a web-based survey system named “cresie”
(Kakeshita, 2011) for this survey (Figure 2). Cresie
is designed as a general purpose survey system to
collect various types of data using web forms and
Excel worksheets.
Figure 2: The Survey System cresie.
Cresie allows defining a list of questions composed
of a question title, a question text, a data type and
default value of the response etc. Such definitions
are stored in a MySQL database. These questions
are shown to the respondent using a web-form.
Most of the questions listed in Section 2 are
represented by this means. We prepared the
definition of the questions using Microsoft Excel
and stored as CSV files. The CSV files are uploaded
to the database to set up the cresie system.
Cresie also allows defining a body of knowledge
(BOK) and knowledge/skill levels. Then a
respondent can download an Excel file to answer the
achievement level of each of the BOK item with the
National Survey of Japanese Universities on IT Education - Overview of the Entire Project and Preliminary Analysis
609
number of students who learned the BOK item.
After defining questions and setting up the cresie
system, we prepared formal request letters to the
universities, faculties and departments associated
with the request letter from the Ministry of
Education. Such formal request is essential in order
to increase the response ratio of the survey.
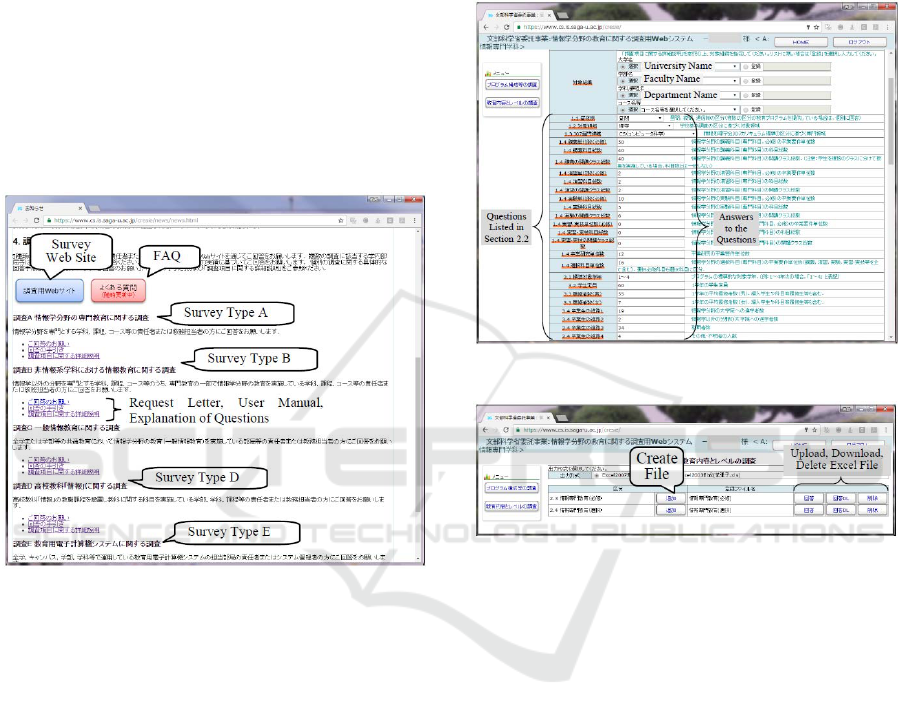
We also prepared user’s manual of the cresie
system and the detailed explanation document for
each question of the survey. We also prepared an
FAQ on the web. These documents are uploaded to
the Web so that the respondent can easily read or
download the documents (Figure 3). Such
documents are important to reduce the number of
inquiries to us during the survey period.
Figure 3: Web Links to the Related Documents.
3.2 Survey Phase
There are about 750 universities in Japan. We sent
the formal request letter to the secretariat office of
each university by postal mail. Then the request
letter is distributed to all the faculties and
departments of the university. Each university,
faculty, department or course responds to the survey
questions in the following procedure.
1. The respondent downloads the cresie user
manual from the web.
2. The respondent selects appropriate survey type
and registers to the cresie system
corresponding to the selected survey type.
3. The respondent log-in to the cresie system and
fills the answer columns to the web-based
questions. (Figure 4)
4. The respondent downloads Excel file to
represent the educational achievement of the
program. (Figure 5)
5. The respondent fills the knowledge/skill level
and the number of students at each BOK item
represented in the downloaded Excel file.
(Figure 6)
6. The respondent uploads the filled Excel file to
the cresie system and log out from the system.
(Figure 5)
Figure 4: Web Form for the Survey.
Figure 5: Web Form to Download/Upload Excel Files.
We request each university, faculty, department or
course to register to the cresie system independently
for each survey type. For example, an IT
department may register three accounts
corresponding to type A, D and E surveys. This is
because an IT department often has an accredited
program for high school teacher licensure on IT and
an educational computer system of the department.
It sometimes happens that a university has
several IT departments. In such a case, each
department is requested to register to the cresie
system independently.
As we have noted in Section 2.1, a faculty may
consists of an IT department and several non-IT
departments. In this case, the faculty may merge the
non-IT departments and register to the system as a
delegate representing the non-IT departments. Then
the faculty responds to the type B survey.
Even the Ministry of Education does not
recognize all departments and courses while the
ministry recognizes all universities and faculties.
A2E 2017 - Special Session on Analytics in Educational Environments
610
Nor the ministry does not recognize which faculty or
department are performing IT education. Thus we
distributed the request letter to every faculty and
department, and ask them to register to the cresie
system by their own.
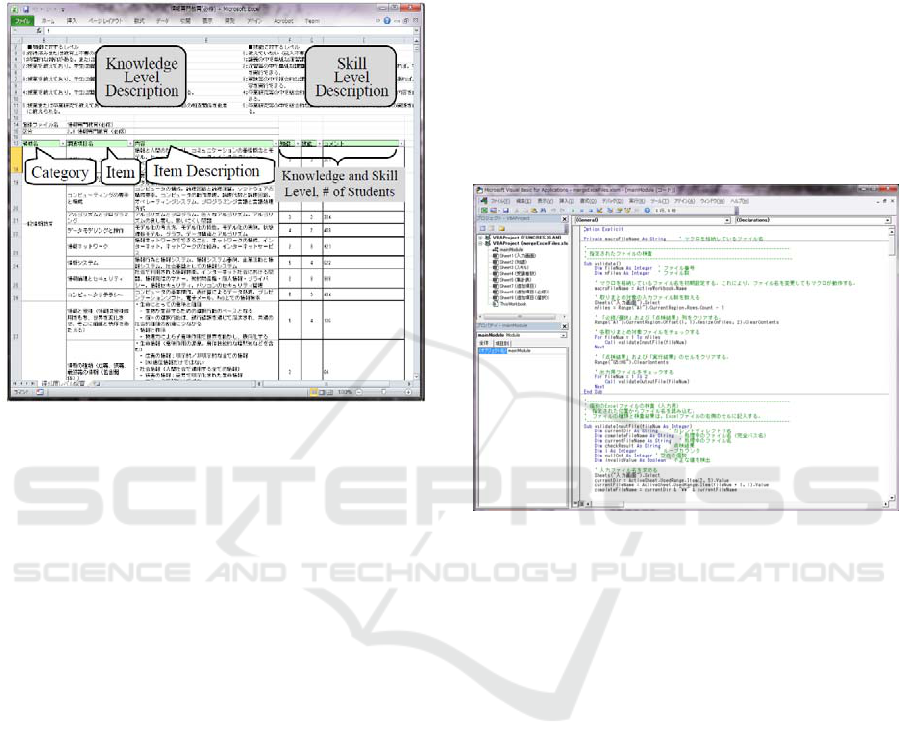
Figure 6: Representing Educational Achievement using
Excel Worksheet.
The BOK items defined in the Excel worksheet
(Figure 4) contains 90 knowledge/skill items which
are defined based on the “Reference Standard of
Informatics for University Education” (80 items)
and a BOK of general IT education (10 items). The
BOK covers all topics of IT education so that
specific domains such as CS, CE, SE, IS and IT can
be mapped to the BOK. This is important to clarify
relationship among different domains (Kakeshita,
2014).
The respondent is requested to complete the
Excel worksheet shown in Figure 6 with the
knowledge/skill level and the number of enrolled
students corresponding to each BOK item. There
are the cases when a BOK item is taught at several
subjects or exercises with different levels. In such
cases, we require the respondent to merge the
achievement of multiple subjects or exercises to fill
the Excel worksheet. The merge rule is as follows.
The number of students is calculated by the
sum of the numbers of students of the
corresponding subjects and exercises.
The representative knowledge/skill levels are
defined using the levels with the largest
number of students (i.e. the mode values)
among the achievement levels of multiple
subjects or exercises. The number of students
of multiple subjects or exercises is classified
based on the achieved level in order to
calculate the representative level. In the case
that there are more than one mode values, the
median value is used instead.
90 BOK items are defined in the Excel
worksheet and the respondent has to calculate the
representative knowledge level and skill level for
each BOK item according to the above rule. Such
calculation is a complex and time consuming task.
Thus we developed an Excel macro (Figure 7) in
order to merge multiple Excel worksheets each of
which represents achievement levels of a single
subject or exercise.
Figure 7: Excel Macro to Merge Multiple Excel
Worksheets.
The Excel macro is distributed using the survey web
site so that the respondent can freely download and
execute the macro to merge the Excel worksheet
collected from the faculty members. Thus the macro
is useful to reduce the workload of the respondent.
The macro also provides checking functions for the
data values contained in the Excel worksheet so that
it is useful to reduce the mistakes in the Excel
worksheets uploaded to the survey system.
In order to respond to the inquiries from the
universities, we prepared a mailing list for the
inquiries and appointed 5 members to respond to the
inquiries. Each of the members is assigned a survey
type or account management to distribute the
handling workload. We also asked the secretariat
office of the Information Processing Society of
Japan to provide a telephone number to receive the
inquiries.
3.3 Review Phase
The review phase contains three types of checking.
They are the checking of registration and survey
National Survey of Japanese Universities on IT Education - Overview of the Entire Project and Preliminary Analysis
611

type, the checking of the answer to the survey
questions, and the checking through comparison
with existing public data. The checking is essential
to ensure reliability of the collected data and the
analysis result.
The checking of the registration and survey type
is performed at the end of November 2016 just after
the deadline of the registration to the cresie system.
The following points were checked among the
registered accounts.
Existence of the registered university name
Registration from an educational institution
other than university or college providing a
bachelor degree
Erroneous registration to each survey type
including registration of an entire university or
a faculty to the system for survey type A.
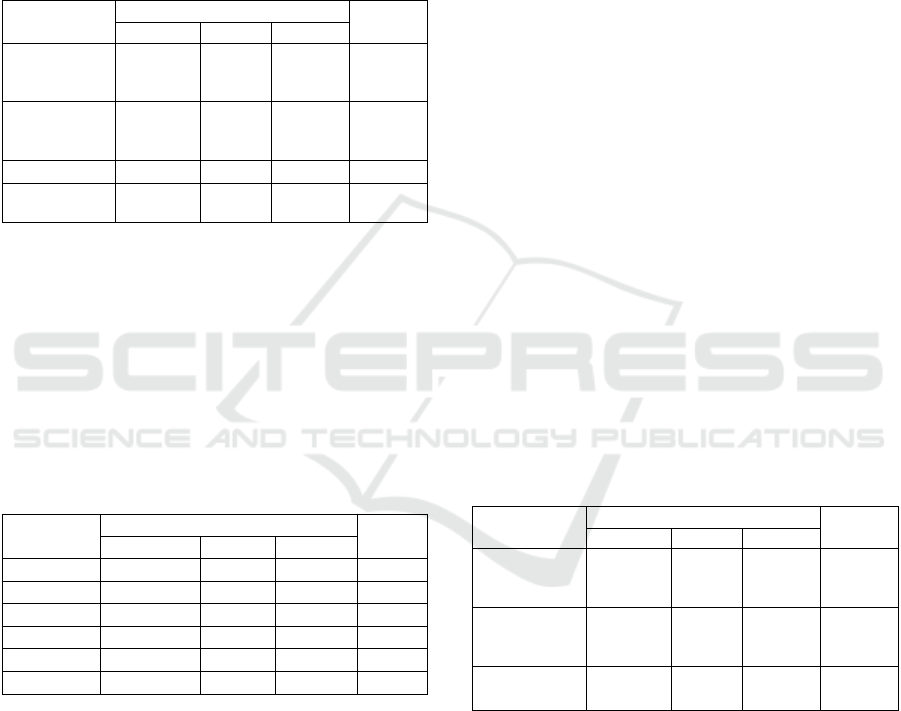
Table 3 represents acceptable combination of
typical registration for each survey type.
Table 3: Acceptable Combination of Typical Registration
and Survey Type.
Survey Type University Faculty Department Course
A
× △ ○ ○
B
△ ○ ○ ○
C
○ ○ × ×
D
× △ ○ ×
E
○ ○ ○ ×
We notified the registered accounts other than the
above acceptable combination and confirmed the
survey type. In Table 3, “○” means acceptable, “×”
means unacceptable. If we find a “×” combination,
we requested to correct the survey type. “△” means
acceptable in a special case so that we requested the
respondent to add explanation about the reason of
survey type selection.
The checking of the answer to the survey
question is performed to verify correctness and
consistency of the answer. The following is a list of
checking rules.
Multiple registrations to the same combination
of survey type and registered university,
faculty, department and course names
No Excel file is uploaded to the system.
Although Excel file is uploaded to the system,
the number of students is not reported.
More than three Excel files are uploaded.
In survey type A for IT department, the amount
of credits for IT education is less than 25% of
the required amount of credits for Japanese
universities.
The number of classes is less than 2, which
means that almost all subjects are closed.
The required credit for graduation research is
less than 2, which is quite rare in Japanese
universities.
The number of faculty members is less than the
required number defined in the criteria for
Japanese universities.
The number of students is less than 10, which
means that the department or course is quite
small as an independent education program.
In survey type C for the general IT education,
knowledge or skill level for a particular BOK
item is 5, which can be regarded as too high
considering the teaching time and academic
year.
Unrealistic answer values (such as 9999) for
some questions.
We notified the registered accounts whose
answers meet the above checking rules, and
requested a confirmation or correction of the
answers.
At the time of writing this manuscript, we are
waiting for the response from the registered
respondents. The final paper will contain the
analysis result based on the confirmed and updated
data.
Finally we compared the registered accounts
with existing public data listed below in order to
estimate the response rate.
Member of the Council of Informatics
Departments in Science and Engineering (DI
Council)
Accredited departments from the Japanese
government to obtain high school teacher
license on IT education
We contacted the member departments of the DI
Council which did not register to the survey system.
We expect them to answer the survey soon.
4 SUMMARY OF THE SURVEY
4.1 Overall Response Rate
Table 4 summarizes the response rate of the three
types of Japanese university issuing bachelor’s
degree. Among 758 Japanese universities, 86.7%
answer to at least one survey type. National
universities are founded and financially supported
by the Japanese government. Since the survey is
supported by the Japanese Ministry of Education,
the response rate of the national university is the
highest among the three university types. Public
universities are founded and supported by local
government such as prefecture or city. Majority of
A2E 2017 - Special Session on Analytics in Educational Environments
612
the Japanese universities are private universities.
Private universities are also financially supported in
part by the Japanese government while preserving
independence. We guess that the response rate of
private university is the second highest because of
this background. In Table 4, N/A means that the
requested universities are quitted or do not provide
IT education. These universities are included to
calculate the response rate.
Table 4: Response Rate Summary (Overall).
University Type
Total
National Public Private
# of
Requested
Universities
82 86 590 758
# of
Registered
Universities
79 73 499 651
N/A
0 0 7 7
Response
Rate
96.3 % 84.9 % 85.6% 86.7%
4.2 Response Rate Analysis for Each
Survey Type
Table 5 summarizes the number of answers for each
survey type. It is often the case that an IT
department (Type A) is running a program to have a
high school teacher licence on IT education (Type
D). Thus the numbers of answers to these two types
are relatively similar.
Table 5: Number of Answers for Each Survey Type.
Survey
Type
UniversityType
Total
National Public Private
A 84 35 177 296
B 302 64 632 998
C 96 69 574 739
D 85 18 235 338
E 128 73 368 569
Total 695 259 1,986 2,940
Comparing the Type A registration and the list of
Council of Informatics Departments in Science and
Engineering (DI Council), we found that 127
departments are registered to survey type A. Since
151 departments have registered to the DI Council,
84.1% of them respond to the survey. Although
there is no formal list of IT department in Japan, we
shall use this ratio as an estimated response rate of
survey type A. At the same time, we can recognize
that the DI Council only covers 42.1% of the IT
departments or courses in Japan. The total number
of students of the registered department or course is
25,419 per academic year. Among them 20,962
students are male and 4,457 are female.
As in the case of survey type B, there is no
formal list of non-IT departments or faculties in
Japan. However, the total number of university
students per academic year is 626,865 according to
the national statistics in 2016. The total number of
students of the registered faculties and departments
for survey type B is 87,261 for a single academic
year. The number can be regarded as a lower bound
of the number of students learning IT subject at non-
IT departments. Although the response rate of
survey type B is not expected to be high, the
collected data is useful to understand typical IT
education at non-IT departments.
In case of survey type C, the total number of
students of the registered universities is 247,112 for
a single academic year. Compared with 626,865, the
total number of university students for a single
academic year, at least 39.4% of the university
students are taking the general IT education. The
response rate of survey type C is expected to be
higher than that of survey type B.
There are 521 accredited departments to obtain
high school teacher license on IT education
according to the Web site of the Ministry of
Education, Japan. Among them, 340 departments
(65.3%) answer to the survey. Although the number
does not match to the value in Table 5, this is
because some of the answers contain more than one
department.
Table 6: Response Rate Summary (Type D).
University Type
Total
National Public Private
# of
Accredited
Departments
107 17 397 521
# of
Registered
Departments
75 14 251 340
Response
Rate
70.1 % 82.4% 63.2% 65.3%
The detailed response rate is illustrated in Table 6.
The response rate of the private university is not
high because we requested that only the department
having enrolled students to answer the survey. The
number of students willing to have a high school
teacher licence on IT education is not many because
of the market reason. In case of the public
universities, the accredited education course will be
quitted if there are not enough students enrolled.
However national universities tend to retain the
accredited course according to the instruction from
National Survey of Japanese Universities on IT Education - Overview of the Entire Project and Preliminary Analysis
613
the Ministry of Education from the viewpoint of
social responsibility. The difference of the response
rate is observed under such background.
The response rate for Type E survey
(Educational Computer System) is summarized in
Table 7. The number of registered universities does
not match to the value in Table 5 since more than
one educational computer system exists in some
universities. The response rate of the national
university is the highest because of the difference of
financial background.
Table 7: Response Rate Summary (Type E).
University Type
Total
National Public Private
# of
Requested
Universities
82 86 590 758
# of
Registered
Universities
73 53 311 437
Response
Rate
92.4% 73.6% 62.6% 67.4%
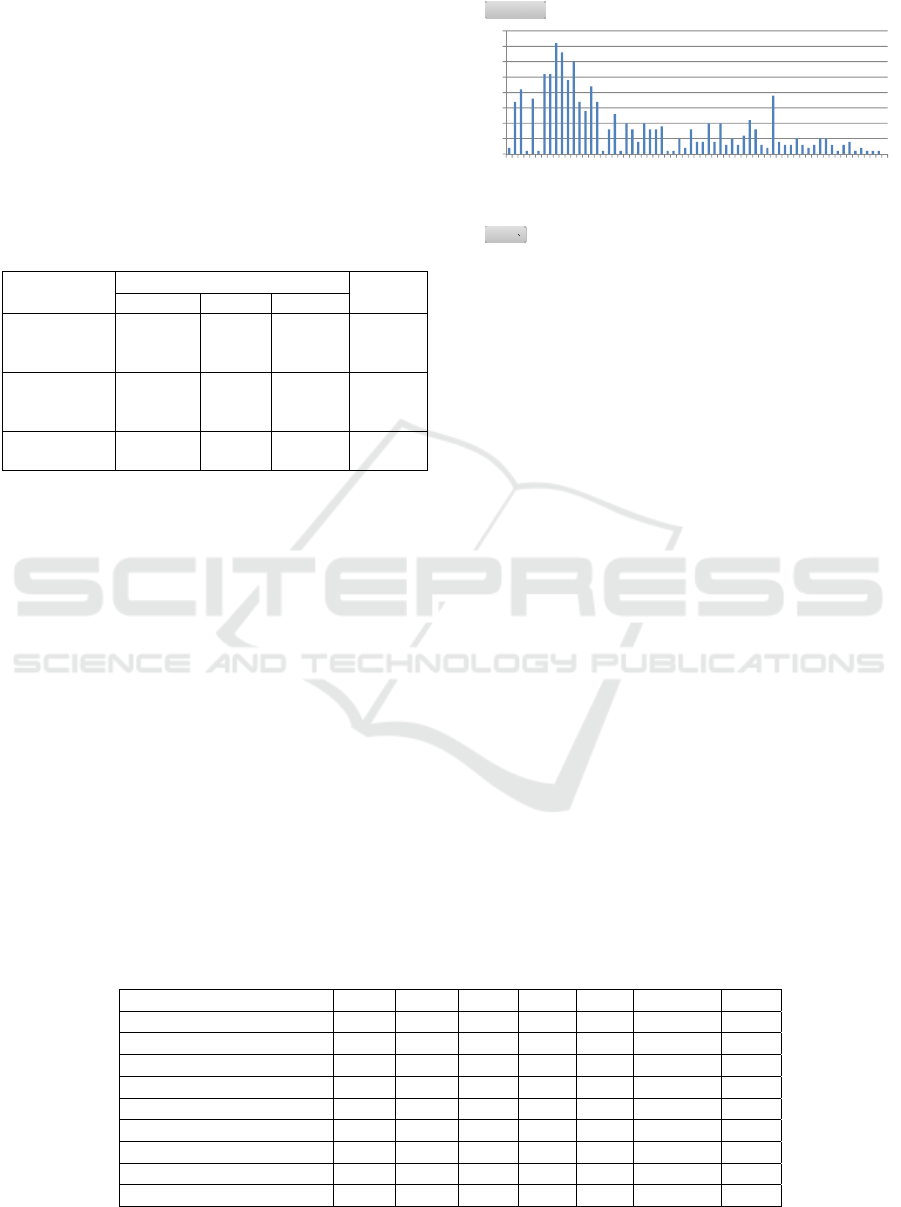
4.3 Inquiries from the University
We have received 544 inquiries from the university.
Among them, 494 were received during the survey
phase. 50 were received during the review phase.
Figure 8 illustrates the number of inquiries at each
day, which will be useful to estimate the workload to
respond to the inquiries of a large scale survey like
ours.
The request letter for the survey is sent on Oct.
28, 2016 so that we received the first inquiry on Oct.
31. The deadline of registration to the survey
system was on Nov. 11 so that we received many
inquiries before that. After that we received a
constant number of inquiries about the questions.
The survey was closed on Dec. 26 so that we
received more inquiries than usual about deadline
extension on that day. The inquiries after the
deadline are about the feedbacks based on the
checking of the survey answers.
Figure 8: Number of Inquiries from the Universities.
5 PRELIMINARY ANALYSIS OF
THE SURVEY RESULT
In this section, we present a preliminary analysis of
the survey result. More detailed result will be
published as separate papers for each survey type.
5.1 Survey Type A: IT Department
Although we have collected 296 answers, 56 are
excluded from the analysis because non-IT
departments and invalid answers are detected
through the review phase.
The IT major is new compared with traditional
academic domains. Table 8 illustrates this fact. For
example, computer science (CS) departments are
distributed among engineering, physical science and
other domains. There are 34 departments which do
not belong to traditional academic domains. 87
departments, 36.3% of the IT departments, do not
belong to any of the existing computing disciplines.
This fact suggests the necessity of developing other
computing curricula recommendation for these
departments.
Figure 9 represents educational achievement of
Table 8: Number of IT Departments Classified by Computing Discipline and Traditional Academic Domains.
CS CE SE IS IT Others Total
Engineering 53 25 1 21 13 40 153
Others 5 2 3 24 34
Social Science 6 3 15 24
Physical Science 12 1 3 16
Humanities 2 3 5
Pharmacy and Nursing 3 1 1 5
Art 1 1 2
Education 1 1
Total 70 25 4 31 23 87 240
0
5
10
15
20
25
30
35
40
2016/10/31
2016/11/3
2016/11/7
2016/11/10
2016/11/15
2016/11/18
2016/11/22
2016/11/25
2016/11/30
2016/12/3
2016/12/6
2016/12/9
2016/12/14
2016/12/19
2016/12/22
2016/12/26
2017/1/4
2017/1/7
2017/1/12
2017/1/16
2017/1/26
2017/2/2
Date
# of Inquiries
A2E 2017 - Special Session on Analytics in Educational Environments
614
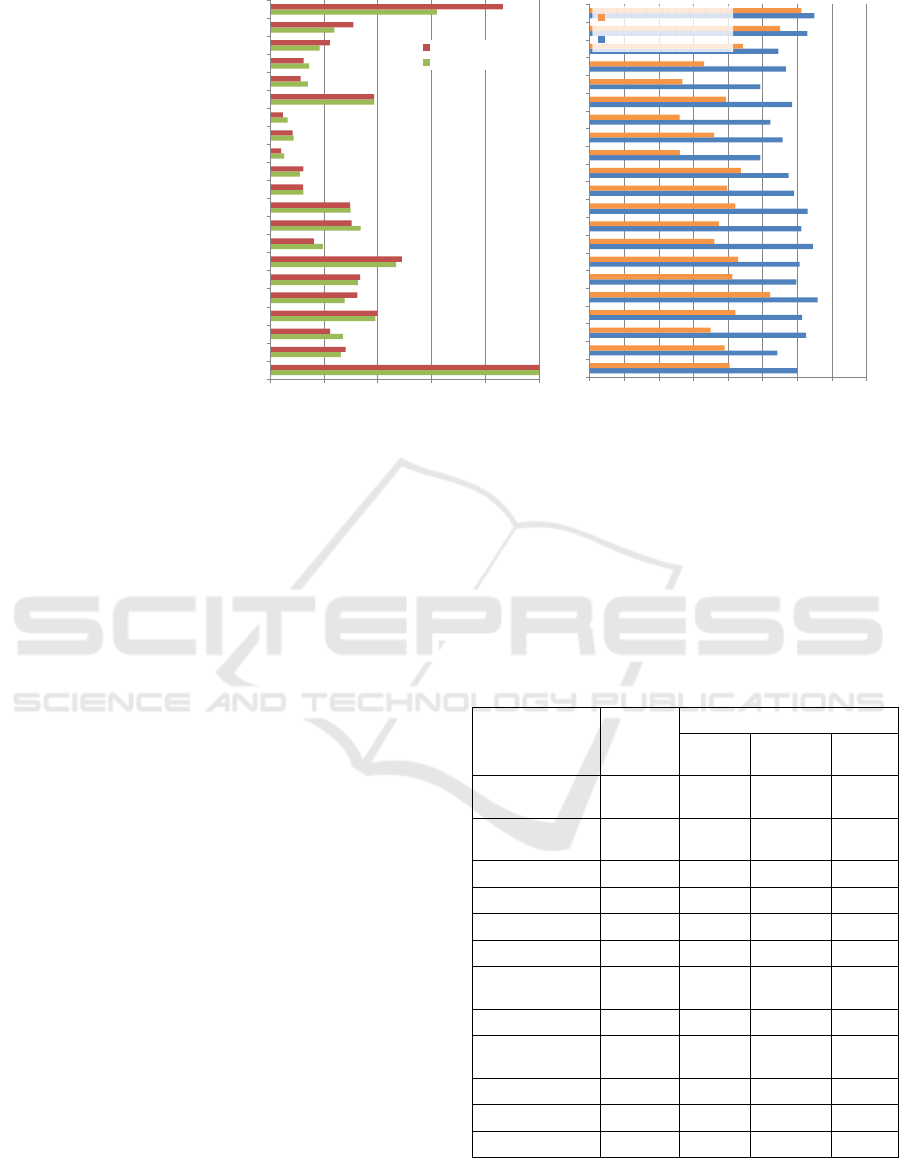
(a) Effort Ratio (b) Average Achievement Level
Figure 9: Educational Achievement of IT Department (Survey Type A).
IT departments and courses respond to the survey
type A.
Fig. 9 (a) is the distribution of effort for each
domain of the “Reference Standard of Informatics
for University Education” and the general IT
education. The effort is estimated by the sum of the
number of students multiplied by the achieved level
of the students in the submitted answers.
Fig. 9 (b) represents the average achievement
level of the same domains as represented in Fig. 9
(a). The definition of the knowledge/skill levels is
described in Tables 1 and 2. The averages are
calculated among the answers with levels more than
1 using the number of students as the weight. Thus
it should be noted that the number of students who
achieved the average level is almost proportional to
the effort ratio of the corresponding domain.
5.2 Survey Type B: non-IT Department
or Faculty
As shown in Table 5, we have received 998 answers
for survey type B. Table 9 represents the number of
answers and enrolled students at each academic
domain. The table also represents the ratio of the
number of students at each domain. The total
number of students is cited from the national
statistics of Japanese universities. The table rows
are sorted in the descending order of the ratio.
The readers can observe that the response ratios
of Medicine and dentistry, Physical Science and
Engineering are significantly higher than those of
the other academic domains. Although the number
of students majored in social science is the largest,
the number of answers is rather small. Similar
tendency can be observed in humanities and
education. This fact indicates the difference of
effort and/or achievement at each domain. It is often
observed that IT education is provided through
general IT education for the latter case.
Table 9: Number of Answers and Students Classified by
Traditional Academic Domains (Survey Type B).
Domain
# of
Answers
# of Students
Our
Survey
National
Statistics
Ratio
Medicine and
Dentistry
40 3,438 11,765 29%
Physical
Science
79 4,969 18,523 27%
Engineering
227 23,151 88,062 26%
Social Science
253 31,428 204,933 15%
Others
102 7,979 56,019 14%
Agriculture
33 1,824 18,042 10%
Pharmacy and
Nursing
85 5,734 58,824 10%
Education
56 2,599 46,475 6%
Domestic
Science
22 926 17,787 5%
Humanities
82 4,568 88,246 5%
Art
19 645 18,189 4%
Total 998 87,261 626,865 14%
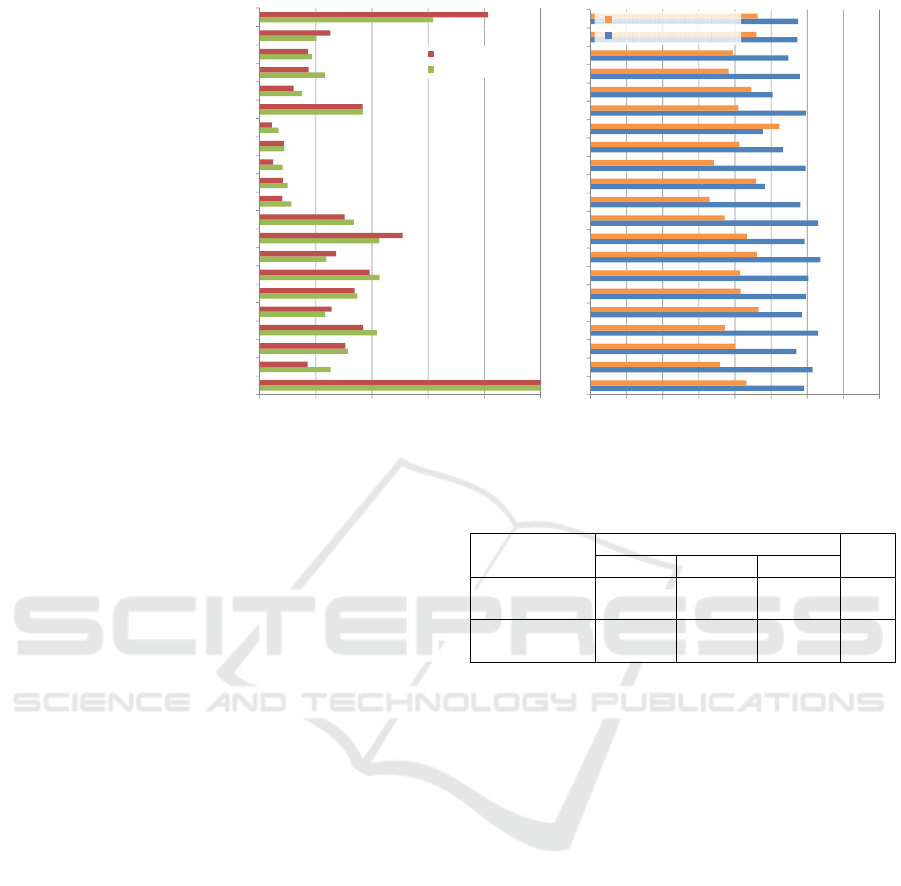
Examine Figure 10 which illustrates average effort
ratios of the “Engineering” and “Social Science” for
comparison. The effort ratio of the general IT
0% 20% 40% 60% 80% 100%
GeneralITEducation
GeneralTheoryofInformatics
InformationTransformationandTransmission
InformationRepresentation,Accumulationand…
InformationRecognitionandAnalysis
Computation
Algorithm
ComputerHardware
I/ODevice
FundamentalSoftware
ProcessandMechanismforInformationCreation…
HumanCharacteristicsandSocialSystem
EcononicSystemandInformation
IT‐basedCulture
TransitionfromModernSocietytoPostModern…
TechnicsforInformationSystemDevelopment
Technics
toObtainInformationSystemEffect
SocialSystemRelatedtoInformation
PrincipleandDesignMethodologyforHCI
ProfessionalCompetencyforITStudents
GenericSkillfor ITStudents
Effort(Skill)
Effort(Knowledge)
0.00 0.50 1.00 1.50 2.00 2.50 3.00 3.50 4.00
s
…
s
e
e
…
t
…
t
t
s
SkillLevel(Ave.)
KnowledgeLevel(Ave.)
National Survey of Japanese Universities on IT Education - Overview of the Entire Project and Preliminary Analysis
615
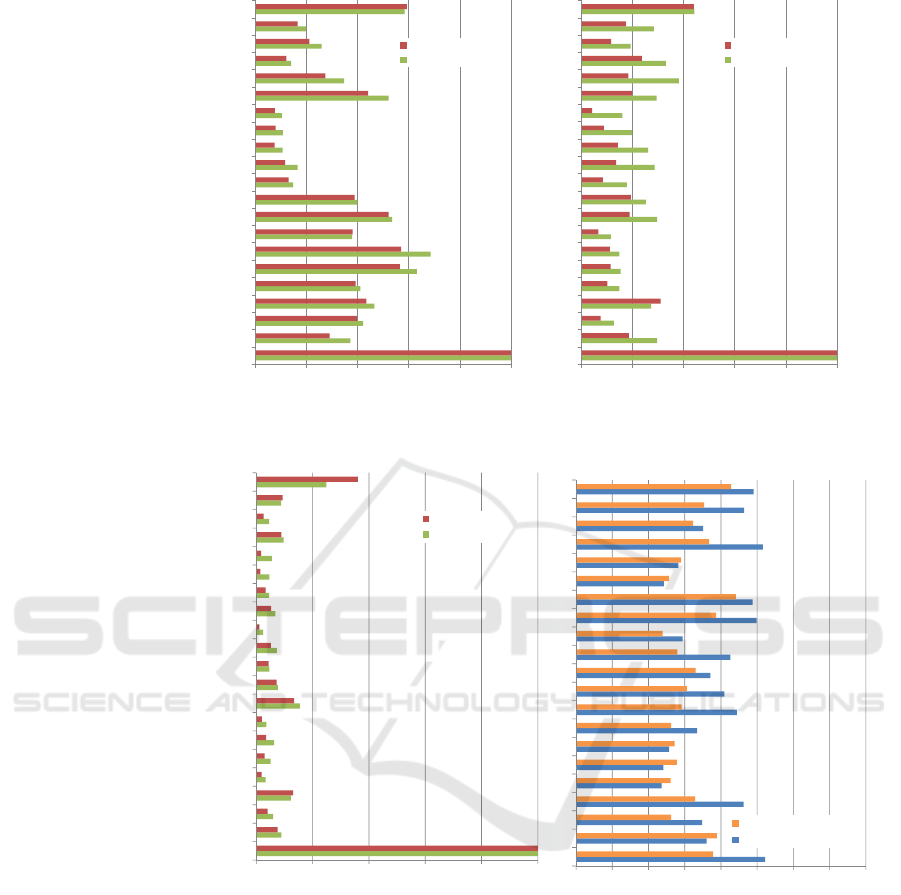
(a) Engineering (b) Social Science
Figure 10: Effort Ratio of non-IT Department or Faculty (Survey Type B).
(a) Effort Ratio (b) Average Achievement Level
Figure 11: Educational Achievement of General IT Education (Survey Type C).
education is high for both domains. However, the
“Engineering” departments also focuses on other
domains of Informatics such as hardware, software,
computer programming and generic skill. The
readers can observe that IT education at social
science departments is similar to the general IT
education. There is a significant difference of the
achievement levels between the two academic
domains. The average knowledge level is 2.3 at
engineering department and 2.1 at social science
department. The average skill level is 1.4 at
Engineering department and 0.8 at social science
department.
5.3 Survey Type C: General IT
Education
Figure 11 represents educational achievement of the
general IT education. The general education is
commonly provided for all university students.
Each student usually takes only 1 or 2 subjects, i.e. 2
to 4 credits, during the general IT education.
According to our analysis, the teaching contents
0% 20% 40% 60% 80% 100%
GeneralITEducation
GeneralTheoryofInformatics
InformationTransformationandTransmission
InformationRepresentation,Accumulationand…
InformationRecognitionandAnalysis
Computation
Algorithm
ComputerHardware
I/ODevice
FundamentalSoftware
ProcessandMechanismforInformationCreation…
HumanCharacteristicsandSocialSystem
EcononicSystemandInformation
IT‐basedCulture
TransitionfromModernSocietytoPostModern…
TechnicsforInformationSystemDevelopment
Technics
toObtainInformationSystemEffect
SocialSystemRelatedtoInformation
PrincipleandDesignMethodologyforHCI
ProfessionalCompetencyforITStudents
GenericSkillforITStudents
Effort(Skill)
Effort(Knowledge)
0% 20% 40% 60% 80% 100%
…
…
…
Effort(Skill)
Effort(Knowledge)
0% 20% 40% 60% 80% 100%
GeneralITEducation
GeneralTheoryofInformatics
InformationTransformationandTransmission
InformationRepresentation,Accumulationand…
InformationRecognitionandAnalysis
Computation
Algorithm
ComputerHardware
I/ODevice
FundamentalSoftware
ProcessandMechanismforInformationCreation…
HumanCharacteristicsandSocialSystem
EcononicSystemandInformation
IT‐basedCulture
TransitionfromModernSocietytoPostModern…
TechnicsforInformationSystemDevelopment
Technics
toObtainInformationSystemEffect
SocialSystemRelatedtoInformation
PrincipleandDesignMethodologyforHCI
ProfessionalCompetencyforITStudents
GenericSkillforITStudents
Effort(Skill)
Effort(Knowledge)
0.00 0.50 1.00 1.50 2.00 2.50 3.00 3.50 4.00
…
…
…
SkillLevel(Ave.)
KnowledgeLevel(Ave.)
A2E 2017 - Special Session on Analytics in Educational Environments
616
(a) Effort Ratio (b) Average Achievement Level
Figure 12: Educational Achievement of Education Program for High School Teacher Licence on IT (Survey Type D).
with high effort ratio are computer literacy,
information ethics, security and computer network,
digital representation of information, and
organization of computer system. The effort to other
domains of the “Reference Standard of Informatics
for University Education” is minimal because of the
time restriction.
The readers can also observe that the effort ratios
of social science (Fig. 10(b)) and the general IT
education (Fig. 11(a)) are similar. Although it can
also be observed that more effort can be assigned to
the domain in the “Reference Standard”, this can be
considered as a reason that social science
departments tend to rely on general education.
5.4 Survey Type D: Education
Program for High School Teacher
Licence on IT
The required amount of credits for an education
program for high school teacher license on IT is
more than 20 for the IT subject. Thus we often find
that an IT department runs such education program
as a part of their technical education.
Table 10 illustrates the number of cases that an
IT department exists within the university having an
education program for high school teacher licence
on IT. In case of national and public universities, IT
department coexists for about 90% of the cases,
although the ratio is lower in the case of private
university.
Table 10: Department Summary of Survey Type D.
IT Department
in University
University Type
Total
National Public Private
Exist
77
(89.5%)
15
(88.2%)
173
(73.3%)
265
Not Exist
9
(10.5%)
2
(11.8%)
63
(26.7%)
74
We also analysed the educational achievement of the
department belonging to the survey type D (Figure
12). It is similar to the educational achievement of
IT department shown in Figure 9, although the
achievement levels tend to be lower. We guess that
this is the effect of non-IT departments.
5.5 Survey Type E: Educational
Computer System
Educational computer system is important to support
IT education in order that a student to obtain a high
level IT skill. Table 11 shows the overall situation
of educational computer system at IT departments
(survey type A).
Among 296 IT departments, 17 are non-IT
departments. 34 (12.1%) departments have their
own computer system administrated by themselves.
This ratio is higher at national and public
universities. 213 (75.8%) departments are using
shared computer system operated by their faculty or
university probably due to the financial restriction.
34 (12.1%) departments do not have computer
system within their university.
0% 20% 40% 60% 80% 100%
GeneralITEducation
GeneralTheoryofInformatics
InformationTransformationandTransmission
InformationRepresentation,Accumulationand…
InformationRecognitionandAnalysis
Computation
Algorithm
ComputerHardware
I/ODevice
FundamentalSoftware
ProcessandMechanismforInformationCreation…
HumanCharacteristicsandSocialSystem
EcononicSystemandInformation
IT‐basedCulture
TransitionfromModernSocietytoPostModern…
TechnicsforInformationSystemDevelopment
Technics
toObtainInformationSystemEffect
SocialSystemRelatedtoInformation
PrincipleandDesignMethodologyforHCI
ProfessionalCompetencyforITStudents
GenericSkillforITStudents
Effort(Skill)
Effort(Knowledge)
0.00 0.50 1.00 1.50 2.00 2.50 3.00 3.50 4.00
…
…
…
SkillLevel(Ave.)
KnowledgeLevel(Ave.)
National Survey of Japanese Universities on IT Education - Overview of the Entire Project and Preliminary Analysis
617
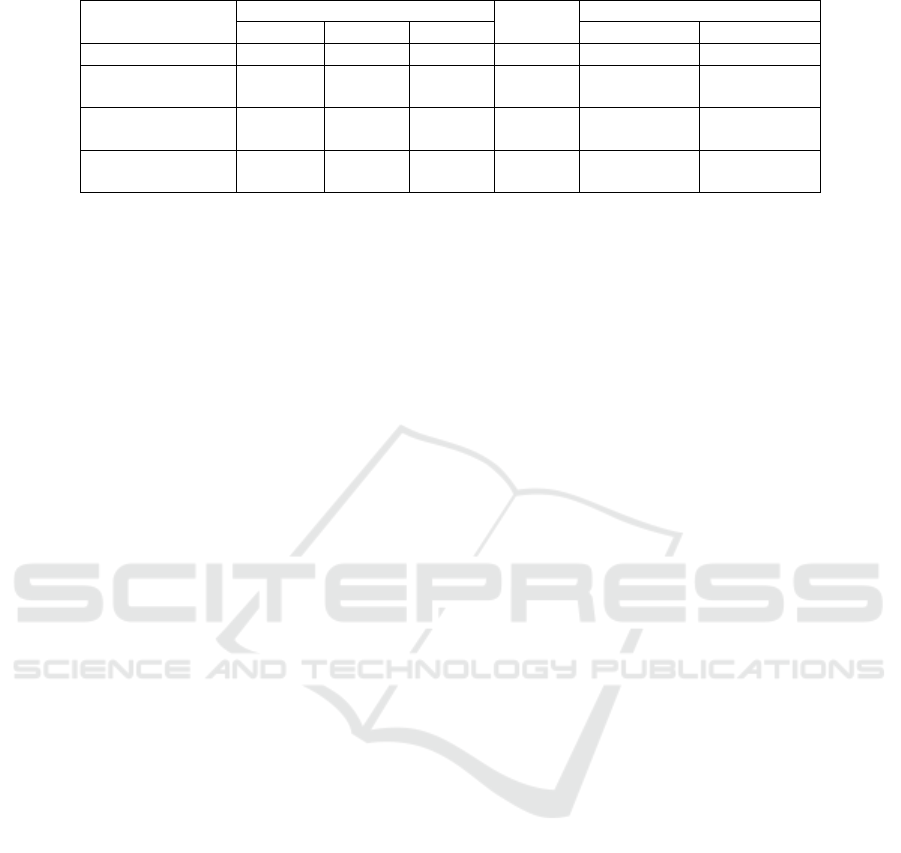
Table 11: Educational Computer System at IT Department.
University Type
Total
Average Achievement Level
National Public Private Knowledge Skill
IT Department 83 31 167 281 1.63 1.04
Department
System
23
(27.7%)
8
(25.8%)
3
(1.8%)
34
(12.1%)
1.67 1.05
Faculty or
University System
52
(62.7%)
19
(61.3%)
142
(85.0%)
213
(75.8%)
1.67 1.08
No Computer
System
8
(9.6%)
4
(12.9%)
22
(13.2%)
34
(12.1%)
1.20 0.73
Table 11 also contains the average achievement
level of knowledge and skill for these three cases. It
can be observed that the achievement level is
significantly lower both for knowledge and skill in
the case of no computer system. Significant
difference is not observed between the cases of
department system and faculty/university system.
6 CONCLUSIONS
This is the first national survey on IT education at
Japanese university. We have collected about 3,000
survey answers from about 650 universities. The
response ratio of survey type A can be estimated at
about 85% so that the analysis result will be highly
reliable.
The survey contains questions about various
aspects of IT education as explained in Section 2.
The detailed analysis of the answers is still on the
way. However the preliminary analysis result
described in this paper is still valuable in order to
understand the entire picture of the IT education at
Japanese university. For example, we can observe
that many departments of the different academic
domain provide IT education with different
distribution of the effort. We also find that many IT
departments are established at a cross disciplinary
domain of the traditional academic domains.
The final analysis result of the each survey type
will be published as a separate paper. The result will
be utilized by Information Processing Society of
Japan (IPSJ) to develop the new computing
education curriculum standard J17. The result will
also be reported to the Ministry of Education, Japan
as a fundamental statistics in order to discuss future
strategy and plan to improve college level IT
education in Japan.
ACKNOWLEDGEMENTS
The authors greatly appreciate the faculty members
and the secretariat staffs of the universities who take
time to answer the survey. This survey project is
supported by the Ministry of Education, Culture,
Sports, Science and Technology (MEXT), Japan.
REFERENCES
ACM, AIS, IEEE Computer Society, 2005, Computing
Curricula 2005: The Overview Report.
ACM, IEEE Computer Society, 2013, Computer Science
2013: Curriculum Guidelines for Undergraduate
Programs in Computer Science.
Hagiya, Masami, 2015, Defining informatics across Bun-
kei and Ri-kei, Journal of Information Processing, Vol.
23, No. 4, pp. 525-530.
Information Processing Society of Japan (IPSJ), 2008,
Computing Curriculum Standard J07. (in Japanese).
Kakeshita, Tetsuro, Ohtsuki, Mika, 2011, “A web-based
survey system to analyze outcomes and requirements:
a case for college level education and professional
development in ICT”, in Proc. 5-th Int. Multi-Conf. on
Society, Cybernetics and Informatics (IMSCI 2011),
pp. 82-87.
Kakeshita, Tetsuro, Ohtsuki, Mika, 2014, “Requirement
analysis of Computing Curriculum Standard J07 and
Japan Information Technology Engineers Examination
using ICT common body of knowledge”, Journal of
Information Processing, Vol. 22, No. 1, pp. 1-17.
A2E 2017 - Special Session on Analytics in Educational Environments
618
