
An RGB-D based Augmented Reality 3D Reconstruction System for
Robotic Environmental Inspection of Radioactive Areas
Giacomo Lunghi
1,2
, Raul Marin Prades
2
, Mario Di Castro
1,3
, Manuel Ferre
3
and Alessandro Masi
1
1
CERN, Geneva, Switzerland
2
Universitat Jaume I, Castellon de la Plana, Spain
3
Centre for Automation and Robotics UPM-CSIC, Madrid, Spain
Keywords:
Robotic Systems, 3D Reconstruction, Sensors Fusion, Environmental Monitoring and Control, Guidance,
Navigation and Control, 3D Reconstruction and Augmented Reality.
Abstract:
Preparing human intervention in hazardous, unknown and unstructured environments is a difficult task. The
intervention should focus on the optimization of the operations in order to reduce the personnel exposure to
hazards. Optimizing these operations is not always possible, due to a lack of information about the interven-
tion environment: such information can be collected through a robotic inspection before the preparation of the
intervention. The data collected during this inspection, such as radiation, temperature and oxygen level, must
be accurate and precisely positioned in the environment in order to optimize the humans approaching path and
their stay in the intervention area. In this paper we present a robotic system for collecting physical quanti-
ties, precisely positioned in the environment, which is easy to use by the robot operator and it is seamlessly
integrated in the robot control. The operator is helped by the system in finding the most dangerous zones,
which collects all the sensor readings while building a 3D model of the environment. Preliminary results are
presented using CERN’s accelerators facilities as testing area.
1 INTRODUCTION
Robotic systems are becoming predominant in indus-
trial facilities in order to reduce human exposure to
hazards (e.g. chemical risks, electrical risks, radiation
and contamination risks, etc.). Nevertheless, some
activities are still too difficult to be performed by
robotic systems, whether autonomously or remotely
operated, especially when facing highly unstructured
environments and difficult manipulation tasks such as
drilling and soldering (Kershaw et al., 2013).
Usually, the preparation for such interventions re-
quires a risk analysis (Modarres, 2006) and human
training in order to optimize the procedures and re-
duce the exposure time to the hazards, as well as re-
duce damages to the equipment and the environmen-
tal impact of the activity.
CERN, the European Center for Nuclear Re-
search, uses an approach for the preparation of these
interventions called ALARA (As Low As Reasonably
Achievable). CERN ALARA (Wijnands, ) (Dumont
et al., 2016) aims to reduce human exposure to ra-
diation at the minimum and to reduce the radiologi-
cal impact on the environment focusing on three main
principles: justification, limitation and optimization
(Forkel-Wirth et al., 2013). Nevertheless, the prepa-
ration for the intervention is not always easy, due to a
lack of information about the failed component which
requires the intervention and about the environmen-
tal characteristics that could be found in place. At
CERN, simulation softwares are used to predict the
radiation dose rate in a certain place (Battistoni et al.,
2007): however, these simulations could be far from
reality due to the small amount of data about the real
radiation in place.
Measuring radiation is not an easy task: the ra-
diation dose rate is extremely dependent on the dis-
tance from the radioactive object (Leader, 1978) and
a big amount of values has to be collected in multiple
places to have a precise radiation dose rate map of the
object. This process is not easy when applied to com-
plex objects (e.g. collimators), or to objects which
are not easy to reach. These measures are taken both
manually, using a fixed length stick to put the radi-
ation monitor always at the same distance from the
object, or automatically using fixed radiation moni-
tors, which passively collect the radiation dose and
are read when there is the possibility to reach them
Lunghi, G., Prades, R., Castro, M., Ferre, M. and Masi, A.
An RGB-D based Augmented Reality 3D Reconstruction System for Robotic Environmental Inspection of Radioactive Areas.
DOI: 10.5220/0006395802330238
In Proceedings of the 14th International Conference on Informatics in Control, Automation and Robotics (ICINCO 2017) - Volume 2, pages 233-238
ISBN: Not Available
Copyright © 2017 by SCITEPRESS – Science and Technology Publications, Lda. All rights reserved
233

(Spiezia et al., 2011), or by bringing a radiation mon-
itor in place using a robotic system.
Collecting radiation measurements using a robotic
system is not a straightforward process for the reasons
presented before: teleoperating a robotic arm in order
to position precisely a radiation sensor is often dif-
ficult, especially when measuring equipment which
are not easily reachable; furthermore, sometimes ”hot
zones” are missed due to the unawareness of the op-
erator about the environment during the inspection.
In this paper we address the problem of easily
gathering radiation measurements precisely localized
in the environment and around the equipment, in or-
der to provide radiation experts and simulation soft-
wares with a precise environmental 3D model to-
gether with the necessary environmental information
such as radiation, oxygen level, temperature etc. The
operator is driven using a gradient ascending method
to the ”hot zones” to better characterize those ar-
eas. The system is composed by a robotic platform
equipped with a robotic arm. Multiple RGB-D sen-
sors are installed both on the platform and on the arm
for precise 3D reconstruction. Then, the robotic sys-
tem is equipped with the necessary sensors for mea-
suring radiation, temperature or other physical quan-
tities.
The paper proceeds as follows: in the next sec-
tion the proposed system is presented, focusing on
the hardware, on the data collection, transmission and
post-processing. Afterwards, experimental results are
shown and explained. Finally, the conclusions and the
outlook of this paper are presented.
2 THE PROPOSED SYSTEM
The proposed system (figure 1) can host several RGB-
D cameras. RGB-D cameras are image acquisition
sensors which are able to provide RGB images to-
gether with depth information of the scene. Such
sensors are widely used for various applications such
as body tracking (Taylor et al., 2016), facial recog-
nition (Li et al., 2013), environmental reconstruction
(Zollh
¨
ofer et al., 2014) and augmented reality. RGB-
D cameras rely either on stereo vision technology or
on time-of-flight sensing and they are widely used in
robotics, since they provide spatial information about
the environment surrounding the robot and they can
be used for navigation, for autonomous grasping and
other tasks. With respect to laser scanners, RGB-D
cameras they are a cheaper and usually smaller solu-
tion for robotic applications, even if they provide a
limited field of view, the depth information is more
noisy and the depth range is usually limited (from 10
cm to 4-5 meters) (Cruz et al., 2012). Nevertheless,
they provide colored point clouds which are usually
more useful for 3D reconstruction and visualization
applications. For these reasons, they have been cho-
sen as the best depth sensor for this work. However
one RGB-D camera is not enough to build a precise
map of the environment due to its limited field of
view, so multiple RGB-D cameras have been installed
on the system.
The robotic platform is equipped with a 6 DoF
robotic arm and with a Simultaneous Localization and
Mapping system (Di Castro et al., ). The SLAM algo-
rithm uses a 2D laser scanner and an IMU, which are
fused together using a lightweight incremental algo-
rithm, in order to compute the pose of the robotic plat-
form in the environment. To be noted that the SLAM
algorithm is not used only for this purpose but also to
provide autonomous navigation capabilities and self-
recovery capabilities. For this reason it is not conve-
nient to use SLAM algorithm based directly on the
RGB-D cameras (such as (Engelhard et al., 2011) and
(Izadi et al., 2011)) which are usually more comput-
ing demanding and rely on sensors that, as previously
said, are less accurate than laser scanners.
The operator controls the robot and the data col-
lection system using a multi-modal Graphical User
Interface, which allows the operator to control the
robot using different input device and to control sev-
eral sensors equipped on it (Lunghi et al., 2016).
In the following section, the details about the 3D
reconstruction system are presented.
2.1 Data Collection and Transfer
The Graphical User Interface provides a 3D view of
the robot in the current configuration. In this way the
operator is always aware of the position of the robot
in order to avoid singularities or self-collisions during
the operation. From this 3D view, the operator starts
the process of data collection.
When the process starts, a snapshot from all the
RGB-D sensors installed on the system is taken to-
gether with the pose of each sensor in the space, as
well as the sensor readings from all the sensors that
the operator wants to collect. The pose of each sensor
is known since both the Graphical User Interface and
the robotic system know the robot topology and the
relative position of each component with respect to
the others. Merging this information with the output
of the SLAM algorithm allows the system to know
precisely the pose of each sensor in the space. The
forward kinematic of the robotic arm is used to com-
pute the pose of the RGB-D cameras installed along
the arm.
ICINCO 2017 - 14th International Conference on Informatics in Control, Automation and Robotics
234
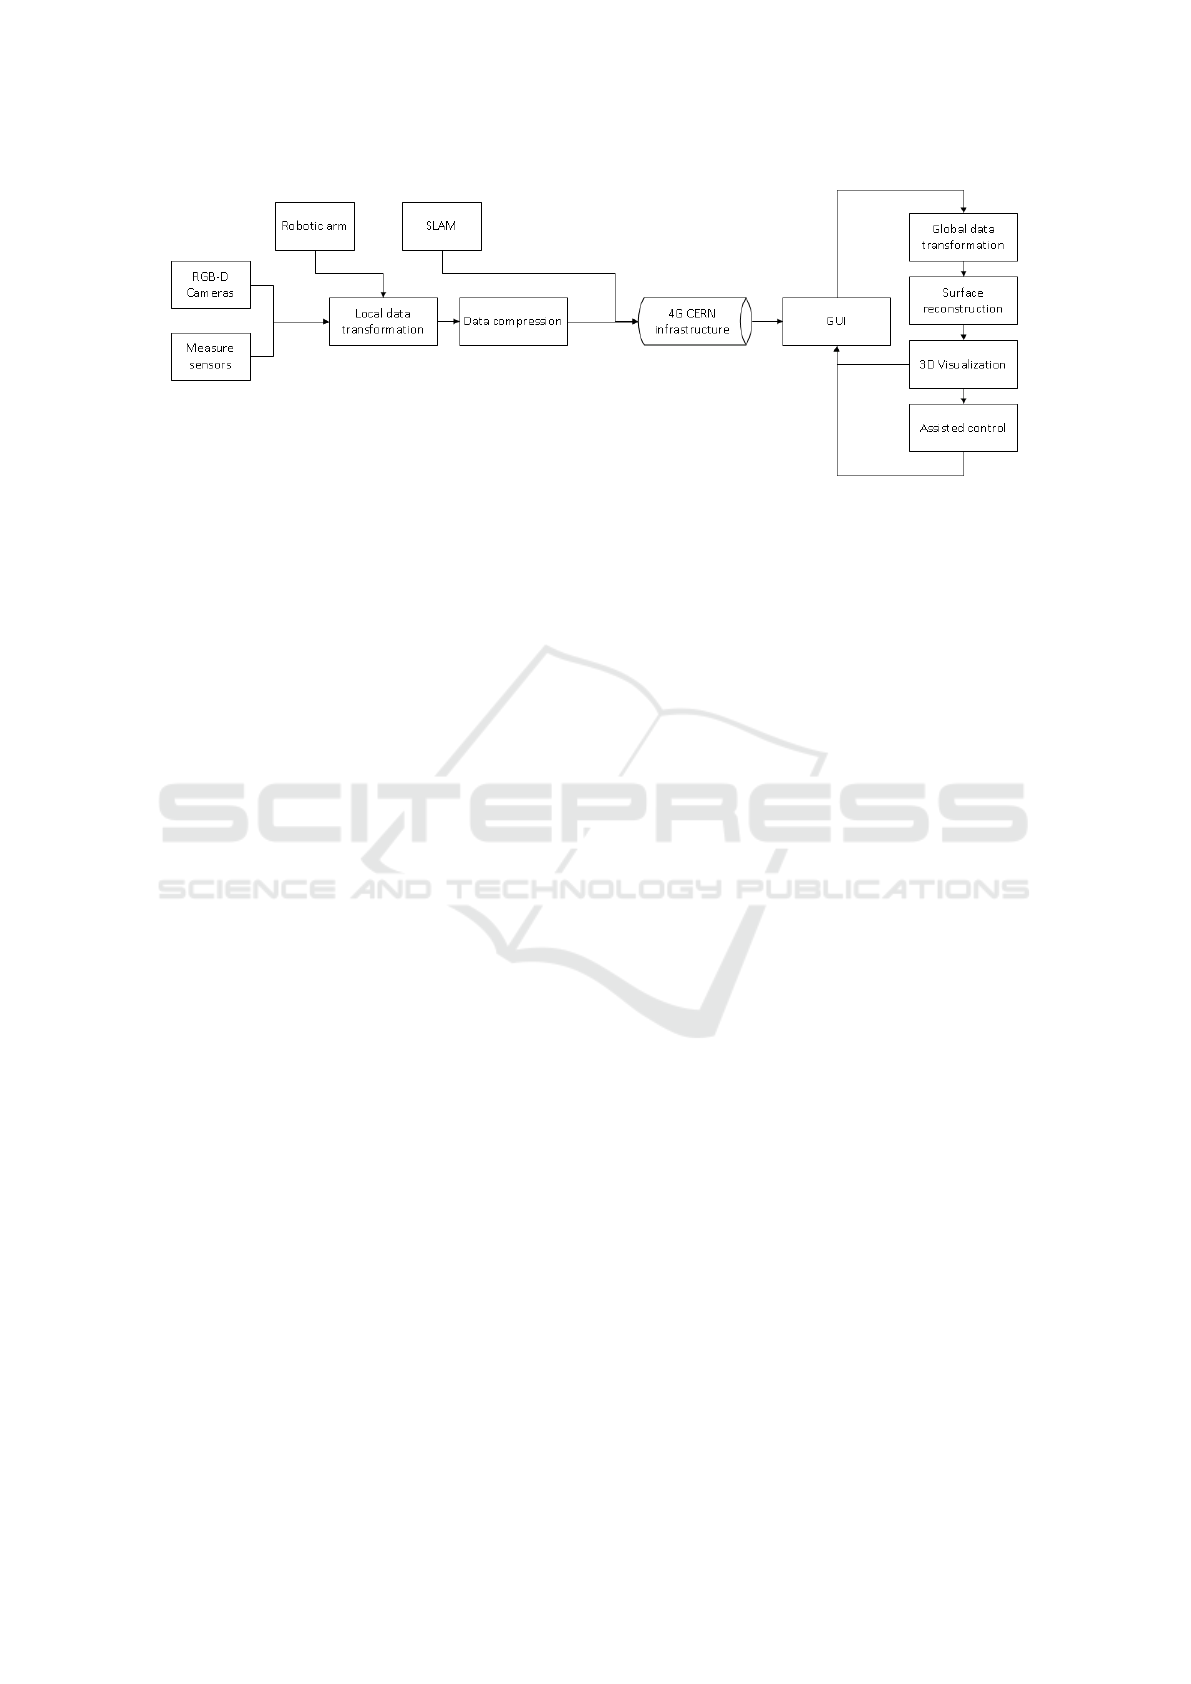
Figure 1: The proposed system structure: the data is collected from the RGB-D cameras and the environmental sensors. The
data is locally transformed, compress and finally sent over the 4G network trough TCP socket. The GUI receives the data
and it transforms it to the global reference frame. Then, the surface reconstruction algorithm take place. Finally, the assisted
control helps the operator to easier find ”hot-spots”, if activated.
Knowing all this information (the point clouds
coming from each sensor and the pose of each sensor)
it is possible to create a unique point cloud in which
each point is referenced to a fixed frame, that is the
origin of the SLAM system. The coordinate with re-
spect to the local reference frame can be computed as
follows:
x
l
y
l
z
l
= T
Local
x
rgbd
y
rgbd
z
rgbd
(1)
where T
Local
is the local transformation of the
RGB-D sensor with respect to the robotic platform
reference frame. In case the RGB-D sensor is
mounted on a robotic arm:
T
Local
= T
Arm
T
FK
(2)
where T
Arm
is the transformation matrix of the arm
reference frame with respect to the platform reference
frame and T
FK
is the robotic arm forward kinematic.
The amount of the data generated by this snap-
shot operation is big: for this reason, some operations
on the data are performed before being sent to the
Graphical User Interface. Most of the RGB-D sen-
sors return the points of the point-cloud as an array
of float (4 bytes) in meters. At first, each point is
converted in millimeters and then to signed short (2
bytes): this operation is possible because the max-
imum distance that could be inserted in a short is
32767mm that is far more than the maximum range
of any RGB-D sensor. With this operation, the size in
bytes of the point cloud is reduced by half. Further-
more, the resulted bytes are compressed using a gzip
algorithm (Deutsch, 1996). This reduces enormously
the amount of bytes that has to be transferred between
the robotic system and the GUI.
At this point, the data are sent through a TCP
socket to the GUI. The data are also collected and
stored in the system, in order to have a backup.
2.2 Surface Reconstruction
When the GUI receives the latest point cloud from the
robotic system, it transforms the point cloud from the
local reference frame to the global reference frame
according to this equation:
x
g
y
g
z
g
= T
SLAM
x
l
y
l
z
l
(3)
where T
SLAM
is the transformation matrix of the
robotic platform with respect to the global reference
frame coming from the SLAM algorithm.
The collected data are shown on the 3D visual-
izer of the GUI: the operator sees then collected point
clouds and the 3D model of the robotic system in
it. Though, the point clouds don’t display very well
when visualized; especially when zoomed, a point
cloud risks to appear on the screen as an unordered
set of colored points. In order to provide the opera-
tor with a better visualization, a rough surface recon-
struction from the point cloud is done. This surface
reconstruction involves only the latest point cloud re-
ceived and not the entire point cloud collected so far:
for this reason some imperfection could appear on it,
such as compenetration between surfaces. However,
as already pointed out, the purpose of this surface re-
construction is not to create an accurate 3D model but
to provide the operator with a more accurate view of
the scene with respect to the simple point cloud. Bet-
ter surface reconstruction mechanism, even based on
CAD models, could be applied off-line at the end of
the inspection.
An RGB-D based Augmented Reality 3D Reconstruction System for Robotic Environmental Inspection of Radioactive Areas
235
The algorithm proposed in (Hoppe et al., 1992) is
applied only to the latest point cloud received and it is
showed to the operator.
2.3 Sensor Fusion for Augmented
Reality 3D Reconstruction
In parallel with the point cloud collection and the sur-
face reconstruction process, the Graphical User Inter-
face receives the data coming from the environmental
sensors (e.g. radiation, temperature, oxygen level and
so on). This data, exactly like the point cloud, can be
positioned in the global reference frame using Equa-
tion (3).
The data are stored in an octree structure
(Meagher, 1982) with a fixed resolution: this allows
to have different physical dimensions for each octree
cell (i.e. having for each cell radiation, temperature
etc.) but also to reduce the amount of data for each
dimension. More in detail, each octree node contains
an array of objects, each one representing a physical
quantity. Each object contains the sum of the data col-
lected so far and the number of data collected. When
adding a measure to the octree, the system checks
if the octree cell already contains data; if it doesn’t,
the system creates an octree node in that cell, adding
the latest measures; otherwise, it updates the cell data
values computing an average between the latest mea-
sures and the previously collected data. In this way,
while moving, multiple data at the same coordinates
are collected, but only the average is stored. This
method could create problems when measuring val-
ues that are rapidly changing in time: nevertheless,
it is possible to assume that the quantities of interest,
such as radiation and temperature, are constant during
the intervention time.
2.4 Assisted Control
In order to better map the environment, the GUI can
help the operator to drive the robot in the most inter-
esting places by analyzing the data collected so far.
When dealing with radiation, two main tasks should
be performed: measuring the radiation always at the
same distance (which, for CERN, is standard at 40
cm) and finding the point with the highest radiation
level.
For the first task, the operator can choose an inter-
esting surface on the GUI: the operator can now drive
the robotic platform along the surface while the GUI
will take care, by sending commands to the robotic
arm and by modifying slightly the command sent by
the operator to the platform, of keeping the radiation
sensor always at the same distance from this surface.
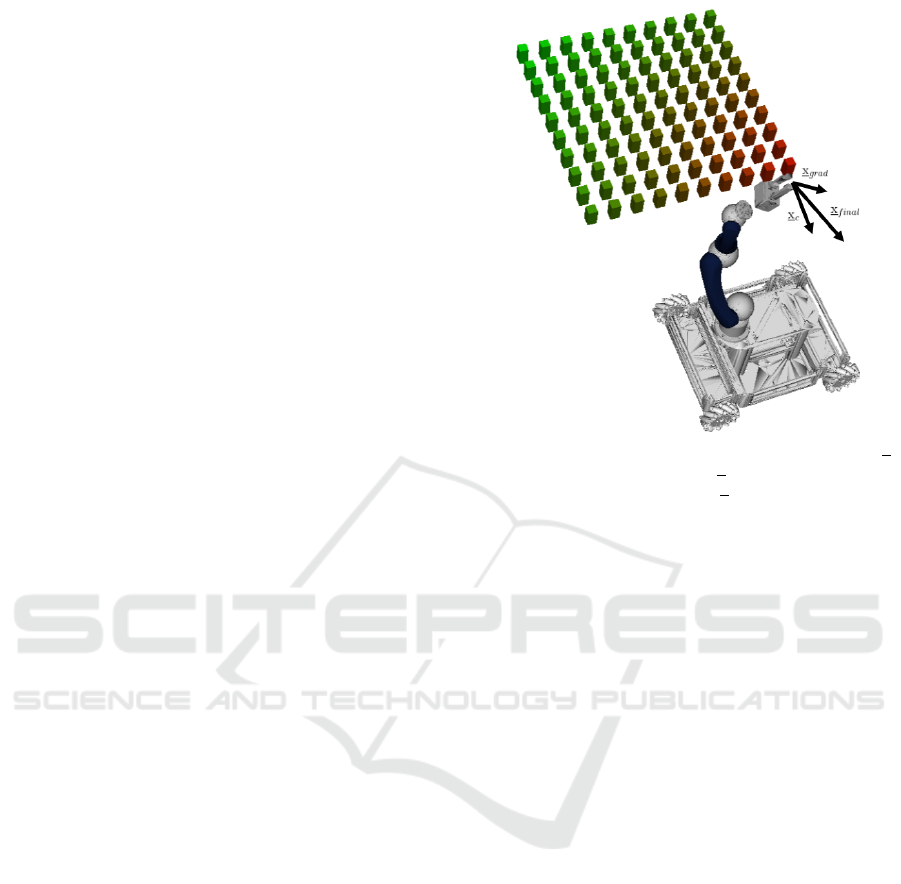
Figure 2: Graphical illustration of the assisted control. x
c
represents the operator’s control, x
grad
is the output of the
gradient ascending algorithm and x
f inal
is the final control
sent to the robot.
For the second task, instead, the GUI computes the
gradient of the physical dimension of interest while
moving and it helps the operator, by slightly correct-
ing his commands, to follow the computed gradient.
This is done by computing the sum of the velocity
vector coming from the operator’s commands with re-
spect to the global reference frame and the gradient of
the physical dimension in that point. A graphical rep-
resentation of the assisted control is shown in Figure
2.
For safety reasons, the assisted control is respon-
sible of helping the operator during the movement but
can’t move autonomously the robot. Furthermore, the
assisted control can’t modify excessively the opera-
tor’s commands, who is always able to take the full
control of the robotic system. If the output of the as-
sisted control is too different with respect to the op-
erator’s commands, the assisted control is interrupted
and must be manually restored by the operator.
3 EXPERIMENTAL RESULTS
For the experimental validation, the robot in figure 3
has been used. The robotic platform equips a 6 DoF
robotic arm, several cameras and sensors. It mounts
omni-wheels for an easier approach to the beam line.
The communication with the robot relies on the 4G in-
ternal network which is available on the entire CERN
domain (Agosta et al., 2015).
Specifically for these experiments, two RGB-D
ICINCO 2017 - 14th International Conference on Informatics in Control, Automation and Robotics
236
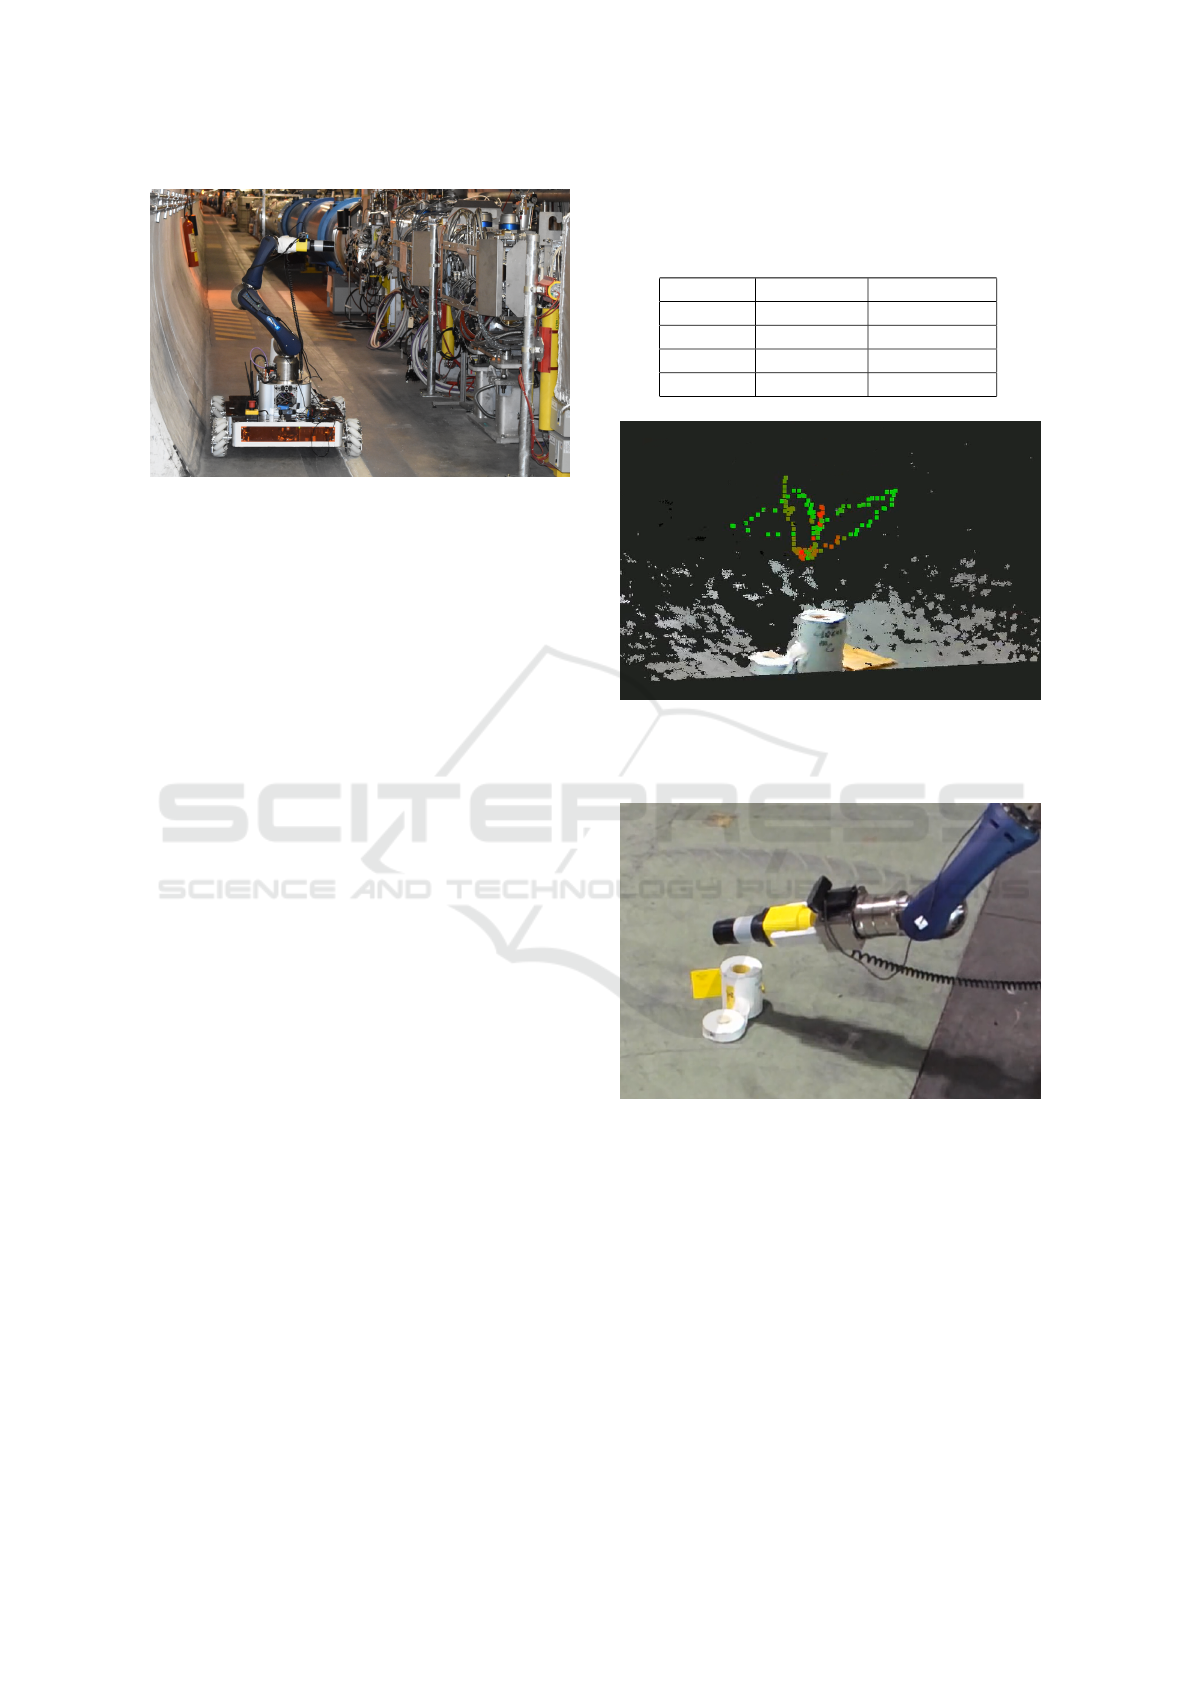
Figure 3: The robotic system used for this project during a
test in front of a collimator of the LHC tunnel in Point 5.
cameras were equipped, an Intel RealSense R200 and
an Intel RealSense SR300: the two cameras provide
different specifications in terms of resolution, range
and accuracy.
In this first part, the performances of the point
cloud compression process are shown. This process
is particularly important in order to reduce the traffic
over the 4G communication and not to interfere with
the cameras’ streams and the operator’s control com-
mands. As described in section 2.1, the data is first
collected from the sensors and transformed to the lo-
cal reference frame, then the points clouds are trans-
formed in millimeter in order to change the data type
of the point cloud and finally the point cloud is com-
pressed using the gzip algorithm and sent over a TCP
socket. In table 1, a comparison in size between the
original point cloud and the compressed one for dif-
ferent number of points is presented. While the origi-
nal point cloud is reduced by a fixed factor by the con-
version to the millimeters one, the performances of
the compression using the gzip algorithm is dependent
on the correlation between the points. Nevertheless,
being the point cloud a scan of a real component with
well defined surfaces and with homogeneous colors,
the correlation between the points is usually high, re-
sulting in good compression performances. In the ta-
ble are not indicated the round-trip time of the com-
munication when transmitting a point cloud: 4G com-
munication in underground areas is not always stable
and efficient, showing sudden drop-off of the band-
width in certain places. Measuring the performance
of the communication using the round-trip time is not
meaningful, since the communication bandwidth is
not under the operator control.
Once the data are compressed and sent from the
robot to the Graphical User Interface, the processes
explained in section 2.2 and 2.3 are executed. A real
scenario result is shown in figure 4: a radioactive
source was positioned in front of the robot inside a
Table 1: Dimension of the original point cloud, dimension
of the point cloud after being converted to millimeters and
dimension of the point cloud after the gzip compression.
Data are expressed in KB.
Original Converted Compressed
380 230 152
498 298 198
860 516 215
1014 608 381
Figure 4: A 3D reconstruction of a radioactive source in-
side a white lead shielding. The radiation is only perceiv-
able above the small hole on top of the shielding. The 3D
reconstruction includes the radiation map around the object.
Figure 5: A picture of the real scenario reconstructed in
figure 4.
white lead storage. The radiation of the source was
perceivable only above the small hole on top of the
lead storage. In the image is notable how the radi-
ation increases when moving the robotic arm above
the hole and when moving closer to the source. The
reconstruction shown in the figure is the one that is
provided live to the operator during the operation.
Figure 4 highlights also the performances of the
assisted control: it is notable how the movement of
the robotic arm was always towards the maximization
of the radiation. During this process, the operator has
always the full control of the robot and the robot does
An RGB-D based Augmented Reality 3D Reconstruction System for Robotic Environmental Inspection of Radioactive Areas
237

not move autonomously if the operator is not sending
any command. In this test the operator was simply
trying to center the arm above the hole of the con-
tainer and the control system was helping the operator
by slightly modifying the operator’s commands.
4 CONCLUSIONS AND
OUTLOOK
In this paper we presented a usable system for remote
environmental inspection. The data collected during
the inspection are used afterwards for the preparation
of a human intervention and for the integration with
simulation softwares. The system is easy to use on the
operator side and the collected data are shown in real
time on a Graphical User Interface. The GUI helps
can help the operator to collect the data based on the
data collected so far.
In future, this system could be integrated with an
anti-collision system which creates in real-time an oc-
cupancy grid map of the environment using the data
collected with the RGB-D cameras. This could allow,
coupled with path planning strategies, an autonomous
data collection approach.
Furthermore, a 3D alignment algorithm between
point clouds and CAD models can be added to the
system, in order to obtain remove the sensor noise
from the model and being able to compute precisely
the distance between the measure and the object.
REFERENCES
Agosta, S., Sierra, R., and Chapron, F. (2015). High-speed
mobile communications in hostile environments. In
Journal of Physics: Conference Series, volume 664,
page 052001. IOP Publishing.
Battistoni, G., Cerutti, F., Fasso, A., Ferrari, A., Muraro,
S., Ranft, J., Roesler, S., Sala, P., Albrow, M., and
Raja, R. (2007). The fluka code: Description and
benchmarking. In AIP Conference proceedings, vol-
ume 896, pages 31–49. AIP.
Cruz, L., Lucio, D., and Velho, L. (2012). Kinect and rgbd
images: Challenges and applications. In Graphics,
Patterns and Images Tutorials (SIBGRAPI-T), 2012
25th SIBGRAPI Conference on, pages 36–49. IEEE.
Deutsch, L. P. (1996). Gzip file format specification version
4.3.
Di Castro, M., Masi, A., Lunghi, G., and Losito, R. An in-
cremental slam algorithm for indoor autonomous nav-
igation.
Dumont, G., Pedrosa, F. B. D. S., Carbonez, P., Forkel-
Wirth, D., Ninin, P., Fuentes, E. R., Roesler, S., and
Vollaire, J. (2016). Integrated operational dosimetry
system at cern. Radiation Protection Dosimetry.
Engelhard, N., Endres, F., Hess, J., Sturm, J., and Burgard,
W. (2011). Real-time 3d visual slam with a hand-held
rgb-d camera. In Proc. of the RGB-D Workshop on
3D Perception in Robotics at the European Robotics
Forum, Vasteras, Sweden, volume 180, pages 1–15.
Forkel-Wirth, D., Roesler, S., Silari, M., Streit-Bianchi,
M., Theis, C., Vincke, H., and Vincke, H. (2013).
Radiation protection at cern. arXiv preprint
arXiv:1303.6519.
Hoppe, H., DeRose, T., Duchamp, T., McDonald, J., and
Stuetzle, W. (1992). Surface reconstruction from un-
organized points, volume 26. ACM.
Izadi, S., Kim, D., Hilliges, O., Molyneaux, D., Newcombe,
R., Kohli, P., Shotton, J., Hodges, S., Freeman, D.,
Davison, A., et al. (2011). Kinectfusion: real-time 3d
reconstruction and interaction using a moving depth
camera. In Proceedings of the 24th annual ACM sym-
posium on User interface software and technology,
pages 559–568. ACM.
Kershaw, K., Feral, B., Grenard, J.-L., Feniet, T., De Man,
S., Hazelaar-Bal, C., Bertone, C., and Ingo, R. (2013).
Remote inspection, measurement and handling for
maintenance and operation at cern. International
Journal of Advanced Robotic Systems, 10(11):382.
Leader, J. C. (1978). Atmospheric propagation of partially
coherent radiation. JOSA, 68(2):175–185.
Li, B. Y., Mian, A. S., Liu, W., and Krishna, A. (2013). Us-
ing kinect for face recognition under varying poses,
expressions, illumination and disguise. In Applica-
tions of Computer Vision (WACV), 2013 IEEE Work-
shop on, pages 186–192. IEEE.
Lunghi, G., Marin Prades, R., and Di Castro, M. (2016).
An advanced, adaptive and multimodal graphical user
interface for human-robot teleoperation in radioactive
scenarios. In Proceedings of the 13th International
Conference on Informatics in Control, Automation
and Robotics, volume 2, pages 224–231. ICINCO.
Meagher, D. (1982). Geometric modeling using octree en-
coding. Computer graphics and image processing,
19(2):129–147.
Modarres, M. (2006). Risk analysis in engineering: tech-
niques, tools, and trends. CRC press.
Spiezia, G., Brugger, M., Peronnard, P., Roeed, K., Masi,
A., Kramer, D., Calviani, M., Wijnands, T., Ferrari,
A., Pignard, C., et al. (2011). The lhc radiation moni-
toring system-radmon. PoS, page 024.
Taylor, J., Bordeaux, L., Cashman, T., Corish, B., Keskin,
C., Sharp, T., Soto, E., Sweeney, D., Valentin, J.,
Luff, B., et al. (2016). Efficient and precise interactive
hand tracking through joint, continuous optimization
of pose and correspondences. ACM Transactions on
Graphics (TOG), 35(4):143.
Wijnands, T. Alara principles: Cern alara approach. In SPS
technical coordination meeting, volume 10.
Zollh
¨
ofer, M., Nießner, M., Izadi, S., Rehmann, C., Zach,
C., Fisher, M., Wu, C., Fitzgibbon, A., Loop, C.,
Theobalt, C., et al. (2014). Real-time non-rigid recon-
struction using an rgb-d camera. ACM Transactions
on Graphics (TOG), 33(4):156.
ICINCO 2017 - 14th International Conference on Informatics in Control, Automation and Robotics
238
