
Fuzzy Logic Control for Varied Inspection for Manufacturing Lead
Time Reduction
A Fuzzy Control Implementation of a Dynamic Inspection Technique to Reduce
Manufacturing Lead Time
Trishen Naidoo
1
, Anthony Walker
1
, Glen Bright
1
and Shaniel Davrajh
2
1
Mechanical Engineering, University of KwaZulu-Natal, Durban, South Africa
2
Mining Engineering and Mine Surveying, University of Johannesburg, Johannesburg, South Africa
Keywords: Fuzzy Logic Control, Manufacturing Lead Time, Quality Control.
Abstract: Varied inspection is an online dynamic inspection method where the amount of parts inspected can be changed
based on the quality of the part stream and characteristics of the production system. The research outlines the
development of a supervisory and distributed Fuzzy Logic Controller (FLC) to perform varied inspection.
The supervisory fuzzy controller was used to tune the weights of the rules used in the distributed fuzzy
controller that initiates the varied inspection in quality control systems. Simulation of a single-station
manufacturing cell showed that varied inspection had significantly reduced Manufacturing Lead Time (MLT)
through reduced inspection, which could help manufacturers handle fluctuating demands. The contribution of
the study was to illustrate the benefit of varied inspection through MLT reduction and to add flexibility to
control architectures for quality control systems to aid manufacturers meet demands.
1 INTRODUCTION
Recent trends towards Mass Customization (MC) had
led to the research and development of flexible
technologies to mass produce different products
within a product family (Fogliatto et al., 2012).
Global market trends have fuelled companies to adapt
to customers’ demands (Tsourveloudis, 2000).
Research had been focused on flexible fixtures,
flexible machining, supply chain coordination, MC
economics and scheduling however, there has been
minimal emphasis on Quality Control (QC) for high
variety manufacturing environments (Fogliatto et al.,
2012). QC was traditionally defined by Juran (1998)
as methods to produce products that were “free from
deficiencies”. Traditional QC techniques include
control charts, check sheets and sampling (Davrajh et
al., 2012). QC needed to be developed to handle
product variations while still ensuring that customers
receive products of acceptable functionality.
Traditional QC hinged upon statistical inference as
part variation was minimal, therefore only samples
were inspected to deduce the quality of the entire
product population (Davrajh and Bright, 2010).
Increased part variation poses challenges to QC as
new strategies require flexible inspection methods
(Brabazon and MacCarthy, 2007).
Varied inspection was investigated as a flexible
form of inspection for MC. Varied inspection was
defined by the authors as a QC strategy where the
frequency of inspection could be increased or
decreased based on the needs of the manufacturer.
Naidoo et al. (2016) illustrated that varied inspection
could be used in reducing Work-In-Process (WIP).
WIP reduction remains a goal in lean, agile and Just-
In-Time (JIT) manufacturing (Tsourveloudis, 2000),
(Tsourveloudis et al., 2007). A Fuzzy Logic
Controller (FLC) was used to perform the varied
inspection because it could handle imprecise inputs
while performing adequate control. The aim of the
research was to test the performance of varied
inspection on reducing Manufacturing Lead Time
(MLT) with a supervisory and distributed fuzzy
controller. MLT reduction warrants that parts spend
less time in processing thus ensuring robust response
to demands, which is a requirement for the successful
operation of MC. The motivation for this research
was to illustrate the advantages of varied inspection
by aiding a common performance metric such as
MLT reduction. The novelty lies in using QC to
regulate production for better responsiveness and
Naidoo, T., Walker, A., Bright, G. and Davrajh, S.
Fuzzy Logic Control for Varied Inspection for Manufacturing Lead Time Reduction - A Fuzzy Control Implementation of a Dynamic Inspection Technique to Reduce Manufacturing Lead Time.
DOI: 10.5220/0006395902070214
In Proceedings of the 14th International Conference on Informatics in Control, Automation and Robotics (ICINCO 2017) - Volume 1, pages 207-214
ISBN: 978-989-758-263-9
Copyright © 2017 by SCITEPRESS – Science and Technology Publications, Lda. All rights reserved
207

robustness to demands. Existing approaches to MLT
reduction rely on flow control techniques that
required mathematical models to predict MLT.
Varied inspection can be viewed as a flow control
technique however, it does not require mathematical
modelling because of the fuzzy implementation–
which is useful in complex manufacturing situations
where the models are difficult to acquire.
2 LITERATURE REVIEW
2.1 Varied Inspection for Quality
Control in Mass Customization
Varied inspection is an aperiodic inspection method
compared to traditional methods. The inspection
system may choose to inspect or not inspect parts as
they pass through production based on factors such as
part quality, supply/demand, WIP, MLT,
bottlenecking, starving or other needs of the
manufacturer (Naidoo et al., 2016). The research was
focused on part quality and MLT reduction, whereas
previous research done by Naidoo et al., (2016)
focused on WIP reduction. MLT reduction was
desired as parts provide no profit while they remain
unfinished and in production. Through reducing the
amount of time on inspection, parts spend less time in
production thus reducing lead time. Shorter lead time
ensures better robustness to manufacturers in
supplying demands. Table 1 shows common
characteristics of varied inspection in terms of
advantages and disadvantages (Naidoo et al., 2016).
Table 1: Characteristics of Varied Inspection.
Advantages Disadvantages
Appraisal costs are reduced
through reduced inspection.
Could allow defective parts to
move throughout the system.
Can be used to prevent
bottlenecking by
increasing/decreasing the
number of inspected
products.
May result in external failure
costs when products fail at the
site of the customer.
Over-inspection is reduced.
High average consequence
costs.
Reduced average MLT as
reduced inspection reduces
overall production time.
Reduced WIP as some parts
are sent through the
production without
inspection.
The significant advantage of varied inspection (as
compared to 100% inspection and acceptance
sampling) was that the inspection frequency was not
fixed – it could be adjusted to suit the production
requirements. Varied inspection could be
implemented as a solution to slow inspection that
affects production rates (Davrajh and Bright, 2010).
However, Groover (2014) stated that this type of
inspection yielded high average consequence costs.
2.2 Fuzzy Logic Control for Production
Systems and Varied Inspection
FLCs had been used in production systems to
improve control since the 1990s (Homayouni et al.,
2009). However, Azadegan et al., (2011) stated that
there was minimal FL applications in the field of QC.
Complex manufacturing environments are difficult to
analytically model and probability theory cannot be
used to solve all manufacturing issues, which was
why fuzzy set theory was supported for control over
production (Tsourveloudis, 2000), (Gien, 1999). A
FLC was used in this research as it could handle
imprecise inputs and does not require a model of the
system to control it (Naidoo et al., 2016). Classical
control methods require accurate mathematical
models for effective control- fuzzy control is a
heuristic control approach thus the complex task of
obtaining mathematical models are not required. A
great advantage of FLCs is that it represents an
extension of human logic and can be based on human
evaluations, therefore it can replicate how a human
expert would control a system (Tsourveloudis, 2000).
FLCs have learning capabilities and can be improved
with other computational tools such as neural
networks and Evolutionary Algorithms (EA)
(Homayouni et al., 2009). Research done by Naidoo
et al. (2016) showed that a FLC could be used to
perform varied inspection for the purpose of WIP
reduction. This research was to investigate the effects
of varied inspection on MLT, where fuzzy controllers
are “Mamdani-type” with rules in the form of (1).
IF X is A AND Y is B THEN Z is C
(RuleWeight)
(1)
X and Y are the inputs with A and B linguistic values
respectively, and Z is the output with C linguistic
values. Linguistic values are the fuzzy sets that
consist of membership functions (Ioannidis et al.,
2004). The “RuleWeight” determines the strength of
the rule with ‘1’ having the strongest weight. The
fuzzy controllers designed used minimum for “AND”
and the centroid method for defuzzification. The
controllers were designed with the Fuzzy Logic
Toolbox
®
in Simulink
®
.
ICINCO 2017 - 14th International Conference on Informatics in Control, Automation and Robotics
208
2.3 Supervisory and Distributed Fuzzy
Control in Production Systems
Ioannidis, Tsourveloudis and Valavanis (2004) stated
that production systems could be viewed as a
“network of machines/work-stations and buffers”.
The authors introduced another module to the
network which was the “inspection system”.
Inspection systems are strategically placed in the
production system based on quality checks after
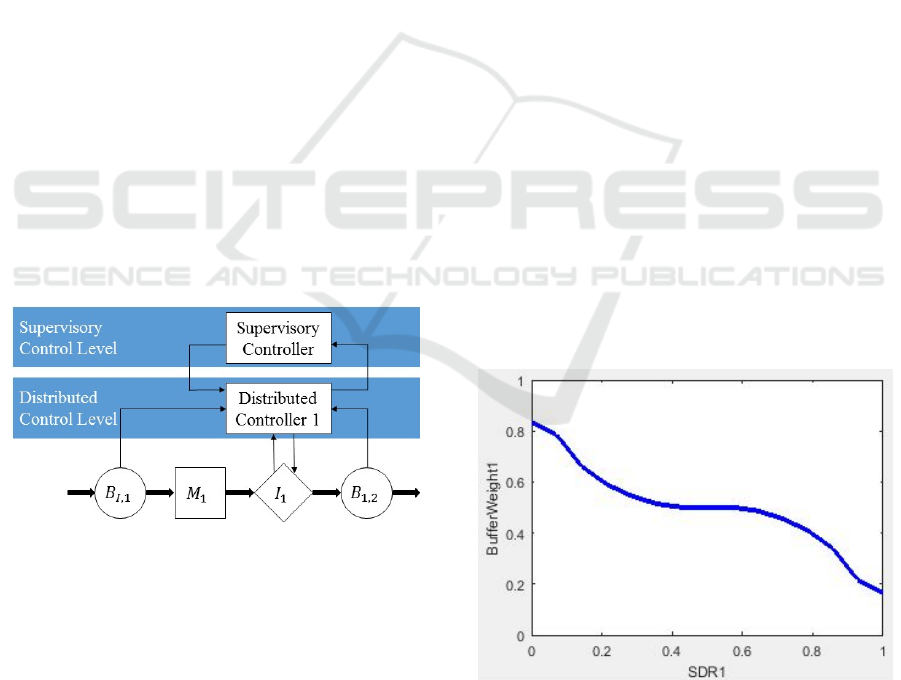
processing, assembly and/or disassembly. Figure 1
shows the control architecture for the research that
implemented a two-level control system. This
research was restricted to a single-station
manufacturing cell, where a single machine performs
machining on raw material to produce a finished
product. From Figure 1, B
I,1
represents a buffer, M
1
represents machining cell and I
1
represents the
inspection system.
The supervisory fuzzy control was previously
used by Ioannidis, Tsourveloudis and Valavanis
(2004) for a production network where it tuned
parameters in multiple distributed fuzzy controllers
(that control the processing rates of individual
machines) for the purpose of WIP reduction. This
research was similar to the work performed by
(Ioannidis et al., 2004), however the amount of
inspection was varied instead of the machining
processing rate, and the inputs to the supervisory
fuzzy controller was supplied from the distributed
controller and not from the overall production rate.
Figure 1: Supervisory Control Architecture for Varied
Inspection.
3 SUPERVISORY AND
DISTRIBUTED FUZZY
CONTROLLER DESIGN
The supervisory controller was used to tune the
distributed controller. The supervisory controller
used the Defect Rates (DRs) of the part stream to
calculate the weights of the rules (within the
distributed controller) that are affected by the buffer
level input. The supervisory fuzzy controller used the
DR as an input to determine the rule weights of the
distributed fuzzy controller only when the buffer
levels were high, as high buffer levels slow down
production thus leading to high MLT. The purpose of
the supervisory fuzzy controller was to ensure that
MLT reduction would not become a higher priority
such that part quality would be significantly
compromised. An FLC approach to supervisory
control was used as it could effectively tune lower-
level controllers. The supervisory FLC could also be
easily extended for more objectives other than MLT
reduction.
3.1 Supervisory Fuzzy Controller
The supervisory controller used the DR inputs from
the distributed controller to determine the rule
weights that concern the buffer levels reaching
maximum capacity of the distributed controller. The
supervisory control contained the rules of the form:
IF SDR1 is DR
(k)
THEN BufferWeight1 is
BW
(k)
(2)
Where k was the rule number (1,2,3) , DR was the
fuzzy set of the “Sampled Defect Rate” (SDR1) input
with linguistic values DR = {High, Average, Low}
using three Gaussian membership functions and BW
was the fuzzy set of the BufferWeight1 output with
linguistic values BW = {Low, Medium, High}. All
rules have the same weight of 1 with a generated
curve relating the BufferWeight1 output to the SDR1
input shown in Figure 2.
Figure 2: Relationship between BufferWeight1 and
Sampled Defect Rate (SDR).
3.2 Distributed Fuzzy Controller
Three inputs were described for the distributed fuzzy
Fuzzy Logic Control for Varied Inspection for Manufacturing Lead Time Reduction - A Fuzzy Control Implementation of a Dynamic
Inspection Technique to Reduce Manufacturing Lead Time
209
controller i.e. DR, buffer level and batch size. The DR
was used as an input to ensure that the inspection
intensity was dictated by the quality of the parts.
Trapezoidal membership functions were used for the
DR input with the linguistic values DR =
{ExtremeHigh, ModerateHigh, Average,
ModerateLow, ExtremeLow}. Buffer level was used
as in input to prevent buffers from reaching maximum
capacity or becoming too low that starving occurs,
described by two Gaussian membership functions for
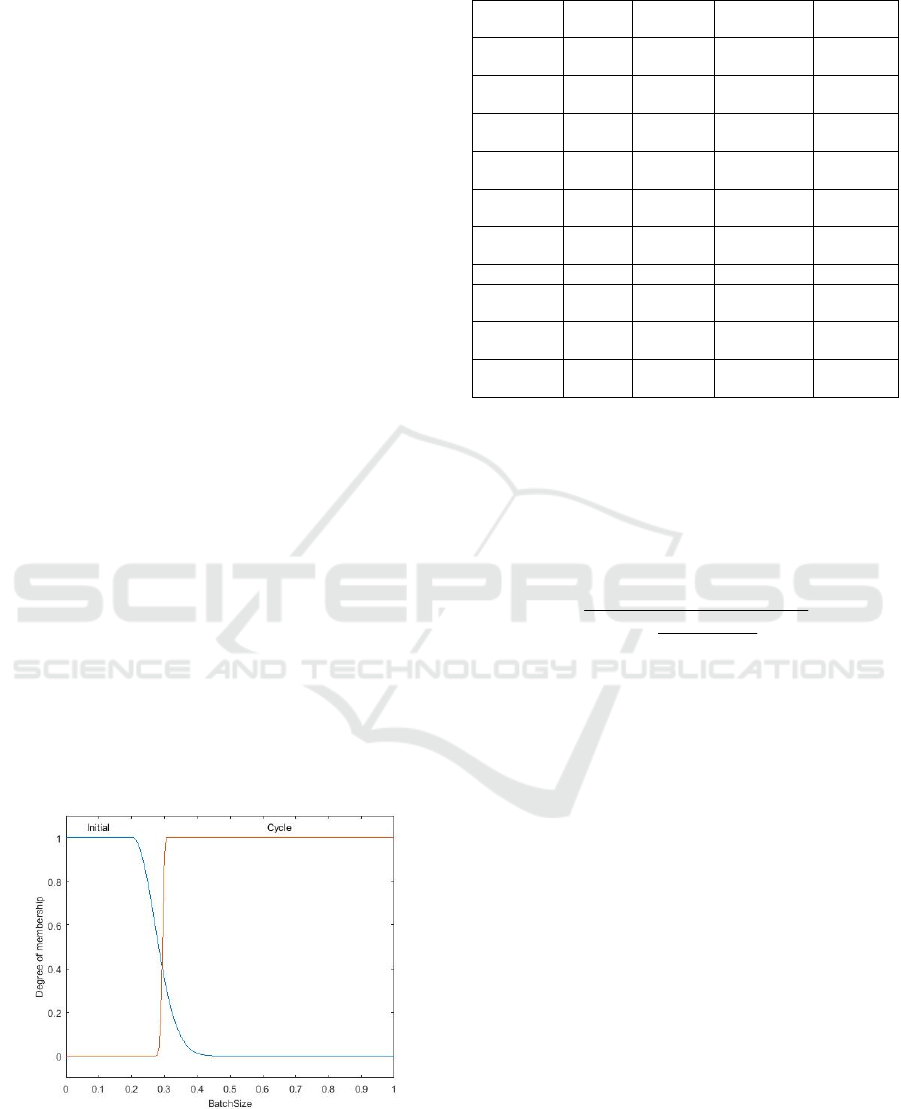
“Low” and “High”. The batch size input was used to
ensure that 100% inspection (screening) always
occurred at the beginning of the production as a
means of establishing the most accurate DR. The
amount of 100% inspection performed at the start was
determined by the Gaussian membership function
shown in Figure 3, where screening was performed
for the ‘Initial’ membership function and varied
inspection for the ‘Cycle’ membership function. The
“Initial” membership function ensures that the first
30% (pre-determined value) parts of the part stream
would be fully inspected. Ten rules were outlined for
the distributed controller, shown in Table 2. The
control actions were to perform 100% inspection at
the start of production, and to reduce the inspection
intensity where buffer levels were high – thus
reducing MLT. The prescribed rules ensured that
inspection intensity was always high at the start of
production, and that intensity should only be reduced
significantly when the DR input was also lowered to
reduce the occurrences of defective parts not being
inspected. The four rules associated with high buffer
levels (rules 4, 6, 8 and 10) have rule weights that
were set by the supervisory fuzzy controller. Only the
major rules were outlined as each input covered its
respective solution space.
Figure 3: Batch Size Membership Function.
Table 2: Distributed Fuzzy Controller Rule Set.
Defect
Rate
Buffer
Level
Batch
Size
Inspection
Intensity
Weight
0 0 Initial
Extreme
High
1
Extreme
High
0 Cycle
Extreme
High
1
Extreme
High
Low Cycle
Extreme
High
1
Moderate
High
High Cycle
Moderate
High
Buffer
Weight1
Moderate
High
Low Cycle
Moderate
High
1
Average High Cycle High
Buffer
Weight1
Average Low Cycle Medium 1
Moderate
Low
High Cycle Low
Buffer
Weight1
Moderate
Low
Low Cycle Medium 1
Extreme
Low
High Cycle Low
Buffer
Weight1
The output was the inspection intensity, which
was how much of the part stream to inspect. For
example, for an inspection intensity of 0.70 and 100
parts, 70 parts would be inspected and would be
Independent and Identically Distributed (IID)
throughout the 100 parts. IID implementation of the
inspection intensity was perform through (3):
]
]
)1(
1
log[
)]1(*)1,1(log[
[
Intensity
Intensityrand
floorp
(3)
Where p = 1 for “inspect” and p = 2 for “do not
inspect”. The “floor” function in Matlab
®
rounds
down towards negative infinity to the nearest integer,
“rand” was used for uniformly distributed random
number generation and “Intensity” was the inspection
intensity calculated from the distributed FLC.
Equation (3) was tested to determine how effective
the IID inspection could be performed. Multiple runs
showed that (3) was acceptable as a good realisation
of the inspection intensity when averaged out. An
averaging approach was used for the best realisation
of the inspection intensity with a sample size of 100
parts. Results between the actual intensity and the
averaged intensity were discussed in Section 5. From
the rules in Table 2 and membership functions,
surfaces can be used to view the relationships
between the inputs and outputs. Figure 4 shows the
relationships between the DR and buffer levels on
inspection intensity. Figure 5 shows the relationship
between the DR and batch size on the inspection
intensity output. Yellow areas (lightly shaded)
indicate when inspection intensity was high and blue
areas (dark shaded) indicate low inspection intensity.
ICINCO 2017 - 14th International Conference on Informatics in Control, Automation and Robotics
210
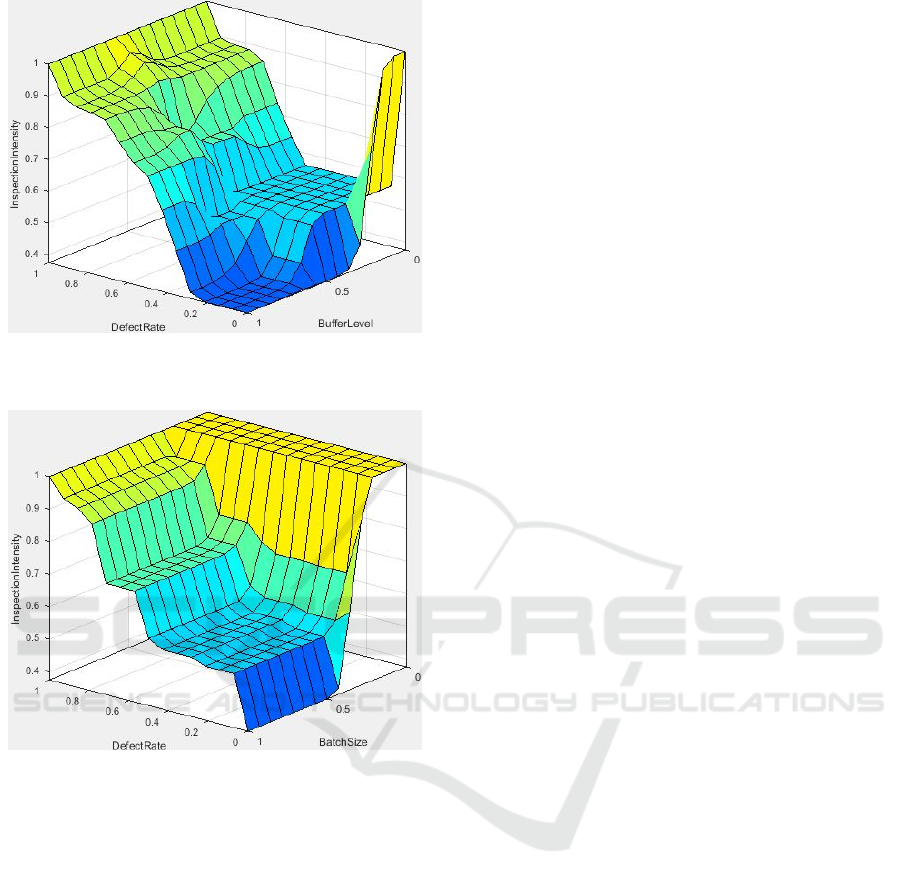
Figure 4: Surface View of Distributed Fuzzy Controller for
Defect Rate and Buffer Level Inputs.
Figure 5: Surface View of Distributed Fuzzy Controller for
Defect Rate and Batch Size Inputs.
4 SIMULATION OF FUZZY
LOGIC CONTROLLERS IN
MANUFACTURING CELL
The supervisory and distributed fuzzy controllers
were implemented into a single-station
manufacturing cell, shown in Figure 1, to determine
the effects of varied inspection on MLT. From Figure
1, raw material arrived in buffer B
I,1
with an arrival
rate of 1 piece per time-unit (note the time-unit may
represent seconds, minutes, hours, days etc. as long
as consistency was kept). Buffers have a maximum
capacity of 10 storage spaces. Machine M
1
was
modelled to produce at capacity with a machining
time of 2 time-units per part. Inspection I
1
, if
performed, was 5 time-units. The “Poisson” random
distribution was used to simulate the quality of the
incoming parts, with a threshold range of 10% to
determine the parts that were conforming and non-
conforming. Nonconforming parts were removed
from the part stream. The distributed fuzzy controller
(that was tuned by the supervisory fuzzy controller)
used the prescribed inputs to calculate the inspection
intensity that was averaged out for IID realisation.
SimEvents
®
in Simulink
®
was used for discrete-event
simulation and the Fuzzy Logic Toolbox
®
was used
to design and tune the FLCs.
5 RESULTS AND DISCUSSION
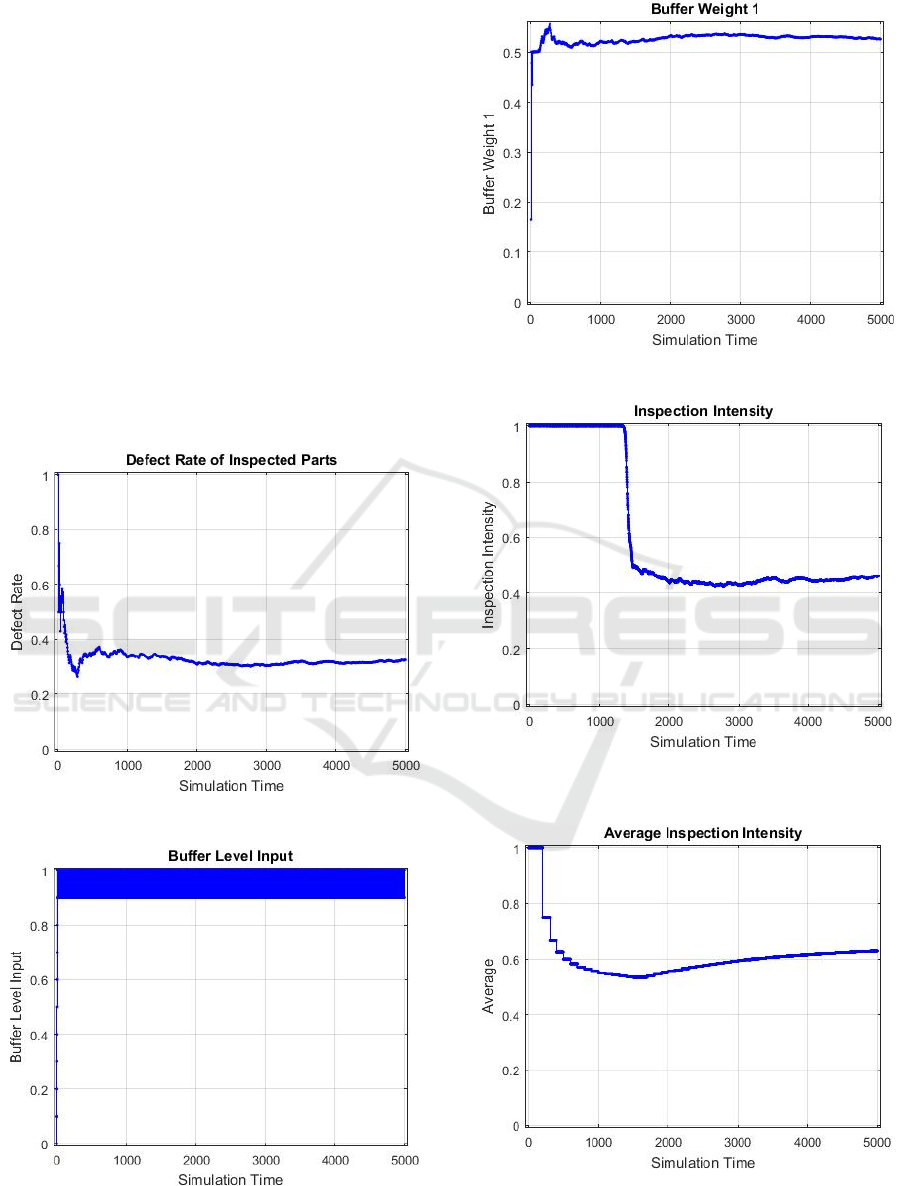
Important parameters from the simulation were
recorded to determine the effects of the two-level
fuzzy controllers on MLT. Figure 6 and Figure 7
show the DR input and buffer level input respectively.
The buffer level input was scaled to a maximum of 1.
Figure 8 shows the buffer weight that was determined
by the supervisory fuzzy controller (based on the DR
input shown in Figure 6) for use in the distributed
fuzzy controller. It was noted the buffer weight had
an average of 0.53, indicating that MLT reduction -
by lowering the buffer levels - was less important than
the actual part stream quality. Figure 9 shows the real-
time inspection intensity. The intensity started at 1
(100%) due to the batch size input membership
function shown in Figure 3. By performing 100%
inspection at the beginning of the cycle, the best form
of the DR can be obtained. After 1400 time-units, the
intensity significantly reduced to ensure parts spend
less time in production by reducing the amount of
inspected parts. Figure 10 shows the averaged
inspection intensity, where 100 parts were used as a
sample size. A size of 100 was chosen intuitively as a
large sample size would incur large discrepancies
between the real-time and the averaged inspection
intensity, while a small sample size would not
accurately realise the inspection intensity as a mean.
Real-time inspection intensity could not be used as it
would be unrealisable with unacceptable errors. The
error between the averaged and real-time inspection
is shown in Figure 11. The error was calculated using
(4):
e_I = (Intensity-Mean Intensity)/(Mean
Intensity)
(4)
Where “Intensity” is the real-time inspection
intensity, the “Mean Intensity” was averaged over
100 parts and “e_I” was the intensity error. A positive
error indicated that less inspection was performed
than what was desired, while a negative error
Fuzzy Logic Control for Varied Inspection for Manufacturing Lead Time Reduction - A Fuzzy Control Implementation of a Dynamic
Inspection Technique to Reduce Manufacturing Lead Time
211
indicated that more inspection was perform than the
desired amount. The maximum error of 46% occurred
at 1375 time-units.
The amount of switching between “inspection”
and “no inspection” is shown in Figure 12. Although
not clear, the distributed fuzzy controller performs the
switching independently based on the average
inspection intensity shown in Figure 10. Where the
switch integer value (“p” value from (3)) was 1,
inspection was performed and no inspection was
performed when the integer value was 2.
Two simulations were performed to determine the
effects of the fuzzy controllers on MLT. Figure 13
shows the MLT when the controllers implemented
varied inspection. Figure 14 shows the average MLT
where 100% inspection was performed. By
comparison, varied inspection reduced MLT by 37
time-units over 1500 cycles, which represented a 35%
reduction in MLT.
Figure 6: Defect Rate Input of Inspected Parts.
Figure 7: Buffer Level Input.
Figure 8: Buffer Weight from Supervisory Controller.
Figure 9: Inspection Intensity (Percentage of Inspection
Performed on Incoming Parts).
Figure 10: Average Inspection Intensity Based on 100 Part
Batches.
ICINCO 2017 - 14th International Conference on Informatics in Control, Automation and Robotics
212
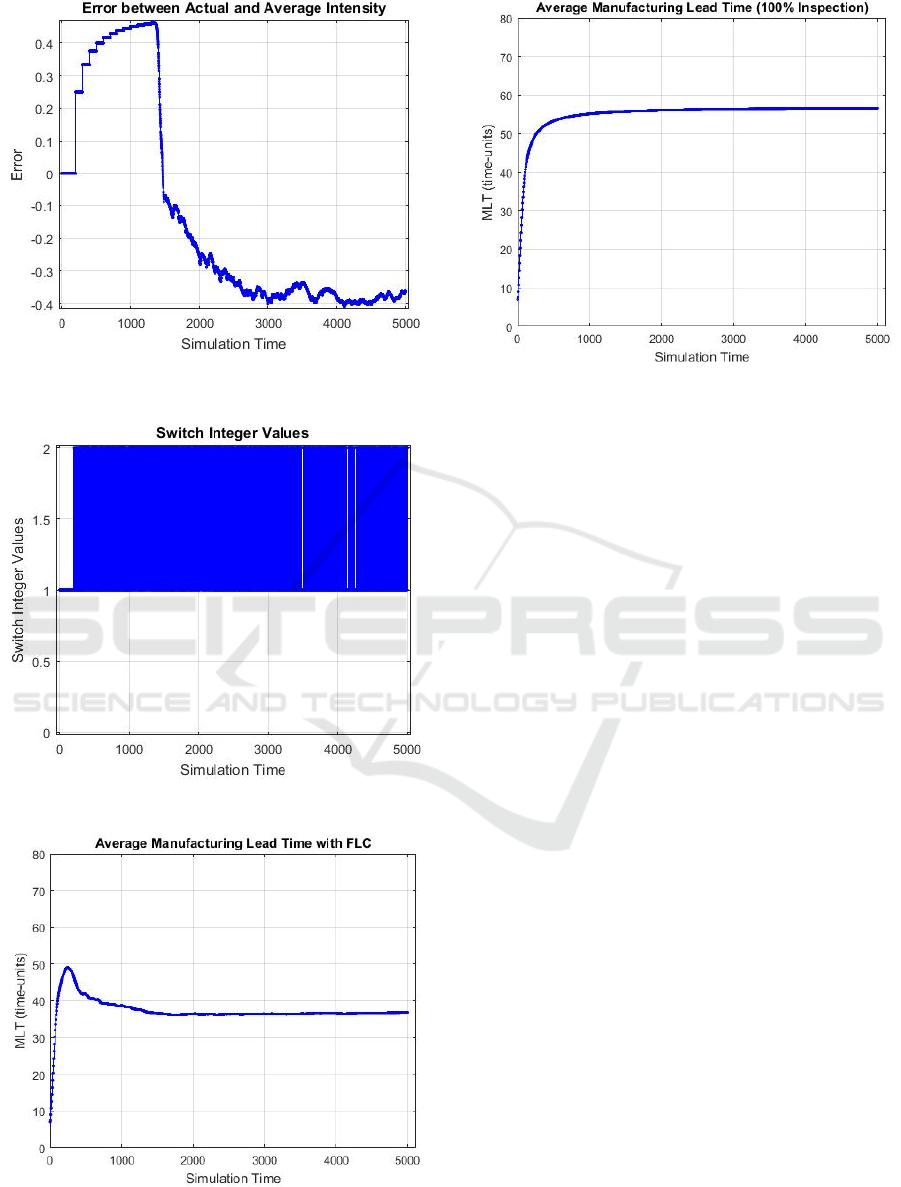
Figure 11: Error between Actual and Average Inspection
Intensity.
Figure 12: Switch Values (1 – Inspect; 2 – Do Not Inspect).
Figure 13: Average MLT with the Distributed and
Supervisory Fuzzy Controller.
Figure 14: Average MLT with 100% Inspection.
6 CONCLUSION AND FURTHER
RESEARCH
The results showed that varied inspection could be
used to reduce MLT and that a fuzzy solution could
facilitate the dynamic inspection method. The results
showed a 35% reduction in MLT. However,
Tsourveloudis (2000) outlined two major problems
with FL control for complex systems:
It is impractical to constantly monitor buffer
levels.
FLCs require a large amount of rules which adds
complexity to control.
Other limitations of this type of inspection was that
overall quality cannot be quantified, as parts were
allowed to pass through without inspection. Lastly,
there existed an error between the real-time
inspection intensity and the IID implementation,
shown in Figure 11, as the inspection was done in
sample batch sizes of 100 which resulted in a
maximum error of 46%. Real-time varied inspection
may result in larger errors as the inspection intensity
averages would not be executed accurately. Future
research will seek to reduce the errors and to
investigate the cost effectiveness of implementing
varied inspection. The FLC approach to varied
inspection will be extended for complex
manufacturing layouts. Lastly, a fuzzy solution will
be employed into the supervisory fuzzy controller to
address product-mix-prioritization.
Fuzzy Logic Control for Varied Inspection for Manufacturing Lead Time Reduction - A Fuzzy Control Implementation of a Dynamic
Inspection Technique to Reduce Manufacturing Lead Time
213

ACKNOWLEDGMENTS
The authors wish to thank the “Blue Sky Research
Grant” under the grant number 91339. The financial
assistance of the National Research Foundation
(NRF) towards this research is hereby acknowledged.
Opinions expressed and conclusions arrived at, are
those of the authors and are not necessarily to be
attributed to the NRF.
REFERENCES
Azadegan, A. et al., 2011. Fuzzy logic in manufacturing: A
review of literature and a specialized application.
International Journal of Production Economics,
132(2), pp.258–270.
Brabazon, P.G. & MacCarthy, B., 2007. Consideration of
the relevance of standard quality techniques in mass
customisation. International Journal of Mass
Customisation, 2(1/2), pp.76–94.
Davrajh, S. & Bright, G., 2010. An automated apparatus for
dynamic inspection of mass-produced custom parts.
Assembly Automation, 30(1), pp.47–55.
Davrajh, S., Bright, G. & Stopforth, R., 2012. Modular
Research Equipment for On-line Inspection in
Advanced Manufacturing Systems. The South African
Journal of Industrial Engineering, 23(May), pp.136–
150.
Fogliatto, F.S., Da Silveira, G.J.C. & Borenstein, D., 2012.
The mass customization decade: An updated review of
the literature. International Journal of Production
Economics, 138(1), pp.14–25.
Gien, D., 1999. Towards a unified representation of quality
in manufacturing systems. International Journal of
Computer Integrated Manufacturing, 12(2), pp.141–
155.
Groover, M.P., 2014. Inspection Principles and Practices.
In Automation, Production Systems, and Computer-
Integrated Manufacturing. Edinburgh: Pearson
Education Limited, pp. 643–672.
Homayouni, S.M., Sai Hong, T. & Ismail, N., 2009.
Development of genetic fuzzy logic controllers for
complex production systems. Computers & Industrial
Engineering, 57(4), pp.1247–1257.
Ioannidis, S., Tsourveloudis, N. & Valavanis, K., 2004.
Fuzzy Supervisory Control of Manufacturing Systems.
IEEE Transactions on Robotics and Automation, 20(3),
pp.379–389.
Juran, J.M. & Godfrey, A.B., 1998. Juran’s Quality Control
Handbook 5th ed. R. E. Hoogstoel & E. G. Schilling,
eds., New York: McGraw-Hill, Inc.
Naidoo, T. et al., 2016. Fuzzy Logic Control for Varied
Inspection Applications in Advanced Manufacturing
Cells. in 2016 Pattern Recognition Association of South
Africa and Robotics and Mechatronics International
Conference (PRASA-RobMech). Stellenbosch: IEEE,
pp. 257–262.
Tsourveloudis, N., 2000. Fuzzy work-in-process inventory
control of unreliable manufacturing systems.
Information Sciences, 127(1–2), pp.69–83.
Tsourveloudis, N., Doitsidis, L. & Ioannidis, S., 2007.
Work-in-process scheduling by evolutionary tuned
fuzzy controllers. International Journal of Advanced
Manufacturing Technology, 34(7–8), pp.748–761.
ICINCO 2017 - 14th International Conference on Informatics in Control, Automation and Robotics
214
