Automatic Lesser Kestrel’s Gender Identification using Video Processing
Javier M. Mora-Merchan
1
, Enrique Personal
1
, Diego Francisco Larios
1
,
Francisco Javier Molina
1
, Juan Carlos Tejero
2
and Carlos Leon
1
1
Escuela Polit
´
ecnica Superior, University of Seville, Spain
2
Escuela T
´
ecnica Superior de Ingenier
´
ıa Inform
´
atica, University of Malaga, Spain
{
Keywords:
Video Processing, Pattern Recognition, Animal Surveillance, Gender Classification.
Abstract:
Traditionally, animal surveillance is a common task for biologists. However, this task is often accompanied
by the inspection of huge amounts of video. In this sense, this paper proposes an automatic video processing
algorithm to identify the gender of a kestrel species. It is based on optical flow and texture analysis. This
algorithm makes it possible to identify the important information and therefore, minimizing the analysis time
for biologists. Finally, to validate this algorithm, it has been tested against a set of videos, getting good
classification results.
1 INTRODUCTION
Nowadays, it is easy to find in the literature a lot
of work in which biologists follow new systems to
gather information from natural environments, e.g
(Larios et al., 2013a). In this sense, one of the main
research lines is focused on animal behavior, such
as: anurans (Luque et al., 2016), birds (Larios et al.,
2013b), etc. Specifically for birds, there exists sev-
eral studies focusing on distinguish between the dif-
ferent species (e.g. (Zottesso et al., 2016) which im-
plements a bird classification using imaging process-
ing over graphic representation of the audio spectro-
gram of their songs, or (Pang et al., 2014) that uses
computer vision techniques for bird specie discrimi-
nation based on the difference in features of the birds’
parts). However, in bird observation, it is typical to
watch their inner nest activity, it being useful to dis-
tinguish between male and females behavior inside of
it. Obviously, in order to make this distinction, it is
necessary that there exist some kind of distinguish-
able visual features between them.
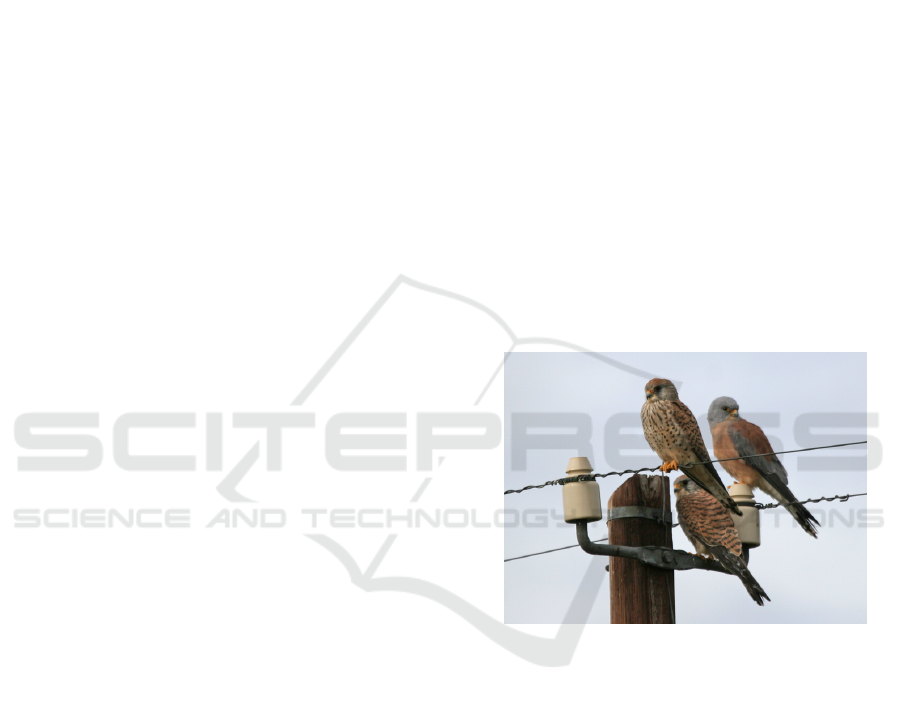
In the case of some birds, like the Lesser Kestrel
(Falco naumanni), this difference can be found in its
plumage (see Figure 1).
Specifically, as can be seen in Figure 1, the Lesser
Kestrel is a small falcon. The male has a bluish
gray head, uniform rusty back, but the breast and
belly have black spots. It has uniform rusty scapu-
lars, gray band on greater wings coverts and black
primary feathers. Additionally, its tail is gray with
Figure 1: Lesser Kestrels (Gray, 2016) (two females and a
male).
a black sub-terminal band. Conversely, female and
younger ones have a more uniform appearance (typi-
cal in other common falcon), rusty with black barring
and streaking, and being paler underneath.
These characteristics are typically exploited by bi-
ologists to distinguish visually between males and fe-
males of this falcon species more easily. However,
breeding behavior study does not refer to an isolated
identification. It requires a continuous video observa-
tion of the inner nest activity for each individual (dis-
tinguishing by gender). Obviously, it is a tedious task,
especially for huge amount of videos, in which it is
necessary to discard great amount of useless informa-
tion, with hours of bird inactivity or directly with the
empty nest. Additionally, this problem is accentuated
for a colony, where this study must be repeated for
several nests. Therefore, an automation of this video
58
Mora-Merchan, J., Personal, E., Larios, D., Molina, F., Tejero, J. and Leon, C.
Automatic Lesser Kestrel’s Gender Identification using Video Processing.
DOI: 10.5220/0006397000580063
In Proceedings of the 14th International Joint Conference on e-Business and Telecommunications (ICETE 2017) - Volume 5: SIGMAP, pages 58-63
ISBN: 978-989-758-260-8
Copyright © 2017 by SCITEPRESS – Science and Technology Publications, Lda. All rights reserved

analysis is a great help for biologists allowing them to
save time.
In this sense, computer vision is proposed as an
excellent solution for this task. Proof of this fact is
the algorithm proposed in this paper, which is able
to identify the gender of cited bird specie through
a background identification algorithm and a texture
classification.
Specifically, this paper is organized as follows:
Section 2 describes the proposed algorithm to Kestrel
gender identification. A video analysis and its re-
sults are shown in Section 3 as a case study. Finally,
Section 4 sums up the conclusions, final remarks and
presents future work.
2 PROPOSED SOLUTION
As has been mentioned previously, there are two vi-
sual characteristics that allow experts to classify be-
tween male and female kestrels:
• Color Analysis: Male individuals show gray and
reddish brown tones not present in the female in-
dividuals. In this sense, a hue histogram study
would make gender identification possible.
• Texture Roughness Analysis: Male individuals
have a plumage of plain colors while the females
have one with black barring and streaking. It is
translated into a more rough texture, or what is
the same, with high frequency components.
The first of these options, in spite of being simpler,
would require color images. However, color video
sensors generally require a good illumination to work
adequately. Unfortunately, the illumination in the nest
is very limited and forces the use of monochromatic
sensors (see Figure 2). This choice makes color anal-
ysis not useful and leads to texture analysis as the
most suitable solution.
This is why we opted for texture analysis. Thus,
the images are taken frontally from an elevated po-
sition. Due to this, it is possible to assume that the
kestrels will be recorded with the wings folded, while
they are inside the nest.
(a) Male (b) Female
Figure 2: Inner nest Lesser Kestrel video captures.
Based on these constraints, the proposed iden-
tification system has been divided into four stages;
bird location, Kestrel’s back extraction, energy analy-
sis of different frequency bands and comparison with
models in each of which the following tasks are per-
formed:
2.1 Kestrel Location
In this first stage, the goal is to determine the bird po-
sition in each video frame. Assuming that each one is
composed by a static background (the nest) and mov-
ing elements (the kestrels), the proposed strategy ex-
tracts the background and to estimate the movement
centroid later.
In this sense, a basic background extraction al-
gorithm consists of comparing each frame with the
background (nest frame without any bird). Any dif-
ference between both would be considered as a move-
ment. However, this approach would be very sensitive
to changes at illumination (if a stable light source is
not available) or camera noise.
As an alternative to this problem, an adaptive
gaussian mixture model for background subtraction
(Zivkovic and van der Heijden, 2006), (Zivkovic,
2004) was applied. It establishes a statistical model
with the probability that each pixel of a frame is part
of the background. This fact makes it possible that
this model fits variation in lighting conditions (with
slow dynamics), not being affected by moving objects
(foreground, with faster dynamics).
Once all pixels with movement of the video frame
(mobile pixels) are obtained (as part of a bird), the
centroid calculation of them is the next step. It is cal-
culated through the general moment expression (de-
fined by equation 1), in which IMG is a binary image
of the object (movement points) to be analyzed.
m
ji
=
∑
x
∑
y
(IMG(x,y) ·x
j
·y
i
) (1)
Calculating first moment of area (m
10
and m
01
),
and assuming that m
00
is equal to the number of pix-
els associated with the movement, the centroid posi-
tion is defined by ¯x and ¯y coordinates, both calculated
according to:
¯x =
m
10
m
00
, ¯y =
m
01
m
00
(2)
An example of this centroid can be seen in Figure
3, where it is on a male kestrel.
To improve the robustness, an additional con-
straint has been added to this estimation to validate it.
Specifically, the number of mobile pixels (m
00
) must
be between two limits. On the one hand, the lower
limit (n
L
) make it possible to filter situations of low
Automatic Lesser Kestrel’s Gender Identification using Video Processing
59
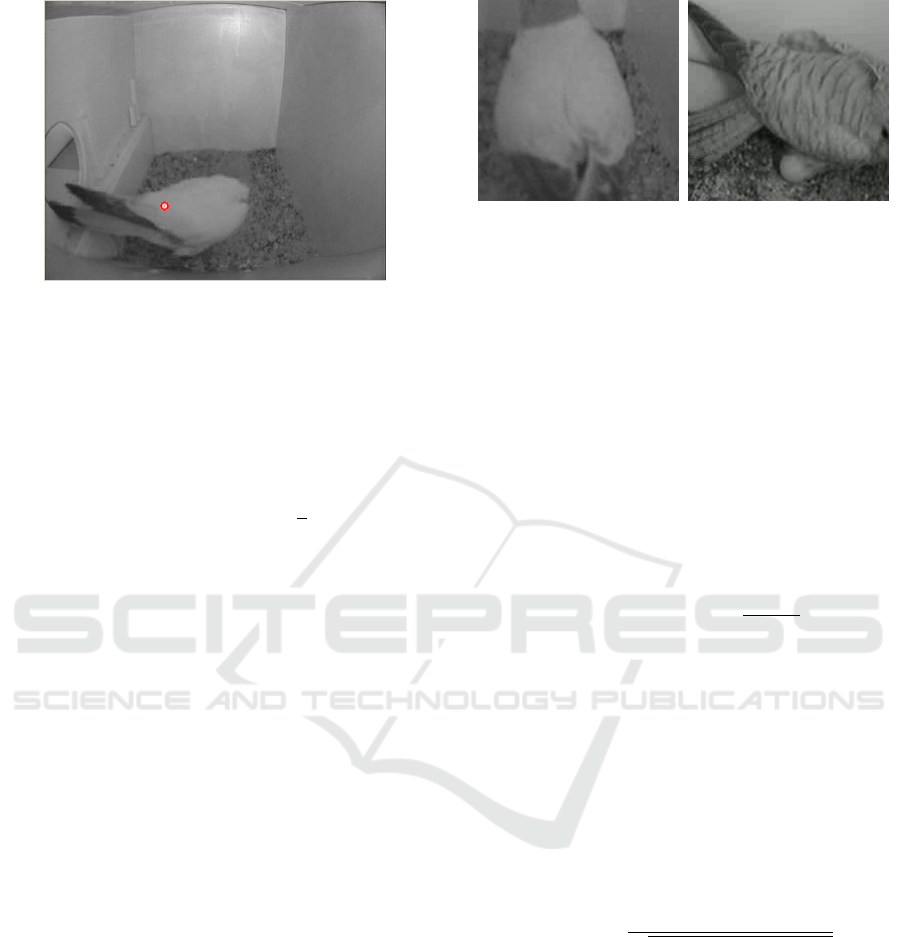
Figure 3: Centroid of a movement.
movement or variations due to the sensor noise. On
the other hand, the upper limit (n
H
) filters situations
in which the large part of a frame is motion (typical
in the camera iris adjustment phenomena, when the
luminance changes, or at the beginning of the analy-
sis process). These limits were set to 0.5% and 25%
of frame pixels respectively, using a 3σ approxima-
tion, which is based on a statistical study of mobile
pixels over the valid image set (with n = 12.53% and
σ = 4.02%). Out of these limits, the frame is dis-
carded because it is considered unreliable.
2.2 Kestrel’s Back Extraction
Once the kestrel position has been identified, the next
step is to search a part of them in which there exist
a clear difference between male and female texture.
In this sense, based on the previous described Lesser
Kestrel appearance, and assuming that the video is
captured from an elevated position, the upper parts
(mainly neck and back) are a good representation for
this purpose (see Figures 1 and 2).
Thus, an alternative had been to apply an algo-
rithm that accurately determined the kestrel shape
around the calculated centroid (and even the existence
of any bird around it). Instead, it has been empiri-
cally demonstrated that for this application, a square
of 200 pixels centered on the centroid (2/7 of a frame
approximately) captures the desired information ac-
curately. It is possible mainly because of the depth of
the nests is small and so that, the diminution in the
kestrels size by perspective effects can be neglected.
An example of this fact is can be seen in Figure 4,
where representative parts of both genders have been
correctly captured by the camera.
Obviously, this clipping technique may capture
fragments of the nest wall and floor. However, as
will be seen later, this fact does not significantly af-
fect to the classification results. Additionally, in this
sense, some models of images without any kestrel will
(a) Male (b) Female
Figure 4: Lesser Kestrel’s back clip.
been included in the next classification stage. This
fact makes it possible to strengthen this classification,
discarding those regions in which there is suspicion
of a bad detection.
2.3 Energy Analysis of Different
Frequency Bands
The Two-Dimensional Fourier Transform of an image
(FT ) is an excellent tool to evaluate the importance
of repetitive patterns in it. Focus on the module infor-
mation (
FT
(u,v)
), each point of this transformation
(defined by u,v) informs about three different aspects
of these patterns:
• The distance to the origin (
√
u
2
+ v
2
) depicts the
spacial frequency value (higher distance implies
higher frequency).
• The direction to the origin (arctan(v/u)) indi-
cates the orientation of the pattern.
• The FT value itself (
FT
(u,v)
) indicates pattern
relevance in the original image.
Specifically, this work uses the Normalized
Fourier Transform (NFT, see equation 3), which has
the advantage of being invariant with linear changes
in illumination (Nixon and Aguado, 2012).
NFT
(u,v)
=
FT
(u,v)
q
∑
|FT
(u,v)
|
2
−|FT
(0,0)
|
2
(3)
However, it must be taken into account that seek-
ing patterns are not strictly regular, the barred females
not always being at the same distance. Additionally,
the direction of these is not constant and depends di-
rectly on the individual and its orientation.
Therefore, to minimize these problems, the pro-
posed system considers adjacent frequency bands (or
spectrum representation areas) instead of singular
points in it. Furthermore, to make this analysis in-
variant against direction changes, an axial symmetry
from the origin has been applied. It defines concen-
tric annulus centered on the origin as representative
SIGMAP 2017 - 14th International Conference on Signal Processing and Multimedia Applications
60
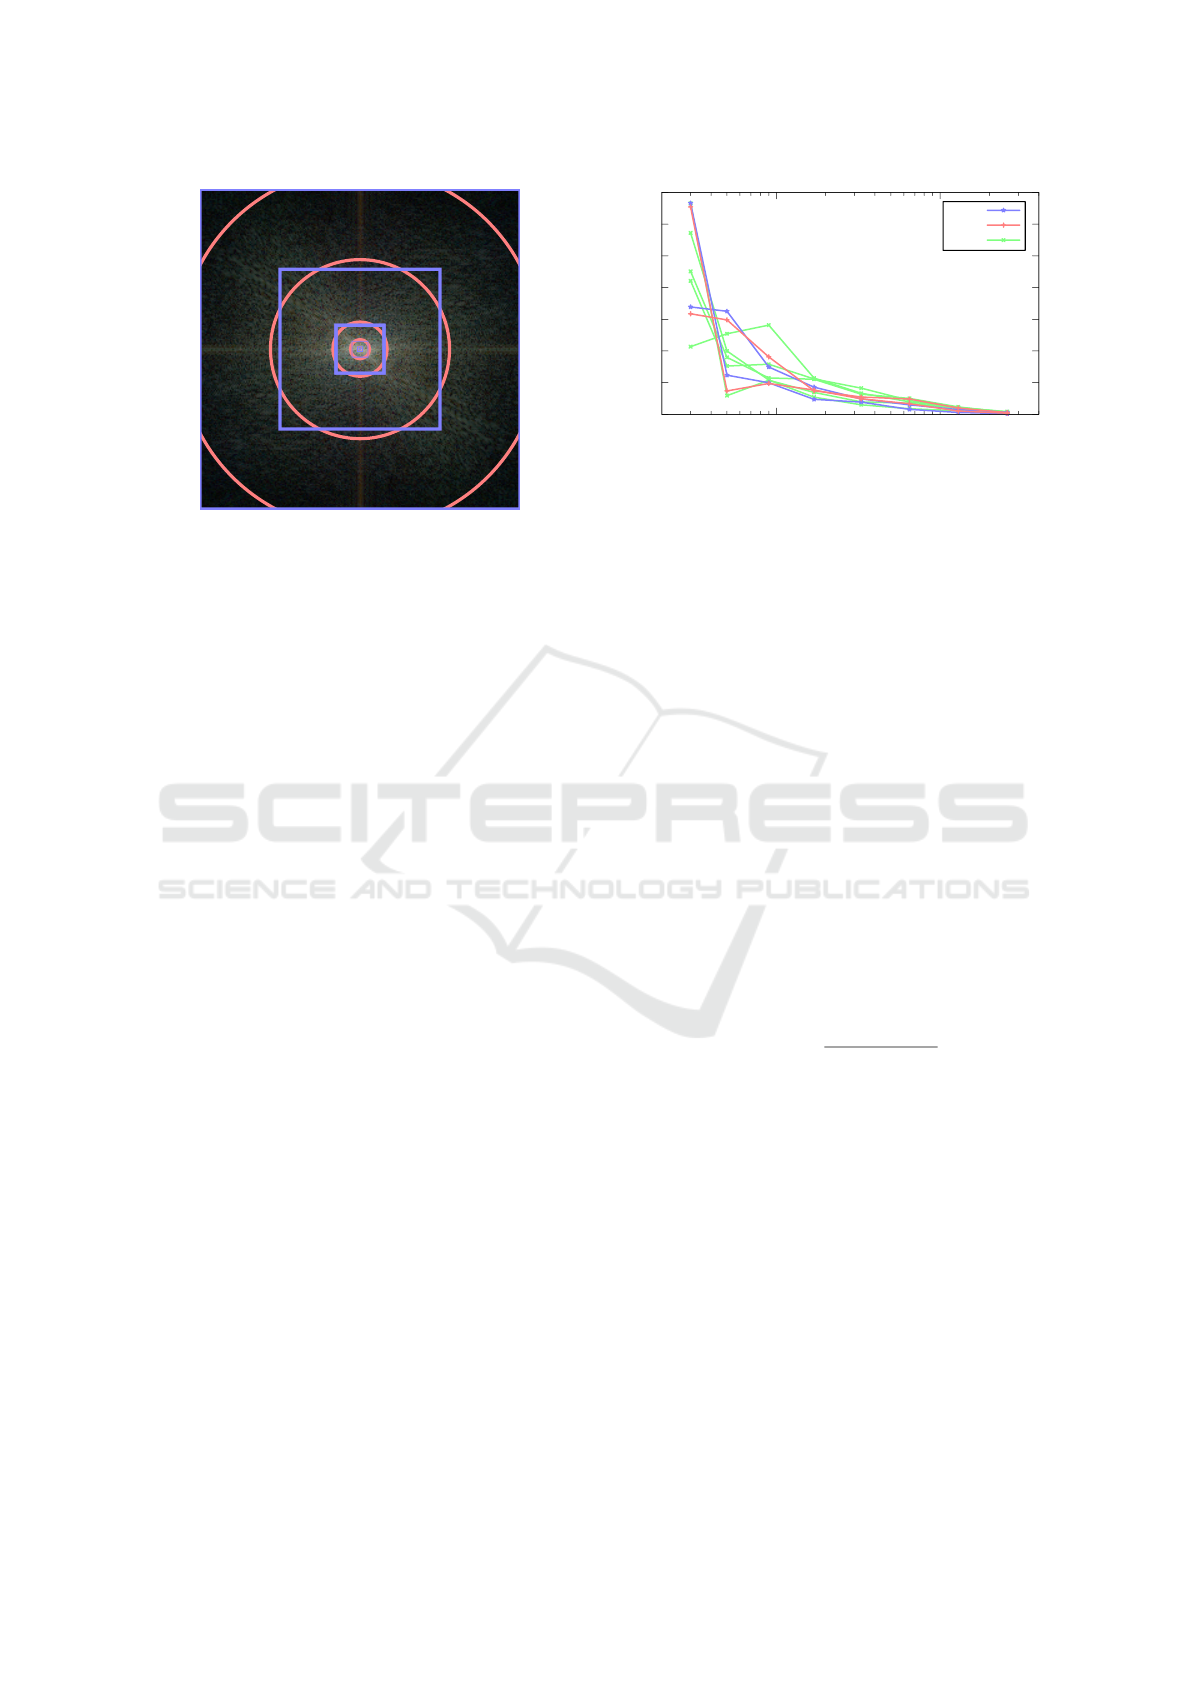
Figure 5: Spectrum representation and frequency bands;
ideal (red) and real (blue).
regions for each frequency band (delimited areas by
red circles in Figure 5), regardless of their orientation.
In this sense, the energy of a band (e, defined by
equation 4) is an excellent descriptor to determine the
importance (or how much presence does it have) of
each frequency band.
e =
∑
∀(u,v)∈band
NFT
(u,v)
2
(4)
In order to increase the system discrimination ca-
pacity, instead of focusing on the specific frequency
band of relevant information (seek patterns), the anal-
ysis of multiple bands has been preferred. A profile of
energy bands provides more information than a single
value.
Additionally, the high correlation in gray values
leads to higher energy values in low frequency bands
(Theodoridis and Koutroumbas, 2008). Due to this,
an exponential increase in the frequency band widths
(or radius of red circles) has been chosen, in order
to keep the energies in a similar order between them.
Specifically, each decade has been divided into. Ad-
ditionally, NFT
(0,0)
value has also been excluded, be-
cause this point represents the average gray value,
which is irrelevant in the purposed texture analysis.
As a last consideration, efficiency considerations sug-
gest the substitution of circular bands limits (in red in
Figure 5) by concentric squares with the same area (in
blue in Figure 5). This change simplifies the compu-
tational cost of energy band calculation. Obviously,
the modification results in directional distortion. The
energy partially is now partially sensitive to texture
orientation. However, that for the proposed applica-
tion this distortion is not significant. Nevertheless, the
better computational efficiency compensate this draw-
back.
Figure 6 shows an example of several energy pro-
files. As has been commented throughout this section,
Energy
0.7
0.6
0.5
0.4
0.3
0.2
0.1
0
10
100
Band diameter/pixels
Empty
Male
Female
Figure 6: Examples of energy profiles for classes.
the result of this stage is an energy profile per frame,
which will be used in the next classification state to
distinguish the kestrel gender.
2.4 Classification
This final stage analyzes the energy profile of each
frame and retrieves an estimation of the kestrel gen-
der. In this sense, a k-Nearest Neighbors (k-NN) al-
gorithm (Cover and Hart, 1967) implements this esti-
mation. This method consists in comparing each en-
ergy profile under study with a set of reference pro-
files (or models) related to the different target classes.
This classifier is a lazy supervised learning with an
easy and efficient implementation. It can re-use erro-
neously classified data to improve the model perfor-
mance.
For this algorithm, it is necessary to define a met-
ric, which characterizes the likeness to each pattern
profile. Based on energy distribution in profiles (see
Figure 6), χ
2
(defined by Equation 5) is proposed as a
metric. It represents the weighted euclidean distance
with each pattern (m).
χ
2
m
=
∑
i=bands
(e
test,i
−e
m,i
)
2
e
m,i
(5)
where i represents each frequency bands. It is im-
portant to consider that this classifier offers an esti-
mation per video frame where a movement has been
detected. Therefore, to analyze a full video it is nec-
essary to obtain a final estimation from the whole ana-
lyzed frames. This global classification uses a simple
estimator, choosing the final result as the most fre-
quent estimation of the frame analysis set. Notwith-
standing, only a video is cataloged as a valid class,
if the difference between the majority class and the
rest of classes appearances is less than 50% of the
total frames. Otherwise, the video is cataloged as
“undetermined”. This simple analysis increases the
robustness of the classification, because it can work
correctly, even if some video frames are not clear and
offer an incorrect classification.
Automatic Lesser Kestrel’s Gender Identification using Video Processing
61

3 STUDY CASE
As has been previously mentioned, the goal of this
work is to facilitate the tedious tasks of viewing large
sets of video. This help can be translated directly into
two actions; automatic identification of useful videos
(non-empty nest detection) and automatic determina-
tion of the adult bird gender.
For the test, a sample of 150 videos from the
HORUS (Do
˜
nana Biological Station, 2009) project
(recorded in monochrome, with a resolution of
704x576 px) was chosen. In this sense, following the
two goals mentioned above, this study was divided
into two parts:
3.1 Identification of Useful Videos
Table 1 shows the comparison of all cases whether the
nest was empty or not, with the estimation made by
proposed algorithm (localization of the kestrel, sec-
tion 2.1).
The first information obtained from this analysis is
the high percentage of empty nests (88%). This fact
indicates that the automatic recording system does not
work properly. These false detections are mainly due
to the high noise presence in conditions of low lumi-
nosity.
In order to verify the quality of this estimation,
the Yates’ χ
2
test (Yates, 1934) (a correction in χ
2
of Pearson for cases with a low occurrence) has been
applied.
χ
2
= 82.3 ; d f = 1 ; P < 0.001
These values indicate that the probability of ob-
tained result was due to chance is less than 0.1%. Fur-
thermore, the λ index of Goodman-Kruskal (Good-
man and Kruskal, 1979) has been also calculated.
λ = 0.6 ; (σ = 0.1633)
This λ value indicates an improvement of 60%
when this classifier is applied (instead of not apply-
ing any). Based on these studies, it is possible to say
that the estimated probability of a correct prediction is
96%. Therefore, the theory that this analysis is suit-
able for this application was validated.
Table 1: Useful videos identification analysis.
Estimated
Empty nest Kept nest
Real
Empty nest 132 3
Kept nest 3 12
3.2 Identification of Kestrel Gender
From the last study, it is easy to note that there are
only 15 videos of kept nests in complete video set
(150 samples). Due to this, only the kestrel gender
algorithm evaluation have been used, minimizing the
effects of high percentage of empty nest images, in
front of the reduced number of cases in which the dis-
crimination between male and female is done.
Thus, this small amount of elements for this anal-
ysis makes the showed results should be considered
with a high error margin.. Table 2 shows the compari-
son between real and estimated result by the proposed
kestrel gender identification algorithm (see sections
2.1–2.4). In this case, the classifier may determine
that the kestrel’s gender may be male, female, or un-
determined.
The evaluation techniques have been the same as
the previous section.
χ
2
= 8.58 ; d f = 2 ; P = 0.0137
Specifically, this first analysis indicate that the
probability of obtained result was due to chance is less
than 1.5%.
λ = 0.6 ; (σ = 0.2722)
For this study, λ value indicates an improvement
of 66.6% when this classifier is applied, and the es-
timated probability of a correct prediction is 86.6%.
Therefore, the theory that this analysis is suitable for
this application was validated.
As in the previous section, both tests show that the
proposed algorithm is suitable for this application.
3.3 Time Execution Analysis
As discussed previously, one of the main advantages
of this application is to release the biologists from
monotone and tedious observation. However, this is
not the only advantage, its execution speed being an-
other one.
Specifically, from Tables 3, it is easy to note that
the systems have an analysis rate of 0.074 (less than
Table 2: Gender identification analysis.
Estimated
Male Undetermined Female
Real
Male 4 1 1
Female 0 2 7
Table 3: Processing time analysis.
Total time of videos 1800 sec.
Average processing time
∗
133 sec.
∗
Using single core of a Intel
R
Core
TM
i5-5200
SIGMAP 2017 - 14th International Conference on Signal Processing and Multimedia Applications
62
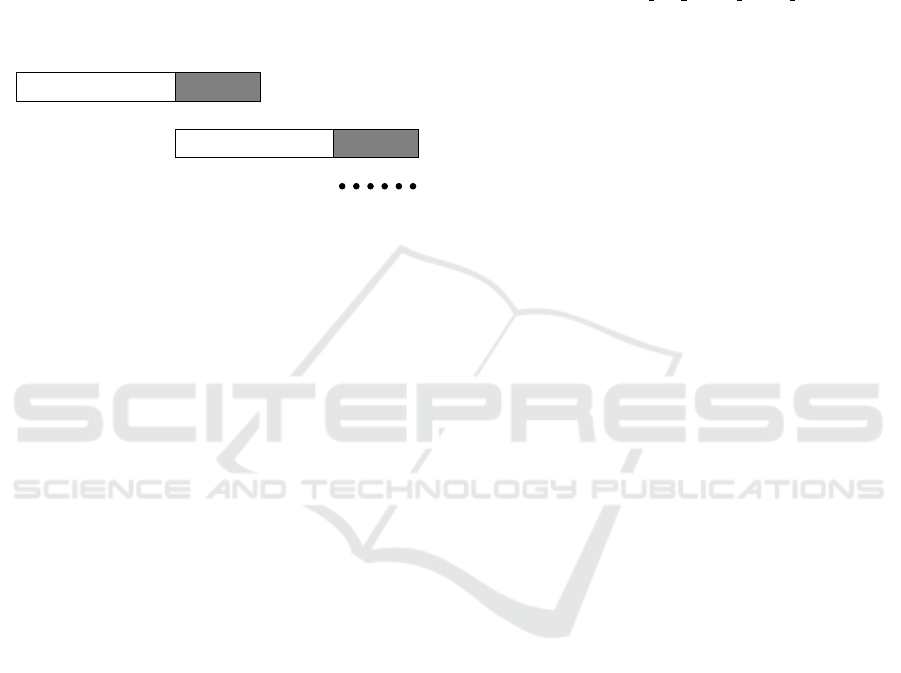
1). While it can not explicitly guarantee real-time
work. This makes it possible to organize a pipeline
structure (see Figure 7), which can acquire the video
and estimate it associated information (nest occupa-
tion and bird gender) in the same act.
In addition, this task segmentation is also easily
scalable, so that the nest analysis can be performed at
the same time, accelerating the analysis process even
further. This fact improves the work quality of the
biologist, who usually had to watch all the videos one
by one.
Record
h
vid1
i
Proc.
h
vid1
i
Record
h
vid2
i
Proc.
h
vid2
i
Figure 7: Pipeline structure for video processing.
4 CONCLUSIONS
As previously discussed, any tool that allows the biol-
ogist to reduce or facilitate monotonous observation
tasks is useful in environmental monitoring. In this
paper, video processing algorithm has been proposed
for kestrel gender identification in a breeding envi-
ronment (the nest). This algorithm has been tested
over a video sample set, validating its correct opera-
tion for this application. In this sense, improvements
in the ease and time analysis are directly obtained
by biologists, allowing them to register bird activi-
ties automatically, without the need to inspect them
directly. Thus, other improvements in storage needs
can also be significant, being able to eliminate non-
useful recordings (empty nest), typically abundant in
this applications.
ACKNOWLEDGEMENTS
This work has been supported by the Consejer
´
ıa de
Innovaci
´
on, Ciencia y Empresa, Junta de Andaluc
´
ıa,
Spain, through the excellence project eSAPIENS (ref-
erence number P10-TIC-5705). The authors would
like to thank Javier Bustamente from Do
˜
nana Biolog-
ical Station (CSIC) for his collaboration and support.
REFERENCES
Cover, T. and Hart, P. (1967). Nearest neighbor pattern clas-
sification. IEEE Transactions on Information Theory,
13(1):21–27.
Do
˜
nana Biological Station (2009). HORUS project.
http://horus.ebd.csic.es/wphorus/ [last visited
2017.01].
Goodman, L. A. and Kruskal, W. H. (1979). Measures of
Association for Cross Classifications. Springer New
York.
Gray, N. (2016). Male and female lesser kestrels.jpg.
Wikimedia Commons, https://commons.wikimedia.
org/wiki/File:Male and female Lesser Kestrels.jpg
[last visited 2017.01].
Larios, D. F., Barbancho, J., Sevillano, J., Rodr
´
ıguez, G.,
Molina, F., Gasull, V., Mora-Merchan, J., and Le
´
on,
C. (2013a). Five years of designing wireless sensor
networks in the do
˜
nana biological reserve (spain): An
applications approach. Sensors, 13(9):12044–12069.
Larios, D. F., Rodr
´
ıguez, C., Barbancho, J., Baena, M.,
´
Angel, M., Mar
´
ın, J., Le
´
on, C., and Bustamante, J.
(2013b). An automatic weighting system for wild an-
imals based in an artificial neural network: How to
weigh wild animals without causing stress. Sensors,
13(3):2862–2883.
Luque, J., Larios, D. F., Personal, E., Barbancho, J., and
Le
´
on, C. (2016). Evaluation of MPEG-7-based audio
descriptors for animal voice recognition over wireless
acoustic sensor networks. Sensors, 16(5):717.
Nixon, M. and Aguado, A. S. (2012). Feature Extraction
& Image Processing for Computer Vision. Elsevier
Science Publishing Co Inc.
Pang, C., Yao, H., and Sun, X. (2014). Discriminative fea-
tures for bird species classification. In Proceedings
of International Conference on Internet Multimedia
Computing and Service - ICIMCS14. ACM Press.
Theodoridis, S. and Koutroumbas, K. (2008). Pattern
Recognition. Elsevier LTD, Oxford.
Yates, F. (1934). Contingency tables involving small num-
bers and the χ
2
test. Supplement to the Journal of the
Royal Statistical Society, 1(2):217.
Zivkovic, Z. (2004). Improved adaptive gaussian mixture
model for background subtraction. In Proceedings of
the 17th International Conference on Pattern Recog-
nition, 2004. ICPR 2004. Institute of Electrical and
Electronics Engineers (IEEE).
Zivkovic, Z. and van der Heijden, F. (2006). Efficient adap-
tive density estimation per image pixel for the task of
background subtraction. Pattern Recognition Letters,
27(7):773–780.
Zottesso, R. H. D., Matsushita, G. H. G., Lucio, D. R., and
Costa, Y. M. G. (2016). Automatic segmentation of
audio signal in bird species identification. In 2016
35th International Conference of the Chilean Com-
puter Science Society (SCCC). IEEE.
Automatic Lesser Kestrel’s Gender Identification using Video Processing
63
