
Towards Modeling the User-perceived Quality of Source Code
using Static Analysis Metrics
Valasia Dimaridou, Alexandros-Charalampos Kyprianidis, Michail Papamichail,
Themistoklis Diamantopoulos and Andreas Symeonidis
Electrical and Computer Engineering Dept., Aristotle University of Thessaloniki, Intelligent Systems & Software
Engineering Labgroup, Information Processing Laboratory, Thessaloniki, Greece
Keywords: Code Quality, Static Analysis Metrics, User-perceived Quality, Principal Feature Analysis.
Abstract: Nowadays, software has to be designed and developed as fast as possible, while maintaining quality
standards. In this context, developers tend to adopt a component-based software engineering approach,
reusing own implementations and/or resorting to third-party source code. This practice is in principle cost-
effective, however it may lead to low quality software products. Thus, measuring the quality of software
components is of vital importance. Several approaches that use code metrics rely on the aid of experts for
defining target quality scores and deriving metric thresholds, leading to results that are highly context-
dependent and subjective. In this work, we build a mechanism that employs static analysis metrics extracted
from GitHub projects and defines a target quality score based on repositories’ stars and forks, which
indicate their adoption/acceptance by the developers’ community. Upon removing outliers with a one-class
classifier, we employ Principal Feature Analysis and examine the semantics among metrics to provide an
analysis on five axes for a source code component: complexity, coupling, size, degree of inheritance, and
quality of documentation. Neural networks are used to estimate the final quality score given metrics from all
of these axes. Preliminary evaluation indicates that our approach can effectively estimate software quality.
1 INTRODUCTION
The continuously increasing need for software
applications in practically every domain, and the
introduction of online open-source repositories have
led to the establishment of an agile, component-
based software engineering paradigm. The need for
reusing existing (own or third-party) source code,
either in the form of software libraries or simply by
applying copy-paste-integrate practices has become
more eminent than ever, since it can greatly reduce
the time (and, thus, cost) of software development
(Schmidt, 2015).
In this context of fast development times and
increased source code reuse, developers often need
to spend considerable time and effort to integrate all
components and ensure software performance. And
still, this may lead to failures, since the reused code
may not satisfy basic functional or non-functional
system requirements. Thus, early assessment of the
quality of reusable components is important and
poses a major challenge for the research community.
An important aspect of this challenge is the fact
that quality is highly context-dependent and may
mean different things to different people
(Kitchenham and Pfleeger, 1996). Hence, a
standardized approach for measuring software
quality has been proposed in the latest ISO/IEC
25010:2011 (2011) which defines a quality model
that comprises eight quality characteristics:
Functional Suitability, Usability, Maintainability,
Portability, Reliability, Performance and Efficiency,
Security and Compatibility, out of which the first
four are usually assessed using static analysis tools
and often evaluated by developers in an intuitive
manner. To accommodate easy reuse, developers
usually structure their source code (or assess third-
party source code) so that it is modular, exhibits
loose coupling and high cohesion, and provides
information hiding and separation of concerns
(Pfleeger and Atlee, 2009).
Current research efforts assess the quality of
software components using static analysis metrics
(Diamantopoulos et al., 2016; Taibi, 2014; Le Goues
and Weimer, 2012; Washizaki et al., 2007), such as
Dimaridou, V., Kyprianidis, A-C., Papamichail, M., Diamantopoulos, T. and Symeonidis, A.
Towards Modeling the User-perceived Quality of Source Code using Static Analysis Metrics.
DOI: 10.5220/0006420000730084
In Proceedings of the 12th International Conference on Software Technologies (ICSOFT 2017), pages 73-84
ISBN: 978-989-758-262-2
Copyright © 2017 by SCITEPRESS – Science and Technology Publications, Lda. All rights reserved
73

the known CK metrics (Chidamber and Kemerer,
1994). Although in certain cases these efforts can be
effective for the assessment of a quality
characteristic (e.g. [re]usability, maintainability or
security), they do not actually provide an
interpretable analysis to the developer, and thus do
not inform him/her about the source code properties
that need improvement. Moreover, the approaches
that are based on metric thresholds, whether they are
defined manually (Diamantopoulos et al., 2016; Le
Goues and Weimer, 2012; Washizaki et al., 2007) or
derived automatically using a model (Zhong et al.,
2004), are usually constrained by the lack of
objective ground truth values for software quality.
As a result, these approaches typically resort to
expert help, which may be subjective, case-specific
or even at times unavailable (Cai et al., 2001). An
interesting alternative to expert involvement is
proposed by Papamichail et al. (2016) that employ
user-perceived quality as a measure of the quality of
a software component.
In this work, we employ the concepts defined in
(Papamichail et al., 2016) in order to build a
mechanism that aspires to associate the extent to
which a software component is adopted (or
preferred) by developers with component source
code quality. We define a ground truth score for the
user-perceived quality of source code components
based on popularity-related information extracted
from their GitHub repos, in the form of stars and
forks. After that, we employ a one-class classifier
and build a model based on static analysis metrics
extracted from a set of popular GitHub projects. By
using Principal Feature Analysis and examining the
semantics among metrics, we provide the developer
with not only a quality score, but also with a
comprehensive analysis on five axes for the source
code of a component, including scores on its
complexity, coupling, size, degree of inheritance,
and the quality of its documentation. Finally, we
construct five Neural Networks models, one for each
of these code quality properties, and aggregate their
output to provide an overall quality scoring
mechanism for software components.
The rest of this paper is organized as follows.
Section 2 provides background information on static
analysis metrics and reviews current approaches on
quality estimation. Section 3 describes our
benchmark dataset and designs a scoring mechanism
for the quality of source code components. The
constructed models are shown in Section 4, while
Section 5 evaluates the performance of our system.
Finally, Section 6 concludes this paper and provides
valuable insight for further research.
2 RELATED WORK
According to Miguel et al. (2014), research on
software quality is as old as software development.
As software penetrates everyday life, assessing
quality has become a major challenge. This is
reflected in the various approaches proposed by
current literature that aspire to assess quality in a
quantified manner. Most of these approaches make
use of static analysis metrics in order to train quality
estimation models (Samoladas et al., 2008; Le
Goues and Weimer, 2012).
Estimating quality through static analysis metrics
is a non-trivial task, as it often requires determining
quality thresholds (Diamantopoulos et. al, 2016),
which is usually performed by experts who manually
examine the source code (Hegedus et al., 2013).
However, the manual examination of source code,
especially for large complex projects that change on
a regular basis, is not always feasible due to
constraints in time and resources. Moreover, expert
help may be subjective and highly context-specific.
Other approaches require multiple user-defined
parameters for constructing the quality evaluation
models (Cai. et. al., 2001), which are again highly
dependent on the scope of the source code and are
easily affected by subjective judgment. As a result, a
common practice involves deriving metric
thresholds by applying machine learning techniques
on a benchmark repository. Ferreira et al. (2012)
propose a methodology for the estimation of metric
thresholds by fitting the values of metrics into
probability distributions, while Alves et. al. (2010)
follow a weight-based approach to derive thresholds
by applying statistical analysis on the metrics values.
Other approaches involve deriving thresholds using
bootstrapping (Foucault et. al., 2014) and ROC
curve analysis (Shatnawi et. al., 2010). Still, these
approaches are subject to the type of projects
selected to comprise the benchmark repository.
An interesting approach that refrains from the
need to use certain metrics thresholds and proposes a
fully automated quality evaluation methodology is
that of Papamichail et al. (2016). The authors design
a system that reflects the extent to which a software
component is of high quality as perceived by
developers. The proposed system makes use of
crowdsourcing information (the popularity of
software projects) and a large set of static analysis
metrics, in order to provide a single quality score,
which is computed using two models: a one-class-
classifier used to identify high quality code and a
neural network that translates the values of the static
analysis metrics into quantified quality estimations.
ICSOFT 2017 - 12th International Conference on Software Technologies
74

Although the approaches discussed in this
section can be effective for certain cases, their
applicability in real-world scenarios is limited. The
use of predefined thresholds (Diamantopoulos et al.,
2016; Hegedus et al., 2013) results in the creation of
models unable to cover the versatility of today’s
software projects, and thus applies only to restricted
scenarios. On the other hand, systems that overcome
threshold issues by proposing automated quality
evaluation methodologies (Papamichail et al., 2016)
often involve preprocessing steps (such as feature
extraction) or regression models (e.g. neural
networks) that lead to a quality score which is not
interpretable. As a result, the developer is provided
with no specific information on the targeted changes
to apply in order to improve source code quality.
Extending previous work, we build a generic
source code quality estimation mechanism able to
provide a quality score at a class level, which
reflects the extent to which a given class is adopted
by developers. Our system refrains from expert-
based knowledge and employs a large set of static
analysis metrics and crowdsourcing information
from GitHub stars and forks in order to train five
quality estimation models, each one targeting a
different property of source code. The individual
scores are then combined to produce a final quality
score that is fully interpretable and provides
necessary information towards the axes that require
improvement. By further analyzing the correlation
and the semantics of the metrics for each axis, we
are able to identify similar behaviors and thus select
the ones that accumulate the most valuable
information, while at the same time describing the
characteristics of the source code under examination.
3 DEFINING QUALITY
In this section, we quantify quality as perceived by
developers using information from GitHub stars and
forks as ground truth. In addition, our analysis
describes how the different categories of source code
metrics are related to major quality characteristics as
defined in ISO/IEC 25010:2011 (2011).
3.1 Benchmark Dataset
Our dataset consists of a large set of static analysis
metrics calculated for 102 repositories, selected from
the 100 most starred and the 100 most forked
GitHub Java projects. The projects were sorted in
descending order of stars and subsequently forks,
and were selected to cover more than 100,000
classes. Certain statistics are shown in Table 1.
Table 1: Dataset Description.
Statistics Dataset
Total Number of Projects 102
Total Number of Packages 7,372
Total Number of Classes 100,233
Total Number of Methods 584,856
Total Lines of Code 7,985,385
We computed a large set of static analysis
metrics that cover the source code properties of
complexity, coupling, documentation, inheritance,
and size. Current literature (Kanellopoulos et. al.,
2010; Heitlager et al., 2007) indicates that these
properties are directly related to the characteristics
of Functional Suitability, Usability, Maintainability,
and Portability, as defined by ISO/IEC 25010:2011
(2011). Metrics were computed using SourceMeter
(2017) and are shown in Table 2. All metrics were
computed at class level, except for McCC that was
computed at method level and then averaged to
obtain a value for the class.
3.2 Quality Score Formulation
As already mentioned, we use GitHub stars and
forks as ground truth information towards
quantifying quality the way it is perceived by
developers. According to our initial hypothesis, the
number of stars can be used as a measure of the
popularity for a software project, while the number
of forks as a measure of its reusability. We make use
of this information in order to define our target
variable and consequently build a quality scoring
mechanism. Towards this direction, we define a
quality score for each class included in the dataset.
Given, however, that the number of stars and
forks refer to repository level, they are not
representative as is for defining a score that reflects
the quality of each class individually. Obviously,
equally splitting the quality score computed at the
repository level among all classes is not optimal, as
every class has different significance in terms of
functionality and thus must be rated as an
independent entity. Consequently, in an effort to
build a scoring mechanism that is as objective as
possible, we propose a methodology that involves
the values of static analysis metrics for modeling the
significance of each class in a repository.
The quality score for every class of the dataset is
defined using the following equations:
Towards Modeling the User-perceived Quality of Source Code using Static Analysis Metrics
75
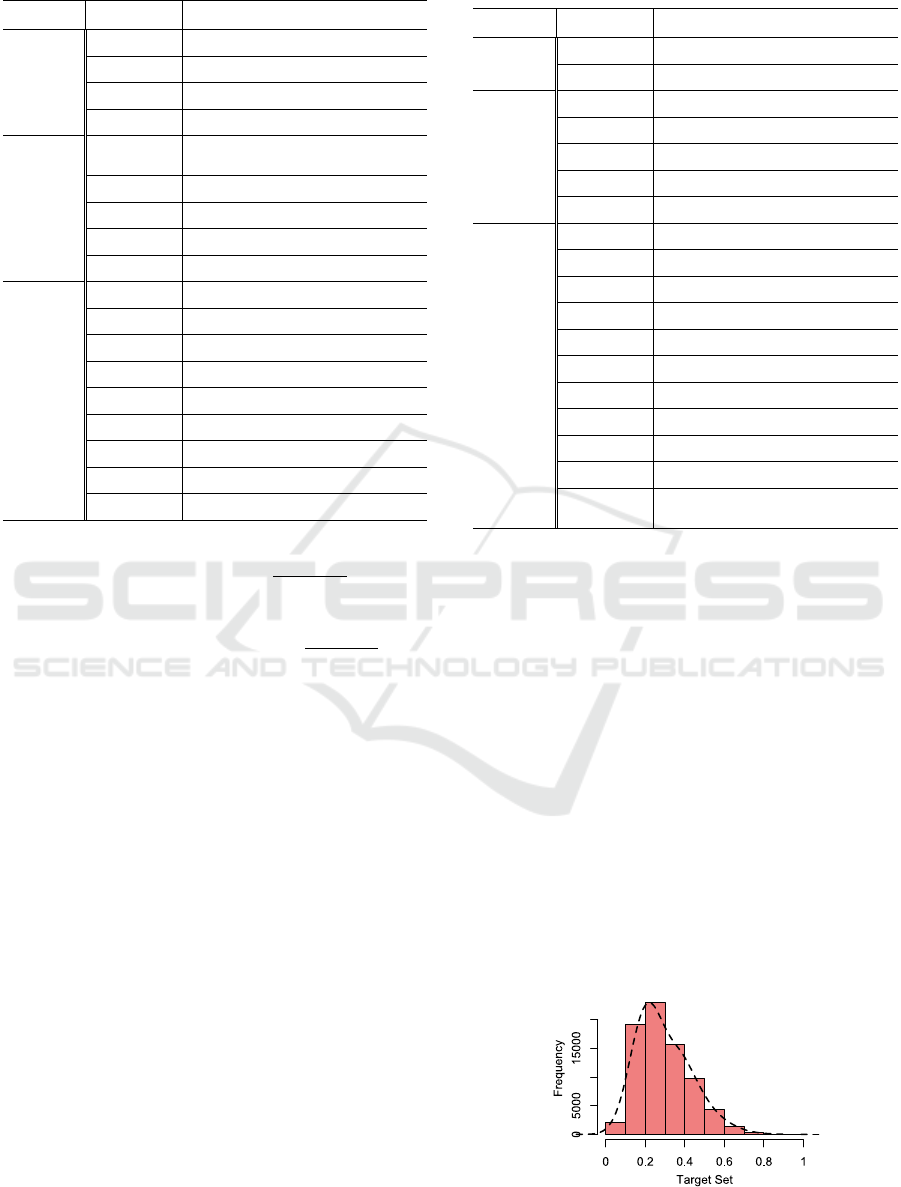
Table 2: Overview of the Computed Static Analysis Metrics.
Category Name Description
Complexity
McCC McCabe’s Cycl. Complexity
NL Nesting Level
NLE Nesting Level Else-If
WMC Weighted Methods per Class
Coupling
CBO
Coupling Between Object
classes
CBOI CBO classes Inverse
NII Number of Incoming Invocations
NOI Number of Outgoing Invocations
RFC Response set For Class
Size
LOC Lines of Code
LLOC Logical Lines of Code
TNA Total Number of Attributes
TNG Total Number of Getters
NOS Number of Statements
TLOC Total Lines of Code
TLLOC Total Logical Lines of Code
NPA Number of Public Attributes
NM Number of Methods
Category Name Description
Size
(
cont.)
NPM Number of Public Methods
NUMPAR Number of Public Attributes
Inheritance
DIT Depth of Inheritance Tree
NOA Number of Ancestors
NOC Number of Children
NOD Number of Descendants
NOP Number of Parents
Documentation
AD API Documentation
CD Comment Density
CLOC Comment Lines of Code
DLOC Documentation Lines of Code
PDA Public Documented API
PUA Public Undocumented API
TAD Total API Documentation
TCD Total Comment Density
TCLOC Total Comment Lines of Code
TPDA Total Public Documented API
TPUA
Total Public Undocumented
API
(
,
)
=1+
(
)
(
)
(
)
(1)
(
,
)
=1+
(
)
+
(
)
(
)
(
)
(2)
(
,
)
=log(
(
,
)
+
(, ))
(3)
where
(
,
)
and
(
,
)
represent the
quality scores for the -th class contained in the -th
repository based on the number of GitHub stars and
forks, respectively.
(
)
corresponds to the
number of classes contained in the -th repository,
(
)
to its number of GitHub stars and
(
)
to its number of GitHub forks. Finally,
(
,
)
is the final quality score computed for
the -th class contained in the -th repository.
Our target set also involves the use of the values
of three metrics as a measure of the significance for
every individual class contained in a repository.
Different significance implies different contribution
to the number of GitHub stars and forks of the
repository and thus different quality score.
(
)
is used to measure the degree to which the -th class
contributes to the stars of the repository as it reflects
the number of methods and thus the functionalities
exposed by the class to the outside world.
For the contribution of each class in the number
of forks of the repository, we use
(
)
, which
refers to the ratio of documented public methods out
of all the public methods of the -th class, and
(
)
, which refers to the number of methods of
the -th class therefore is used as a measure of its
functionalities. Those two metrics are closely related
with the reusability degree of the class and thus are
used as a contribution criterion to forks. It is worth
noting that the provided functionalities pose a
stronger criterion for determining the reusability
score of a class compared to the documentation
ratio, which contributes more as the number of
methods approaches to zero. Lastly, as seen in
equation (3), the logarithmic scale is applied as a
smoothing factor for the diversity in the number of
classes among different repositories. This smoothing
factor is crucial, since this diversity does not reflect
the true quality difference among the repositories.
Figure 1 illustrates the distribution of the quality
score (target set) for the benchmark dataset classes.
Figure 1: Distribution of the Quality Score.
ICSOFT 2017 - 12th International Conference on Software Technologies
76
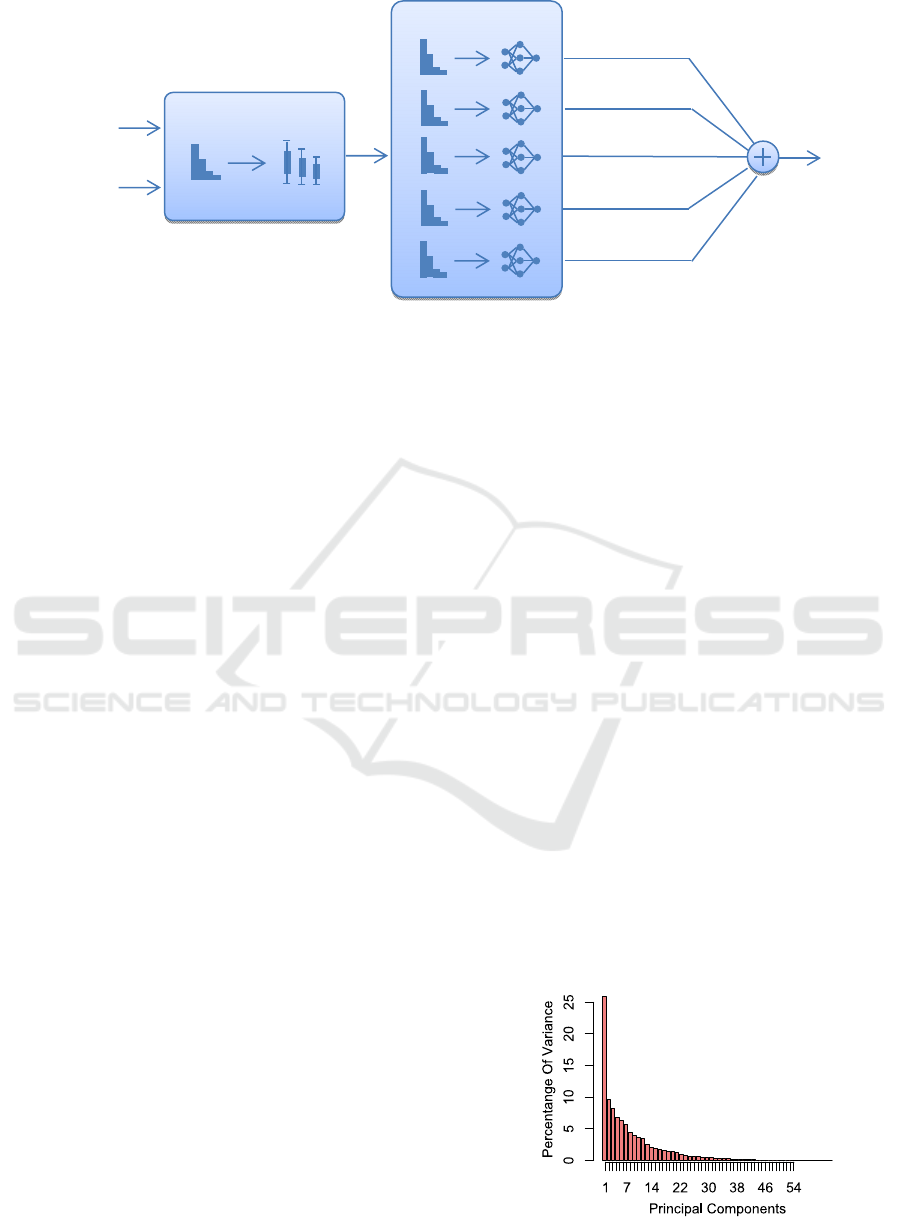
Figure 2: Overview of the Quality Estimation Methodology.
The majority of instances are accumulated in the
interval [0.1, 0.5] and their frequency is decreasing
as the score reaches 1. This is expected, since the
distributions of the ratings (stars or forks) provided
by developers typically exhibit few extreme values.
4 SYSTEM DESIGN
In this section we design our system for quality
estimation based on static analysis metrics. We split
the dataset of the previous section into two sets, one
for training and one for testing. The training set
includes 90 repositories with 91531 classes and the
test set includes 12 repositories with 8702 classes.
For the training, we used all available static analysis
metrics except for those used for constructing the
target variable. In specific, AD, NPM, NM, and
NCL were used only for the preprocessing stage and
then excluded from the models training to avoid
skewing the results. In addition, any classes with
missing metric values are removed (e.g. empty class
files); hence the updated training and test sets
contain 88180 and 7998 class files respectively.
4.1 System Overview
Our system is shown in Figure 2. The input is given
in the form of static analysis metrics, while the stars
and forks of the GitHub repositories are required
only for the training of the system. As a result, the
developer can make use of our methodology by
providing a set of classes (or a full project), and
receive a comprehensible quality analysis as output.
Our methodology involves three stages: the
preprocessing stage, the metrics selection, and the
model estimation. During preprocessing, the target
set is constructed using the analysis of Section 3,
and the dataset is cleaned of duplicates and outliers.
Metrics selection determines the metrics that will be
used for each metric category, and model estimation
involves training 5 models, one for each category.
The stages are analyzed in the following paragraphs.
4.2 Data Preprocessing
The preprocessing stage is used to eliminate
potential outliers from the dataset in order to make
sure that the models are trained as effectively as
possible. Thus, we developed a one-class classifier
using Support Vector Machines (SVM) and trained it
using metrics that were selected by means of
Principal Feature Analysis (PFA).
At first, the dataset is given as input in a PFA
model. The model performs Principal Component
Analysis (PCA) to extract the most informative
principal components (PCs) from 54 metrics. In
specific, we keep the first 12 principal components,
preserving 82.8% of the information. Figure 3
depicts the percentage of variance for each principal
component. We follow a methodology similar to that
of Lu et al. (2007) in order to select the features that
shall be kept. The transformation matrix generated
by the PCA includes values for the participation of
each metric in each principal component.
Figure 3: Principal Components Variance for Preprocessing.
Model Estimation
Preprocessing
Code
Metrics
GitHub
Stars & Forks
Quality
Score
Complexity
Size
Coupling
Documentation
Inheritance
Towards Modeling the User-perceived Quality of Source Code using Static Analysis Metrics
77
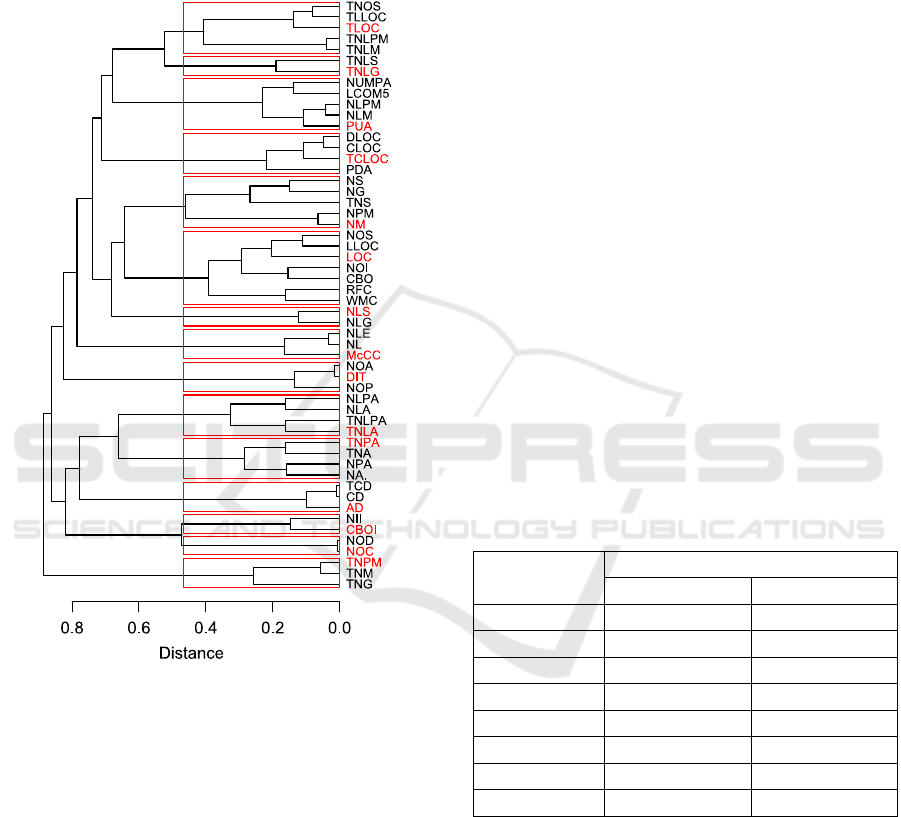
We first cluster this matrix using hierarchical
clustering and then select a metric from each cluster.
Given that different metrics may have similar trends
(e.g. McCabe Complexity with Lines of Code),
complete linkage was selected to avoid large
inhomogeneous clusters. The dendrogram of the
clustering is shown in Figure 4.
Figure 4: Dendrogram of Metrics Clustering.
The dendrogram reveals interesting associations
among the metrics. The clusters correspond to
categories of metrics which are largely similar, such
as the metrics of the local class attributes, which
include their number (NLA), the number of the
public ones (NLPA), and the respective totals
(TNLPA and TNLA) that refer to all classes in the
file. Our clustering reveals that keeping one of these
metrics results in minimum information loss. Thus,
in this case we keep only TNLA. The selection of
the kept metric from each cluster (in red in Figure 4)
was performed by manual examination to end up
with a metrics set that conforms to the current state-
of-the-practice. An alternative would be to select the
metric which is closest to a centroid computed as the
Euclidean mean of the cluster metrics.
After having selected the most representative
metrics, the next step is to remove any outliers. We
use an SVM one-class classifier for this task. The
classifier uses a radial kernel function, gamma and
nu are set to 0.01 and 0.1 respectively, and the
training error tolerance is set to 0.01. Given that we
our dataset contains popular high quality source
code, outliers in our case are actually low quality
classes. These are discarded since the models of
Figure 2 are trained on high quality source code. As
an indicative assessment of our classifier, we use the
number of code violations (SourceMeter, 2017).
In total, the one-class classifier ruled out 8815
classes corresponding to 9.99% of the training set.
We compare the mean number of violations for
these rejected classes and for the classes that were
accepted, for 8 categories of violations. The results,
which are shown in Table 3, indicate that our
classifier successfully rules out low quality source
code, as the number of violations for the rejected
classes is clearly higher than that of the accepted.
For instance, the classes rejected by the classifier
are typically complex since they each have on
average approximately one complexity violation; on
the other hand, the number of complexity violations
for the accepted classes is minimal. Furthermore, on
average each rejected class has more than 8 size
violations (e.g. large method bodies), whereas
accepted classes have approximately 1.
Table 3: Violations of Accepted and Rejected Files.
Violation
Types
Mean Violations
Rejected Classes Accepted Classes
WarningInfo 83.0935 18.5276
Clone 20.9365 4.3106
Cohesion 0.7893 0.3225
Complexity 1.2456 0.0976
Coupling 1.5702 0.1767
Documentation 49.9751 12.5367
Inheritance 0.4696 0.0697
Size 8.1069 1.0134
4.3 Model Preprocessing
Before model construction, we use PFA to select the
most important metrics for the five categories:
complexity metrics, coupling metrics, size metrics,
inheritance metrics, and documentation metrics. We
also perform discretization on the float variables
(TCD, NUMPAR, McCC) and on the target variable
and remove any duplicates to reduce the size of the
dataset and thus improve the training of the models.
ICSOFT 2017 - 12th International Conference on Software Technologies
78
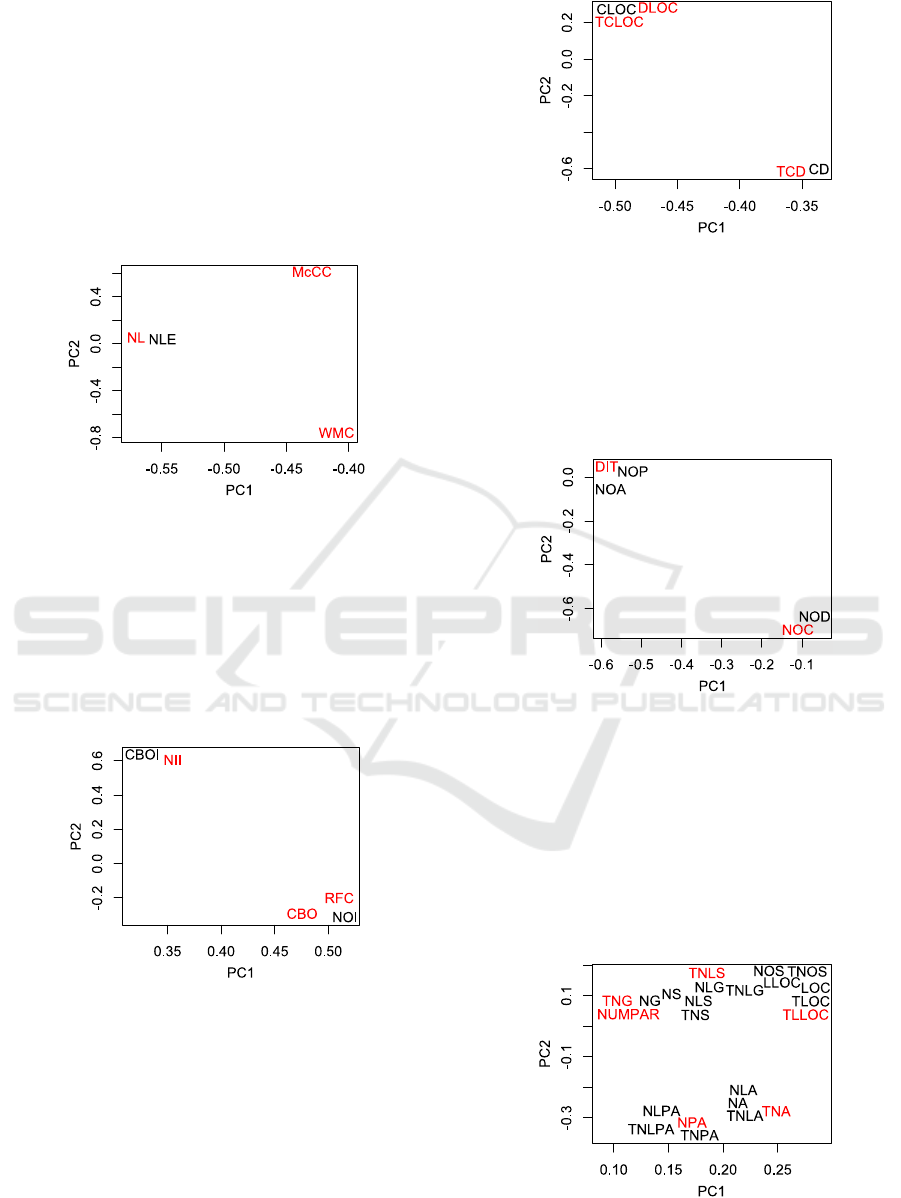
4.3.1 Complexity Model
The dataset includes four static analysis metrics that
are related to the complexity of class files: NL, NLE,
WMC, and McCC. Using PCA and keeping the first
2 principal components (84.49% of the information),
the clustering algorithm split the features in 3
clusters. Thus, the selected metrics are NL, WMC,
and McCC. Figure 5 depicts the correlation of the
metrics with the first two principal components,
where the selected metrics are shown in red.
Figure 5: Visualization of Complexity Metrics in 2 PCs.
4.3.2 Coupling Model
The coupling metrics of the dataset are CBO, CBOI,
NOI, NII, and RFC. By keeping the first 2 principal
components (84.95% of the information), we were
able to select three of them, i.e. CBO, NII, and RFC,
so as to train the ANN. Figure 6 shows the metrics
in the first two PCs, with the selected metrics in red.
Figure 6: Visualization of Coupling Metrics in 2 PCs.
4.3.3 Documentation Model
The dataset includes five documentation metrics
(CD, CLOC, DLOC, TCLOC, TCD), out of which
DLOC, TCLOC, and TCD were found to effectively
cover almost all valuable information (2 principal
components with 98.73% of the information). Figure
7 depicts the correlation of the metrics with the kept
components, with the selected metrics in red.
Figure 7: Visualization of Documentation Metrics in 2 PCs.
4.3.4 Inheritance Model
For the inheritance metrics (DIT, NOA, NOC, NOD,
NOP), the PFA resulted in 2 PCs and two metrics,
DIT and NOC, for 96.59% of the information.
Figure 8 shows the correlation of the metrics with
the PCs, with the selected metrics in red.
Figure 8: Visualization of Complexity Metrics in 2 PCs.
4.3.5 Size Model
The PCA for the size metrics indicated that almost
all information, 83.65%, is represented by the first 6
principal components, while the first 2 (that cover
53.80% of the variance) are visualized in Figure 9.
Upon executing the clustering algorithm, we select
NPA, TLLOC, TNA, TNG, TNLS, and NUMPAR
in order to cover most information for the metrics.
Figure 9: Visualization of Size Metrics in 2 PCs.
Towards Modeling the User-perceived Quality of Source Code using Static Analysis Metrics
79
4.4 Model Validation
We trained five Artificial Neural Networks (ANN),
one for each metric category. The ANN architecture
was determined with respect to each category. They
all have one input, one hidden, and one output layer.
The number of nodes is shown in Table 4.
Table 4: Artificial Neural Networks Architectures.
Metrics
Category
Input
Nodes
Hidden
Nodes
Output
Nodes
Complexity 3 1 1
Coupling 3 2 1
Documentation 3 2 1
Inheritance 2 2 1
Size 6 4 1
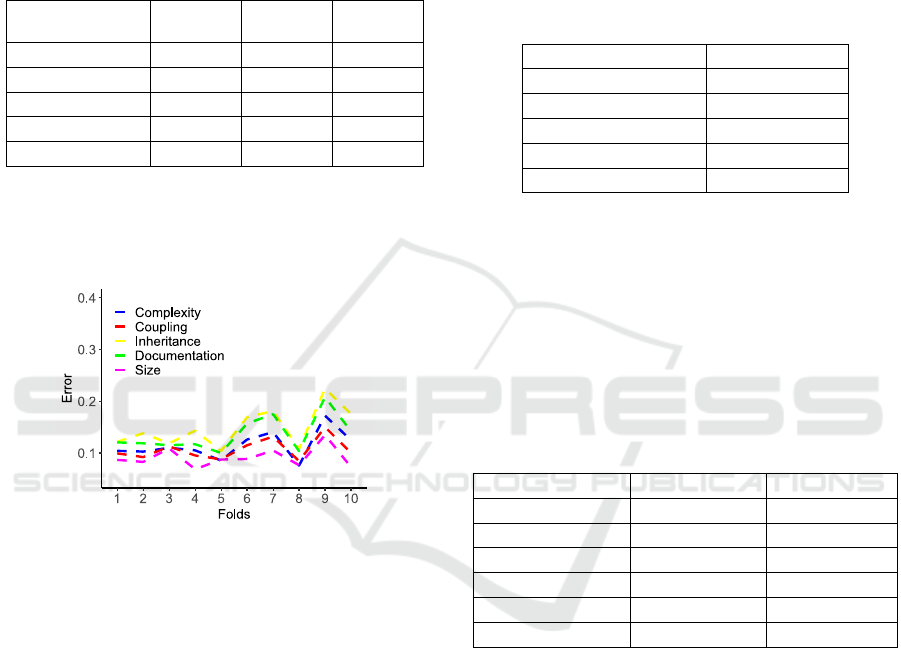
10-fold cross-validation was performed on the
training set to assess the effectiveness of the selected
architectures. The validation error for each of the 10
folds and for each model is shown in Figure 10.
Figure 10: 10-fold Cross-Validation Error for the 5 ANNs.
The performance of the models across different
folds is stable, while the error percentages are low,
indicating that the ANN architectures are effective.
4.5 Model Construction
Model construction involves training the five ANNs
using the architectures of the previous subsection.
Each model provides a quality score for a metrics
category, and all the scores are aggregated to
provide a final quality score for class files. Although
simply using the mean of the metrics is reasonable,
we use weights to effectively cover the requirements
of each individual developer. For instance, a
developer may be more inclined towards finding a
well-documented component even if it is somewhat
complex. In this case, the weights of complexity and
documentation could be adapted accordingly.
The default weight values are set according to
the correlations between the metrics of each ANN
and the target score. Thus, for the complexity score,
we first compute the correlation of each metric with
the target score (as defined in Section 3), and then
calculate the mean of the absolutes of these values.
The weights for the other categories are computed
accordingly and all values are normalized so that
their sum is 1. The weights are shown in Table 5,
while the final score is calculated by multiplying the
scores with the weights and computing their sum.
Table 5: Quality Score Aggregation Weights.
Metrics Category Weights
Complexity 0.207
Coupling 0.210
Documentation 0.197
Inheritance 0.177
Size 0.208
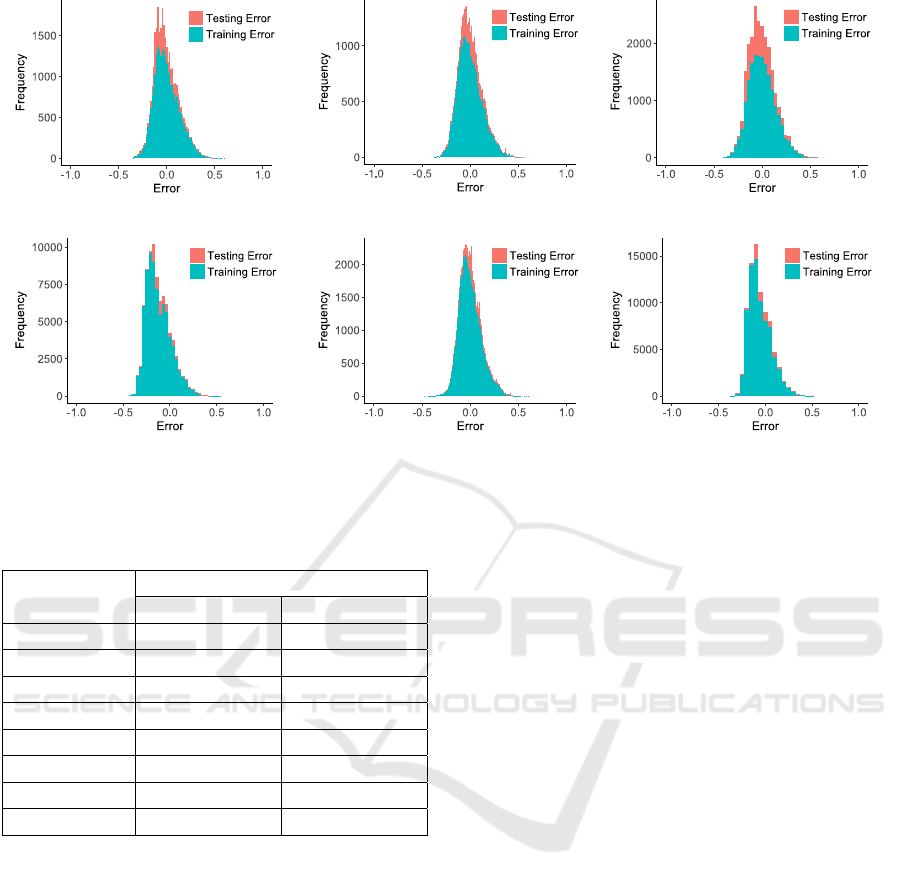
Figure 11 depicts the error distributions for the
training and test sets for the each of the five models,
as well as for the final aggregated model. The mean
error percentages are shown in Table 6. The ANNs
seem to be trained effectively, given that the error
rates of Figure 11 are low and concentrate mostly
around 0. The differences in the distributions
between the training and test sets are also minimal,
indicating that the models avoided overfitting.
Table 6: Mean Error Percentages of the models.
Metrics Category Training Error Test Error
Complexity 10.44% 9.55%
Coupling 10.13% 8.73%
Documentation 11.13% 10.22%
Inheritance 13.62% 12.04%
Size 9.15% 8.73%
Final 11.35% 8.79%
5 EVALUATION
In this section we evaluate our methodology for
estimating software quality.
5.1 One-class Classifier Evaluation
The one-class classifier is evaluated using the test
set as defined in Section 4 and using the code
violations data described in Section 3. Our classifier
ruled out 1594 classes corresponding to 19.93% of
the test set. The mean number of violations for the
rejected classes and the accepted classes are shown
in Table 7, for 8 categories of violations.
ICSOFT 2017 - 12th International Conference on Software Technologies
80
(a) (b) (c)
(d) (e) (f)
Figure 11: Error Histograms for (a) the Complexity Model, (b) the Coupling Model, (c) the Documentation Model, (d) the
Inheritance Model, (e) the Size Model, and (f) the Final Aggregated Model.
Table 7: Violations of Accepted and Rejected Files.
Violation Types
Mean Violations
Rejected Classes Accepted Classes
WarningInfo 57.6481 17.4574
Clone 18.8338 4.1953
Cohesion 0.5922 0.3003
Complexity 1.5772 0.0963
Coupling 1.4737 0.2099
Documentation 26.2083 11.4102
Inheritance 1.2516 0.2854
Size 7.7114 0.9599
The results indicate that the SVM successfully
rules out low quality source code, as the number of
violations for the rejected classes is clearly higher
than that of the accepted. Similar observations can
be made per category of violations; concerning e.g.
complexity, the rejected classes are quite complex,
with more than 1.5 violations per class; on the other
hand, the complexity violations of an accepted class
are minimal. Other outliers include classes with size
violations (more than 7 per class) or documentation
issues (more than 25 violations per class), etc.
5.2 Quality Estimation Evaluation
The error values for the quality scores provided by
our system are quite low (see Figure 11), however
we also have to assess whether these scores are
reasonable from a quality perspective. This type of
evaluation requires examining the metric values, and
studying their influence on the quality scores. To do
so, we use a project as a case study. The selected
project, MPAndroidChart, was chosen at random as
the results are actually quite similar for all projects.
For each of the 195 class files of the project, we
applied our methodology to construct the five scores
corresponding to the five source code properties and
then aggregate them in the final quality score.
We use Parallel Coordinates Plots combined with
Boxplots to examine how quality scores are affected
by the static analysis metrics (Figures 12a to 12e).
For each category, we first calculate the quartiles for
the score and construct the Boxplot. After that, we
split the data instances (metrics values) in four
intervals according to their quality score:
[min, q
),
[q
,), [med,q
), [q
,], where min and
are the minimum and maximum score values,
is the median value, and q
and q
are the first and
third quartiles, respectively. Each line in the Parallel
Coordinates Plot represents the mean values of the
metrics for a specific interval. For example, the blue
line in Figure 12a refers to the instances with scores
in the
[q
,] interval. The line is constructed by
the mean values of the metrics NL, McCC, WMC
and the mean quality score in this interval, which are
1.88, 1.79, 44.08, and 0.43 respectively. The red,
orange, and cyan lines are constructed similarly
using the instances with scores in the
[min, q
),
[q
,), and [med, q
) intervals, respectively.
Towards Modeling the User-perceived Quality of Source Code using Static Analysis Metrics
81
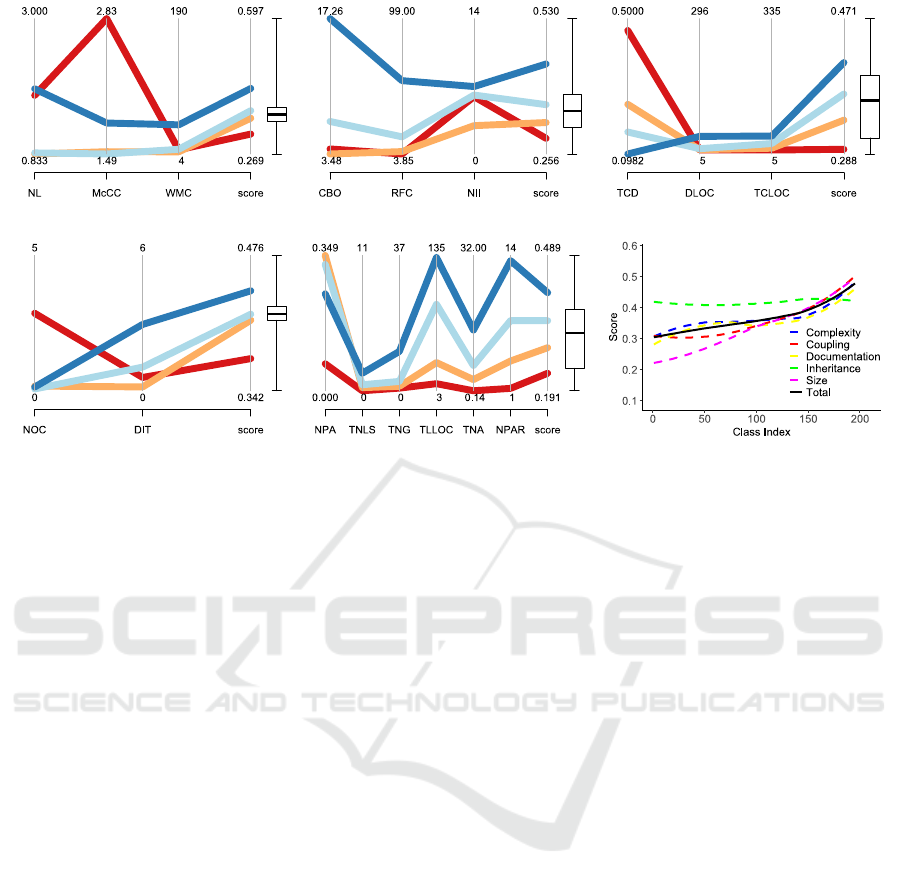
(a) (b) (c)
(d) (e) (f)
Figure 12: Parallel Coordinates Plots for the Score generated from (a) the Complexity Model, (b) the Coupling Model, (c)
the Documentation Model, (d) the Inheritance Model, (e) the Size Model, and (f) plot depicting the Score Aggregation.
Figure 12a refers to the complexity model. This
plot results in the identification of two dominant
trends that influence the score. At first, McCC
appears to be crucial for the final score. High values
of the metric result in low score, while low ones lead
to high score. This is expected since complex classes
are prone to containing bugs and overall imply low
quality code. Secondly, the metrics WMC and NL
do not seem to correlate with the score individually;
however they affect it when combined. Low WMC
values combined with high NL values result in low
quality scores, which is also quite rational given that
more complex classes with multiple nested levels are
highly probable to exhibit low quality.
Figures 12b and 12c refer to the coupling and the
documentation models, respectively. Concerning
coupling, the dominant metric for determining the
score appears to be RFC. High values denote that the
classes include many different methods and thus
many different functionalities, resulting in high
quality score. As for the documentation model, the
plot indicates that classes with high comment
density (TCD) and low number of documentation
lines (DLOC) are given a low quality score. This is
expected as this combination probably denotes that
the class does not follow the Java documentation
guidelines, i.e. it uses comments instead of Javadoc.
Figures 12d and 12e refer to the inheritance and
size models, respectively. DIT appears to greatly
influence the score generated by the inheritance
model, as its values are proportional to those of the
score. This is expected as higher values indicate that
the class is more independent as it relies mostly on
its ancestors, and thus it is more reusable. Although
higher DIT values may lead to increased complexity,
the values in this case are within acceptable levels,
thus the score is not negatively affected.
As for the size model, the quality score appears
to be mainly influenced by the values of TLLOC,
TNA and NUMPAR. These metrics reflect the
amount of valuable information included in the class
by measuring the lines of code and the number of
attributes and parameters. Classes with moderate
size and many attributes or parameters seem to
receive high quality scores. This is expected as
attributes/parameters usually correspond to different
functionalities. Additionally, a moderately sized
class is common to contain considerable amount of
valuable information while not being very complex.
Finally, Figure 12f illustrates how the individual
quality scores (dashed lines) are aggregated into one
final score (solid line), which represents the quality
degree of the class as perceived by developers. The
class indexes (project files) are sorted in descending
order of quality score. The results for each score
illustrate several interesting aspects of the project.
For instance, it seems that the classes exhibit similar
inheritance behavior throughout the project. On the
other hand, the size quality score is diverse, as the
project has classes with various size characteristics
(e.g. small or large number of methods), and thus
ICSOFT 2017 - 12th International Conference on Software Technologies
82
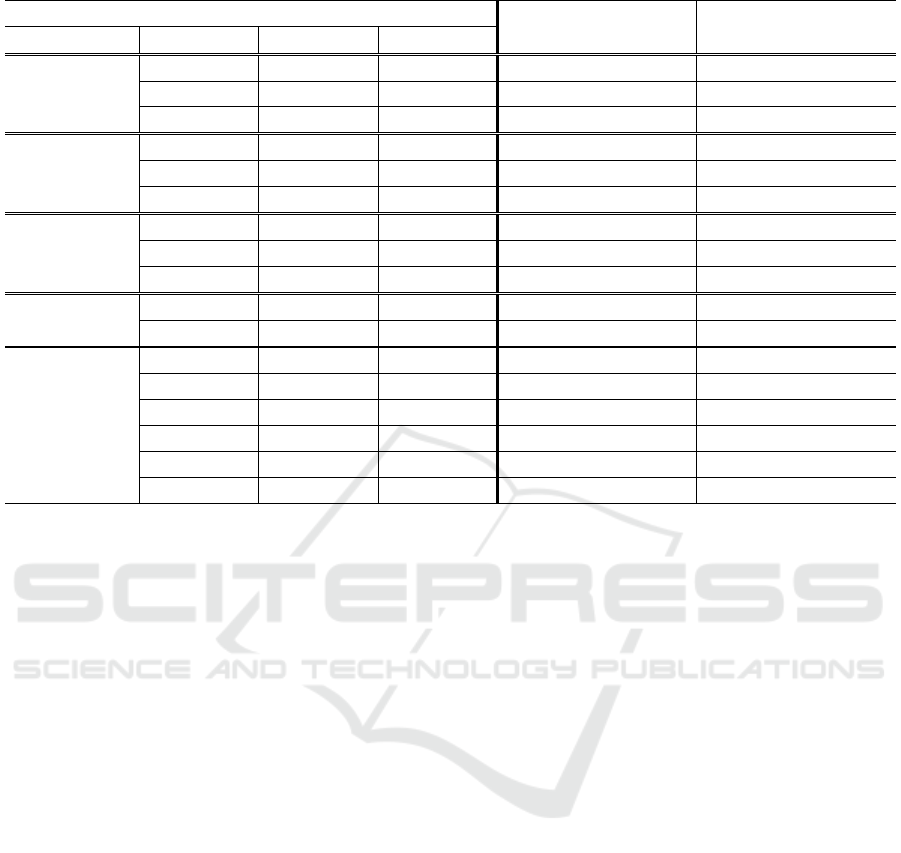
Table 8: Static Analysis Metrics per Property for 10 Classes (separated by double line border) with different Quality Scores.
Static Analysis Metrics
Class with High Quality
Score per Category
Class with Low Quality
Score per Category
Category Name Min Value Max Value
Complexity
McCC 1 39
2.3
8.5
WMC 0 498 273 51
NL 0 55
4 28
Coupling
NII 0 3,195 88 0
RFC 0 360
65 7
CBO 0 191 5 35
Documentation
TCD 0 1 0.3
0.8
DLOC 0 3,163
917
2
TCLOC 0 4,515 1,019 19
Inheritance
DIT 0 9
8
0
NOC 0 65 1 16
Size
NUMPAR 0 423 27 3
TNG 0 327 86
0
TNA 0 404 69
0
NPA 0 254 36
0
TLLOC 0 4,049 189
10
TNLS 0 129 13 2
their score may be affected accordingly. Finally, the
trends of the individual scores are in line with the
final score, while their variance gradually decreases
as the final score increases. This is expected as a
class is typically of high quality if it exhibits
acceptable metric values in several categories.
5.3 Example Quality Estimation
Further assessing the validity of our system, for each
category we manually examine the values of the
static analysis metrics of two sample classes that
received high and low quality scores, respectively
(Table 8). Note that the presented static analysis
metrics refer to different classes for each category.
For the complexity model, the class that received
low score appears to be much more complex than
the one that received high score. This is reflected in
the values of McCC and NL, as the low-scored class
includes more complex methods (8.5 versus 2.3),
while it also has more nesting levels (28 versus 4).
For the coupling model, the high-quality class
has significantly higher NII and RFC values when
compared to those of the low-quality class. This
difference in the number of exposed functionalities
is reflected in the quality score. The same applies for
the inheritance model, where the class that received
high score is a lot more independent (higher DIT)
and thus reusable than the class with the low score.
Finally, as for the documentation and size
models, in both cases the low-quality class appears
to have no valuable information. In the first case,
this absence is obvious from the extreme value of
comments density (TCD) combined with the
minimal documentation (TCLOC). In the second
case, the low-quality class contains only 10 logical
lines of code (TLLOC), which indicates that it is of
almost no value for the developers. On the other
hand, the high-quality classes seem to have more
reasonable metric values.
5.4 Threats to Validity
The threats to the validity of our approach and our
evaluation involve both its applicability to software
projects and its usage by the developers. Concerning
applicability, the dataset used is quite diverse; hence
our methodology can be seamlessly applied to any
software project for which static analysis metrics can
be extracted. Concerning expected usage, developers
would harness the quality estimation capabilities of
our approach in order to assess the quality of their
own or third-party software projects before (re)using
them in their source code. Future work on this aspect
may involve integrating our approach in a system for
software component reuse, either as an online
component search engine or as an IDE plugin.
Towards Modeling the User-perceived Quality of Source Code using Static Analysis Metrics
83

6 CONCLUSIONS
In this work, we proposed a new software quality
estimation approach, which employs information
about the popularity of source code components to
model their quality as perceived by developers.
Upon removing outliers using a one-class classifier,
we apply Principal Feature Analysis techniques to
effectively determine the most informative metrics
lying in five categories: complexity, coupling,
documentation, inheritance, and size metrics. The
metrics are subsequently given to five neural
networks that output quality scores. Our evaluation
indicates that our system can be effective for
estimating the quality of software components as
well as for providing a comprehensive analysis on
the aforementioned five source code quality axes.
Future work lies in several directions. At first,
the design of our target variable can be further
investigated for different scenarios and different
application scopes. In addition, various feature
selection techniques and models can be tested to
improve on current results. Finally, we could assess
the effectiveness of our methodology by means of a
user study, and thus further validate our findings.
REFERENCES
Alves Tiago L., Christiaan Ypma, and Joost Visser (2010).
Deriving metric thresholds from benchmark data. In
2010 IEEE International Conference on Software
Maintenance (ICSM), pp. 1–10.
Cai, T., Lyu, M., Wong, K.-F. and Wong, M. (2001).
ComPARE: A generic quality assessment environment
for component-based software systems. In 2001
International Symposium on Information Systems and
Engineering (ISE’ 2001), pp. 348–354.
Chidamber S. R. and Kemerer C. F. (1994). A Metrics
Suite for Object-Oriented Design. IEEE Trans.
Software Eng., vol. 20, no. 6, pp. 476–493.
Diamantopoulos, T., Thomopoulos, K. and Symeonidis A.
(2016). QualBoa: Reusability-aware Recommendations
of Source Code Components. In 13th International
Conference on Mining Software Repositories (MSR
'16). ACM, pp. 488–491.
Ferreira, K. A., Bigonha, M. A., Bigonha, R. S., Mendes,
L. F., & Almeida, H. C. (2012). Identifying thresholds
for object-oriented software metrics. Journal of
Systems and Software, 85(2), 244–257.
Foucault M., Palyart, M., Falleri, J. R., & Blanc X. (2014).
Computing contextual metric thresholds. In 29th ACM
Annual Symposium on Applied Computing, pp. 1120–1125.
Hegedűs, P., Bakota, T., Ladányi, G., Faragó, C., &
Ferenc, R. (2013). A drill-down approach for measuring
maintainability at source code element level.
Electronic Communications of the EASST, 60, 1–21.
Heitlager, I., Kuipers, T., & Visser, J. (2007). A practical
model for measuring maintainability. In IEEE 6th
International Conference on the Quality of Information
and Communications Technology, pp. 30–39.
ISO/IEC 25010:2011 (2011). [Retrieved March, 2017].
[Online]. Available: https://www.iso.org/obp/ui/#iso:
std:iso-iec:25010:ed-1:v1:en.
Kanellopoulos Y., Antonellis P., Antoniou D., Makris C.,
Theodoridis E., Tjortjis C. and Tsirakis N. (2010).
Code Quality Evaluation Methodology Using The
ISO/IRC 9126 Standard. Int. Journal of Software
Engineering & Applications, vol. 1, no. 3, pp. 17–36.
Kitchenham B. and Pfleeger S. L. (1996). Software
quality: The elusive target. IEEE Software, vol. 13, no.
1, pp. 12–21.
Le Goues C. and Weimer W. (2012). Measuring code
quality to improve specification mining. In IEEE
Transactions on Software Engineering, pp. 175–190.
Lu, Y., Cohen, I., Zhou, X. S. and Tian, Q. (2007). Feature
selection using principal feature analysis. In 15th ACM
International Conference on Multimedia, pp. 301-304.
Miguel, J. P., Mauricio, D., & Rodríguez, G. (2014). A
review of software quality models for the evaluation of
software products, arXiv preprint arXiv:1412.2977.
Papamichail, M., Diamantopoulos, T. and Symeonidis, A.
(2016). User-Perceived Source Code Quality
Estimation Based on Static Analysis Metrics. 2016
IEEE International Conference on Software Quality,
Reliability and Security (QRS), Vienna, pp. 100–107.
Pfleeger S. L. and Atlee J. M. (2009). Software
Engineering: Theory and Practice, Fourth Edition,
Pearson Education India.
Samoladas, I., Gousios, G., Spinellis, D., & Stamelos, I.
(2008). The SQO-OSS quality model: measurement
based open source software evaluation. In IFIP
International Conference on Open Source Systems, pp.
237–248. Springer US.
Schmidt C. (2015). Agile Software Development Teams,
First Edition, Springer Publishing Company.
Shatnawi R., Li W., Swain J., & Newman, T. (2010).
Finding software metrics threshold values using ROC
curves. Journal of software maintenance and
evolution: Research and practice, 22(1), 1–16.
SourceMeter (2016). [Retrieved March, 2017]. [Online].
Available: https://www.sourcemeter.com/
Taibi F. (2014). Empirical Analysis of the Reusability of
Object-Oriented Program Code in Open-Source Software.
International Journal of Computer, Information, System
and Control Engineering, vol. 8, no. 1, pp. 114–120.
Washizaki, H., Namiki, R., Fukuoka, T., Harada, Y. and
Watanabe, H. (2007). A Framework for Measuring
and Evaluating Program Source Code Quality. In
International Conference on Product Focused Soft-
ware Process Improvement, pp. 284–299.
Zhong, S., Khoshgoftaar, T. M. and Seliya, N. (2004).
Unsupervised Learning for Expert-Based Software
Quality Estimation. In 8th International Symposium on
High Assurance Systems Engineering, pp. 149–155.
ICSOFT 2017 - 12th International Conference on Software Technologies
84
