
An Evaluation of Variability Mechanisms to Manage Cloud Services
Ateeq Khan, Matthias Pohl, Veit K
¨
oppen, Gunter Saake and Klaus Turowski
University of Magdeburg, Germany
Keywords:
Variability Questionnaire, Cloud Computing, Service Models, Evaluation Criteria.
Abstract:
There is an increasing demand for customizable services by consumers in service-oriented or cloud computing
domain. Service providers have to provide various kinds of variability in their services. However, there is a
lack of information which illustrates how practitioners and providers cope with the variability problem in the
service domain. We conduct a survey to get insights from participants what kind of variability exists and
how to provide/manage variability for service-oriented domain. We also analyze the importance of criteria
for variability mechanisms and discuss it in this paper. In short, we reveal the understanding of variability
between survey participants and which criteria are important when choosing an approach to provide variability
in services domain.
1 INTRODUCTION
In today’s dynamic environment, enterprises are in-
terested in making their IT landscape flexible, from
applications to infrastructure. Enterprises prefer to
consume those services which are adaptable and align
better to fulfill requirements of their business. Cloud
computing is an architectural option that gained popu-
larity in the last decade to host and build applications,
platforms, and computing environments.
Cloud service providers face several challenges to
meet the changing functional and non-functional de-
mands of customers. They have to provide solutions
for these requirements to retain customers and to re-
main competitive. Variability is the ability of a sys-
tem to extend, modify, customize, or configure the
functionality for a particular context (Svahnberg et al.,
2005).
There are numerous approaches(Pohl et al., 2005)
and tools (K
¨
astner et al., 2009; Beuche, 2012) to
manage variable requirements, which are discussed in
the software product lines (SPL) domain. In (Bogart
et al., 2016), authors survey the change management
approaches in three software eco-systems. However,
such requirements are also present in services, which
are often not discussed, especially in the cloud com-
puting domain. There are also surveys (Villela et al.,
2014; Berger et al., 2013; Chen and Ali Babar, 2011;
Hubaux et al., 2011) about variability management in
SPL and in software engineering process. However,
only few empirical studies address variability issue is
service domain.
There is lack of information how variability is
offered and managed in service-oriented computing
(SOC) projects, so we address this issue. Variability
management is a key activity in SPL domain, which
enables organizations to manage variability. We be-
lieve that variability approaches from SPL, e.g., fea-
ture modeling, can be used in SOC domain. There are
existing works, which address the issue from limited
perspective. For example, in (Khan et al., 2011b), au-
thors classify various types of variability in different
layers.
In this paper, we want to get feedback from par-
ticipants and highlight how diverse requirements are
managed in a service domain. To fill the gap, we
use quantitative research method (Posavac, 2015) to
gather the feedback from participants and analyzing it
with statistical methods. For statistical analysis pur-
pose, we use R to analyze the data. We use SOC term
to represent the service-orientation options whether it
is from SOC, cloud computing or for web applications
based on services.
The primary objective of our survey is to provide
empirical data on how participants manage variability
in SOC domain. We also get the feedback from re-
spondents regarding important criteria for variability
mechanisms in SOC domain. At the end of our sur-
vey, we aim to get the feedback from the users, which
service variability patterns (as discussed in (Khan
et al., 2011a)) users already know and how they rate
those patterns from various evaluation criteria per-
spectives. We use 25 responses from the respondents.
We argue, variability management plays an important
100
Khan, A., Pohl, M., Köppen, V., Saake, G. and Turowski, K.
An Evaluation of Variability Mechanisms to Manage Cloud Services.
DOI: 10.5220/0006421401000107
In Proceedings of the 14th International Joint Conference on e-Business and Telecommunications (ICETE 2017) - Volume 2: ICE-B, pages 100-107
ISBN: 978-989-758-257-8
Copyright © 2017 by SCITEPRESS – Science and Technology Publications, Lda. All rights reserved

role to manage variability in SOC. More focus or at-
tention is required for its utilization by offering more
tools and methods.
2 QUESTIONNAIRE STRUCTURE
The questionnaire comprises of four sections. In the
first section, we gather general information about our
participants, e.g., age range, gender, qualification.
Section 2 questions the participant’s experience, role,
and size of the projects, and how development is done
in SOC domain. For our questionnaire, we use SOC
or services as an umbrella term for service-oriented
system engineering, cloud computing, and develop-
ment related to web applications.
Section 3 corresponds to the type of variability in
SOC, what kind of approaches users apply to manage
variability and weighting for variability mechanisms.
In Section 4, we collect feedback on an existing pat-
tern catalog (Khan et al., 2011a). We briefly explain
the variability patterns and ask participants to rate
them against selected evaluation criteria. Detailed re-
sults are described in Section 4. The questionnaire is
available online on this
1
website.
Questionnaire is a data collection technique in
quantitative research. We use the questionnaire as
a technique to collect data, which contain questions
in a pre-defined way. Awareness of different types
of questions is vital for the design of a question-
naire (Dillman et al., 2008). There are different types
of questions, e.g., open-ended, close-ended, which we
ask in our questionnaire. Some of them are close-
ended questions and some are open-ended questions.
Open-ended questions provide the participants the
opportunity to give feedback instead of selecting pre-
defined options. We use a Likert scale (Likert, 1932)
for some questions. Likert scale enables us to get the
ratings of particular questions from the survey partic-
ipants. The feedback results in ordinal data.
For Likert scale, we use 3-point and 5-point scale
which we afterward code into numbers. We use quan-
titative techniques for the questions where applicable.
In next section, we provide detailed descriptions of
our analysis techniques.
3 METHODOLOGY
Asking right questions is a challenging task, as the
outcome depends on the question posed (Bradburn
et al., 2004). For the preparation of our questionnaire,
1
www.bit.do/vmcloud1
we use a three-step approach. Firstly, we design
the complete questionnaire. Secondly, we use a pre-
testing method expert review (Rothgeb et al., 2007;
Presser and Blair, 1994; Presser et al., 2004a; Presser
et al., 2004b) on the questionnaire to check for nec-
essary modifications, problematic questions, or to re-
move the ambiguity. It is an important step, because
small changes or questions wording have also impact
on outcomes as described in (Bradburn et al., 2004).
We do not ask the reviewers to fill the resulting ques-
tionnaire. Lastly, we distribute our questionnaire to
experts by sharing the link. Some of the participants
fill the questionnaire using a traditional method, e.g.,
by filling the printed questionnaire with a pen. After
observing the distribution of responses, it is suitable
to get a view of the mean value over all participants
feedback.
In order to present the data in an appreciate
manner, we use plotRadarPerformanceTable function
from R package MCDA and barplot from core R.
R is an environment
2
for statistical computing and
also used for data analysis. Numerous packages
are available through Comprehensive R Archive Net-
work. There are a lot of discussions about the usage of
mean, median or mode in statistical analysis. Within
the receiving of ordinal data (Likert Scale) median or
mode should be preferred. However the choice de-
pends on the given data (Campbell, 2009). For data
presentation, we use mean values.
Though descriptive analysis (µ, σ, etc.) is not de-
sirable, we receive significance by testing for the hy-
pothesis H
q
0
: µ ≤ δ with the alternative hypothesis
H
q
1
: µ > δ , where δ describes the medium level at a
survey question q. In all these cases we use Wilcoxon-
Mann-Whitney-Test(Mann and Whitney, 1947) that is
suitable for ordinal data (Gehan, 1965). The Student’s
T-Test, which is widely used (Vale et al., 2012), can-
not be applied, because we cannot guarantee the nor-
mality assumption.
4 RESULTS
We received 25 responses from all contacted experts.
All participants have worked on projects in SOC do-
main. In this section, we present some results on
all question sections. The participants had to rate
the answer options for several questions. These an-
swer options differ between {Very Rare, Rare, Some-
times, Often, Very Often}, {Very low, Low, Neutral,
High, Very high}, {Easy, Medium, Hard} and {Low,
Medium, High}.
2
https://www.r-project.org/
An Evaluation of Variability Mechanisms to Manage Cloud Services
101
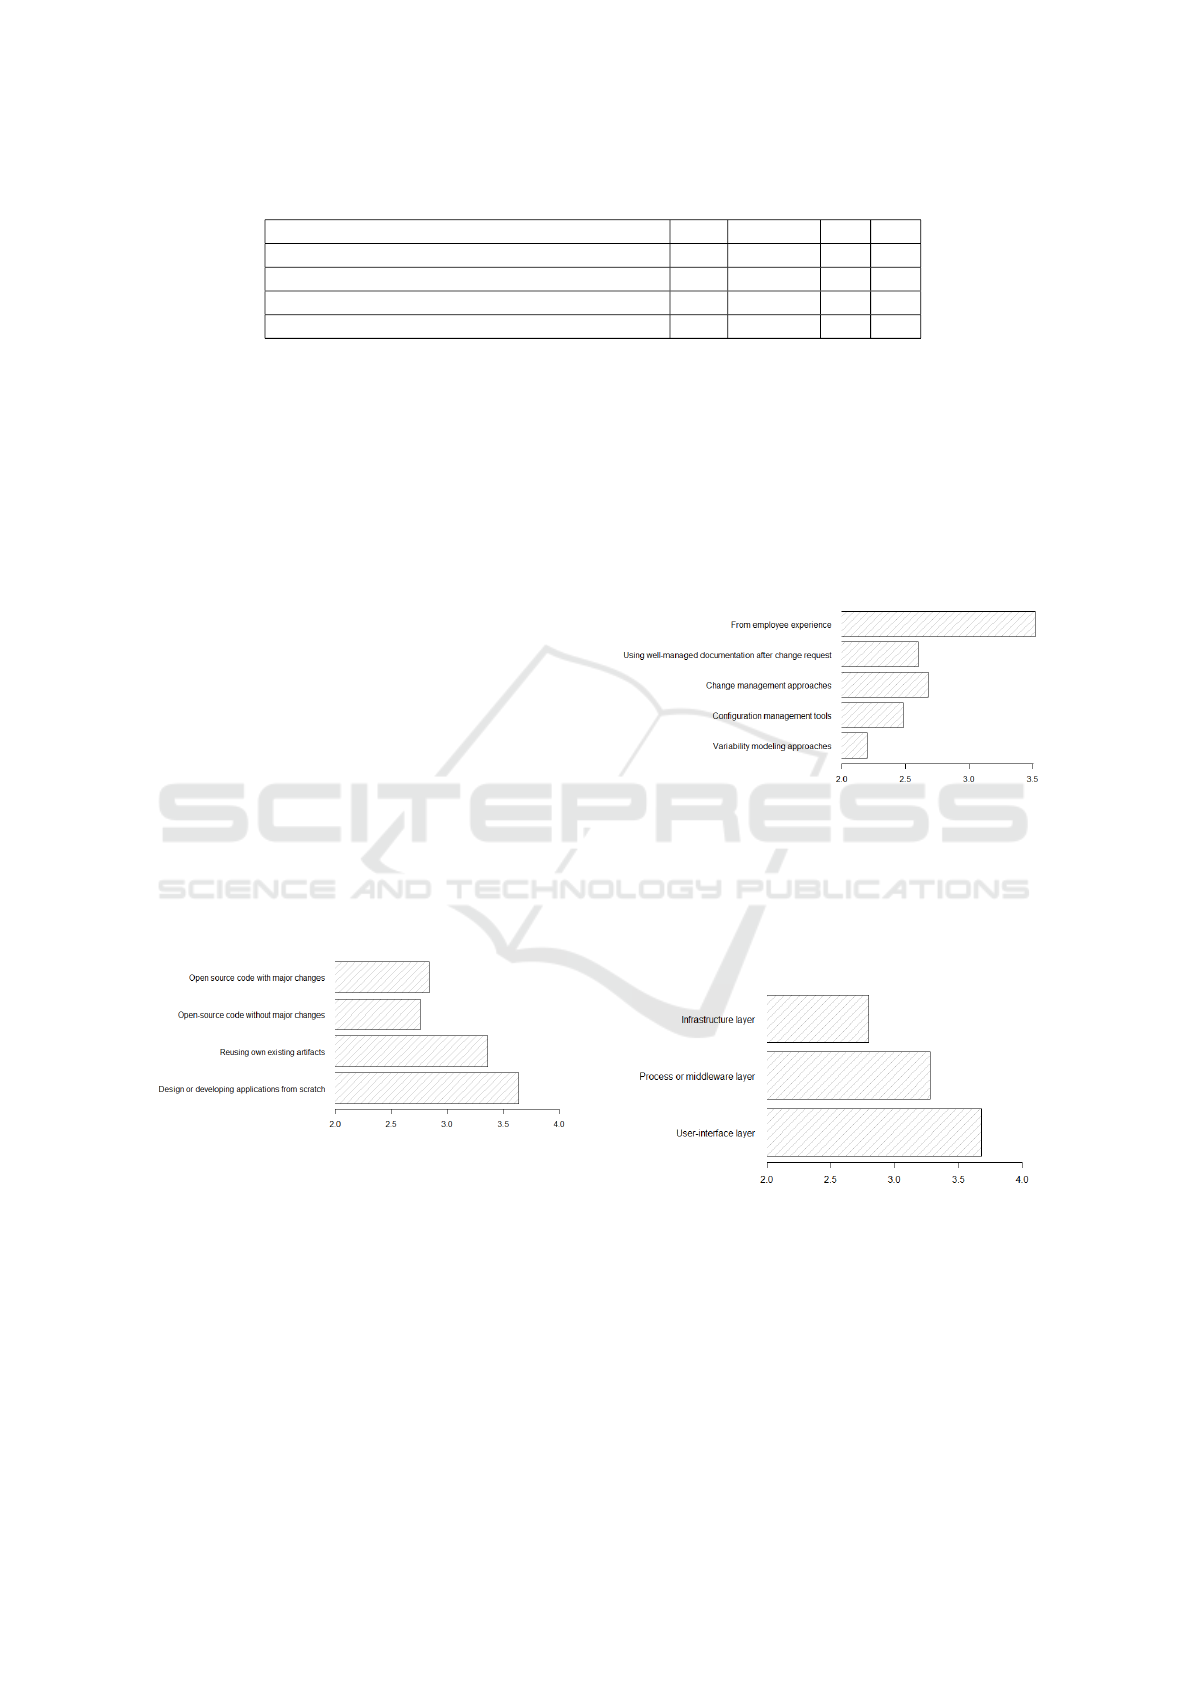
Table 1: Wilcoxon-Test results of ”‘How development was done in SOC projects?”’.
How development was done in SOC projects? W p-value H
0
H
1
Design or developing applications from scratch 193 0.00177 0 1
Reusing own existing artifacts 81 0.02892 0 1
Open-source code without major changes 73 0.7207 1 0
Open source code with major changes 41 0.7716 1 0
Finally, we substitute given answers by a rating
of numbers (1-5 or 1-3), where 5 or 3 is the highest
rating depending on the question. In all figures shown
in this paper, we use mean values of the observations
on the x-axis.
4.1 General Information
The majority of the participants (52%) work for com-
panies. 42% of the participants belongs to universities
or research organization (only 28% were from the uni-
versities), while only 8% of the participants belongs
to others or mixed category. This seems fairly repre-
sentative.
4.2 Service-oriented Computing
In this section, we asked numerous questions related
to SOC domain including participants experience and
roles in the domain. One of the important question
was “How development was done in those projects?”,
the response is shown in Figure 1. Only one expert
uses the partially closed-ended question option and
gave an option that Sometimes they also use customer
code.
Figure 1: How development was done in SOC projects.
In Table 1, one finds the corresponding Wilcoxon-
Test results (W), testing for H
0
: µ ≤ 3 with H
1
: µ > 3.
From the above section 4, one considers that 3 is a
code for answer Sometimes, so we test if an option is
used less equal or more than Sometimes. Table 1 pro-
vides the test-statistic W that is evaluated with spe-
cific probability distribution to obtain p-value. On
this basis, we can decide whether to accept null or
alternative hypothesis. Applications in SOC will be
developed more often from scratch or on reusing own
existing artifacts than based on open source code.
4.3 Variability
In this section, we ask about how they manage vari-
ability in the project. The responses were mostly by
experienced employees (shown in Figure 2), which
indicates that there is no specific methodology or tool
used for such a purpose. The Wilcoxon test results are
depicted in Table 2. It is also a challenge for organiza-
tions when an employee changes the project or quits
the job, because he/she also takes tacit knowledge.
Figure 2: How to manage variability.
Next, we asked questions related to variability
in SOC environment: “What kind of changes (or at
which layer) are usually requested?”. Here, we iden-
tify in which layer changes are requested. Results are
shown in Figure 3. The responses show that changes
at user-interface layer are common to occur.
Figure 3: Layers with provided variability.
“How do you provide variability in single-tenant
cases?” Feedback is presented in Figure 4, and cus-
tomer changes are directly incorporated in their cor-
responding instance in case of single tenant environ-
ment.
“How do you provide variability in multi-tenant
cases?” Feedback output is shown in Figure 5. It does
not give a clear picture.
ICE-B 2017 - 14th International Conference on e-Business
102
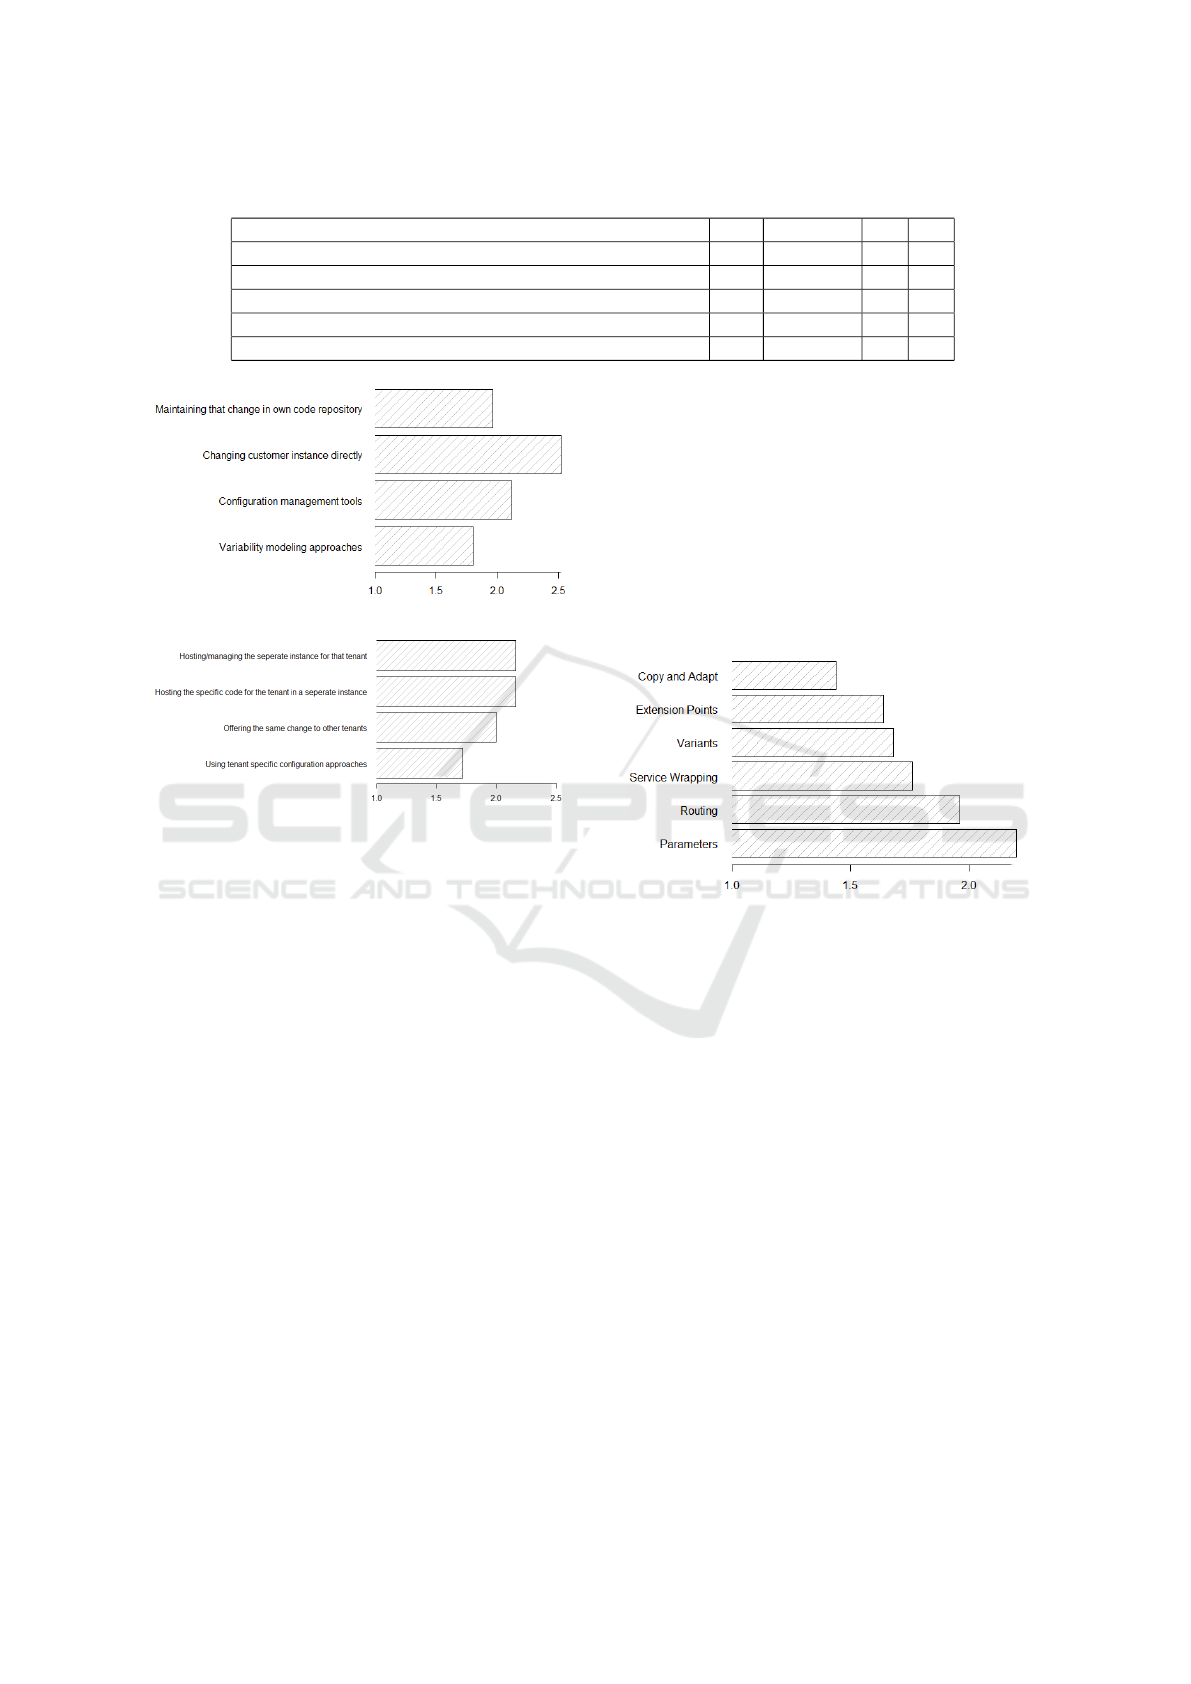
Table 2: Wilcoxon-Test results testing for H
0
: µ ≤ 3 with H
1
: µ > 3.
How to manage variability? W p-value H
0
H
1
Variability modeling approaches 30 0.9617 1 0
Configuration management tools 43 0.5722 1 0
Change management approaches 57 0.198 1 0
Using well-managed documentation after change request 49 0.5921 1 0
From employee experience 198 0.001214 0 1
Figure 4: Providing variability in single tenant case.
Figure 5: Providing variability in multi-tenant case.
“How do you rate the importance of following cri-
teria for variability mechanism in SOC?”. We provide
various criteria as options and conclude in Figure 7.
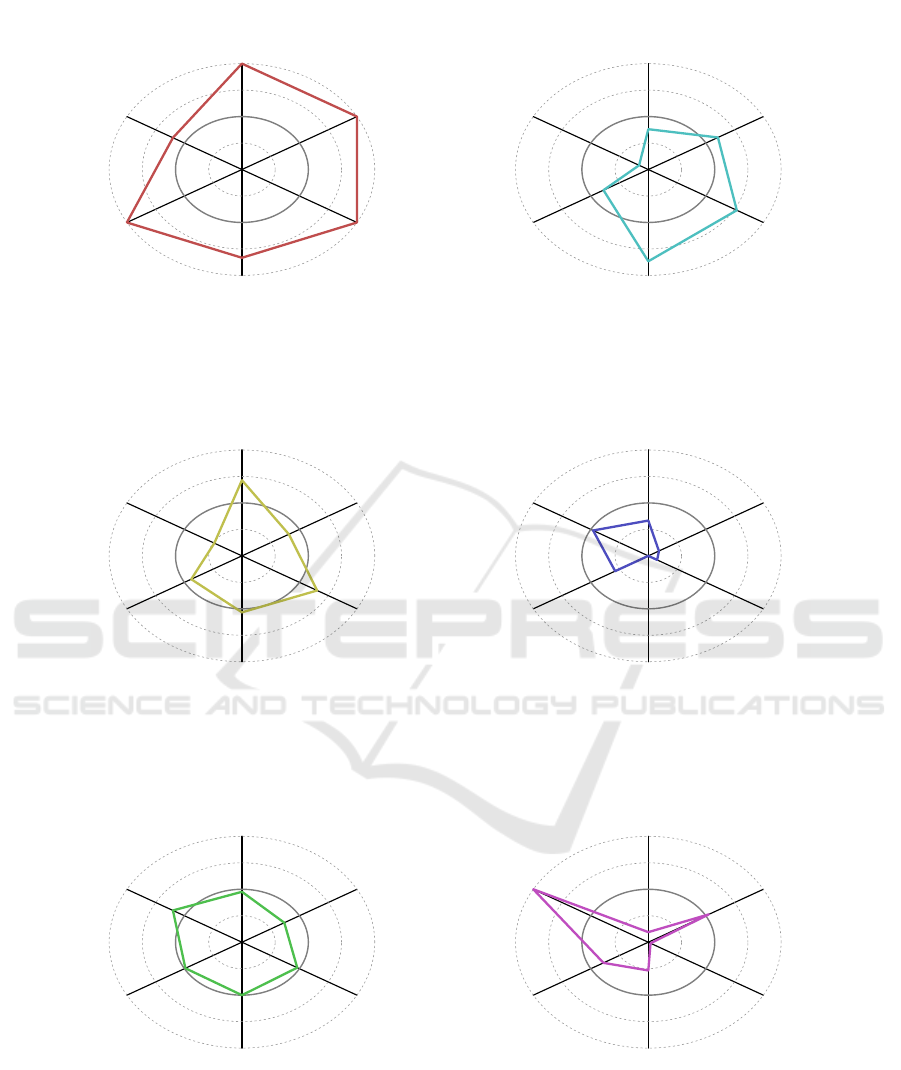
4.4 Service Pattern Catalog
In this section of the questionnaire, we describe vari-
ous existing methods from literature in form of a pat-
tern catalog to provide variability. We asked our par-
ticipants for rating of each pattern to manage vari-
ability from different perspectives (called evaluation
criteria for each pattern). The outcome is summa-
rized and depicted in Figure 13. First of all, we query
whether the participants know the above-described
patterns. Afterward, we ask them whether they have
used these patterns to provide variability in their
projects. In the end, we seek answers to the following
questions from our participants regarding six evalua-
tion characteristics.
Required changes characteristic refers to the num-
ber of changes or effort needed to use a pattern in a
given situation or to fulfill a variability requirement.
From a developer perspective, less effort or low num-
ber of changes are desirable. If a developer has to
perform a lot of changes, then she/he has to put more
effort and may make the pattern error prone.
We asked the following question: “How do you
rate the following patterns from the change required
perspective?”. The feedback of this questions is in
Figure 6. Flexibility criterion is used to assess how
much flexibility a pattern or approach offer to the de-
veloper when he chooses a selected approach. High
flexibility means the approach can be used to offer
various kinds of variability. Low flexibility means
the approach does not provide much freedom to meet
variability requirement.
Figure 6: Patterns from change perspective.
The question asked is: “How do you rate the fol-
lowing patterns from the flexibility perspective?”. As,
it is evident from Figure 8, Copy and Adapt pattern
provides more flexibility than the other patterns.
Scalability criterion measures the scalability of
technique. Whether the technique is scalable on a
larger scale or not?. Does it scale, can we use it in a
complex situation or can we use the pattern if we are
scaling up the application. From a stakeholder per-
spective, high scalability is preferred vs. low scalabil-
ity. The related question is as follows: “How do you
rate the following patterns from the scalability per-
spective?”. The response is highlighted in Figure 9.
The criterion risk is used to assess whether the se-
lected mechanism or approach introduce risks or vul-
nerabilities in the system. Risks can also be consid-
ered from a security perspective. If a technique is
more vulnerable, then it is less preferred vs. a less
vulnerable technique. So, a technique with a high risk
is considered as not preferred. We asked the follow-
ing question: “How do you rate the following patterns
from the risk perspective?” Figure 10 shows our re-
An Evaluation of Variability Mechanisms to Manage Cloud Services
103
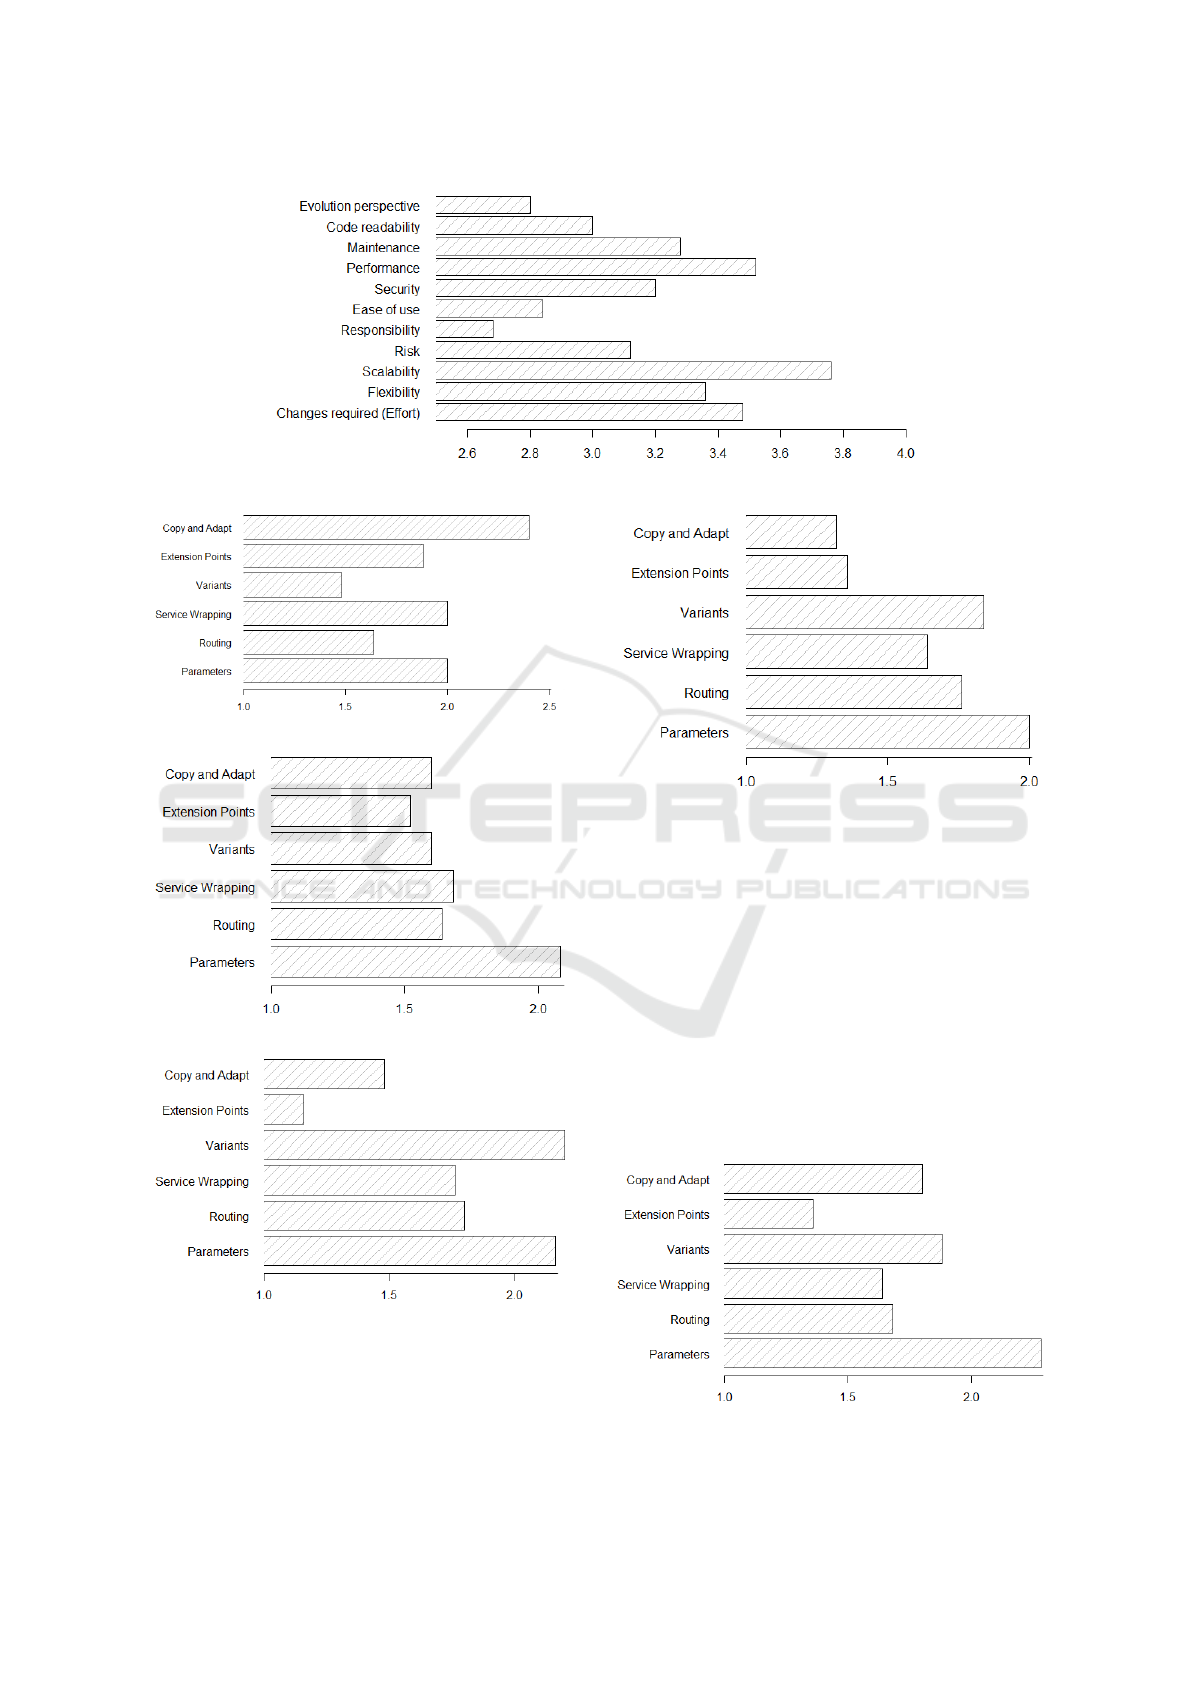
Figure 7: Importance of criteria.
Figure 8: Patterns from the flexibility perspective.
Figure 9: Patterns from the scalability perspective.
Figure 10: Patterns from the risk perspective.
sults.
The criterion maintenance is used to define how
easy or difficult a technique is when the developer has
to perform changes afterwards. Whether it is easy to
Figure 11: Patterns from maintenance perspective.
perform changes, e.g. from repairing, debugging or
refactoring perspectives. A technique which is easier
to maintain is preferred from developers. The ques-
tion is:
“How do you rate the following patterns from the
maintenance perspective?”. The output is depicted in
Figure 11.
The implementation perspective is used to assess
whether the pattern or technique is easy to implement,
use and understand. A pattern easily implementable
is desirable from the developer perspective.
“How do you rate the following patterns from
implementation perspective?” Figure 12 shows the
trend.
Figure 12: Patterns from implementation perspective.
ICE-B 2017 - 14th International Conference on e-Business
104
Parameters
Change Requirement
Flexibility
Scalability
Risk
Maintenance
Implementation
Routing
Change Requirement
Flexibility
Scalability
Risk
Maintenance
Implementation
Service Wrapping
Change Requirement
Flexibility
Scalability
Risk
Maintenance
Implementation
Variants
Change Requirement
Flexibility
Scalability
Risk
Maintenance
Implementation
Extension Points
Change Requirement
Flexibility
Scalability
Risk
Maintenance
Implementation
Copy and Adapt
Change Requirement
Flexibility
Scalability
Risk
Maintenance
Implementation
Figure 13: Comparison of Patterns against Evaluation Criteria.
An Evaluation of Variability Mechanisms to Manage Cloud Services
105

5 DISCUSSION
Although, as described in the literature, the shorter
questionnaire are better in terms of response rate, We
asked 49 questions in the questionnaire which makes
it quite long and required 10-15 minutes for filling
it, but we asked only those experts who know this
before and really willing to provide feedback in our
questionnaire. The questionnaire results reveal that
the variability management or mechanisms are rarely
used in SOC projects.
For the purpose of graphical representation of par-
ticipants feedback about our service patterns and se-
lected evaluation criteria, we use a radar chart. Radar
plots compare multiple quantitative variables, in our
case these variables are evaluation criteria, and suit-
able for a limited number of variables. Dotted points
in radar plot are data points. Circles represent the axis
and scale. In Figure 13, the scale is the mean value
of the evaluation criteria and range from a minimum
value of all variable to the maximum value of all vari-
able.
The outcome of all questions in this section is
summarized using radar plot for each pattern and de-
picted in Figure 13 (for clear representation we do
not show the values on circle axis).
As we can see from Figure 13, the parameter pat-
tern can be considered as a candidate after consider-
ing the feedback from experts because of the values of
evaluation criteria. Service wrapping pattern is also a
candidate to provide variability in most of the cases.
6 LIMITATIONS
We used printed and web-based methods to conduct
our questionnaire. However, there are some problems
and disadvantages we faced. For example for printed
or written questionnaire, participants can go through
the whole questionnaire first (which is not possible in
our designed questionnaire, only one section is avail-
able at one time), or may not prefer to write answers
by hand. Furthermore, using a questionnaire tech-
nique to collect data has other limitations. For exam-
ple, how to ensure that the participant is given right or
truthful information.
The Likert Scale has a disadvantage that a partici-
pant may follow a specific pattern to fill other options
or questions, e.g., being neutral or selecting extreme
values from both sides.
There are also some challenges in processing the
feedback, e.g., possibility of misreading the text for
the hand-filled questionnaire, typing or coding mis-
takes when transferring data from paper based form
to a computer for analysis.
We did not include six responses from the experts
because responses were not complete due to numer-
ous reasons (e.g., Google form did not respond when
some participants submit the response or submitted
a blank feedback, internet connection problems, the
questionnaire was not completely filled due to lack of
interest of some of the participants).
7 SUMMARY AND FUTURE
WORK
We aim to find out how practitioners manage variabil-
ity in SOC and what criteria is important when select-
ing or choosing a technique to provide variability. The
data gathered from the contacted experts in the form
of questionnaire feedback enable us to provide some
insights about this topic. We also got the feedback
regarding our existing patterns to provide variability.
The questionnaire results reveal that the variability
management or mechanisms are rarely used in SOC
projects.
In future, we want to include the feedback of par-
ticipants what are their experience and more insights
they gain when they use our patterns in real projects.
From the questionnaire perspective, it would be inter-
esting to find about the influence of the order of posed
questions and whether there would be the tendency to-
ward the middle or not in the case of an uneven Likert
scale.
REFERENCES
Berger, T., Rublack, R., Nair, D., Atlee, J. M., Becker, M.,
Czarnecki, K., and Wkasowski, A. (2013). A Survey
of Variability Modeling in Industrial Practice. In Va-
MoS’13, p. 7:1–7:8. ACM.
Beuche, D. (2012). Modeling and Building Software Prod-
uct Lines with pure::variants. In SPLC’12, p. 255.
ACM.
Bogart, C., K
¨
astner, C., Herbsleb, J., and Thung, F. (2016).
How to Break an API: Cost Negotiation and Commu-
nity Values in Three Software Ecosystems. In FSE
2016, p. 109–120. ACM.
Bradburn, N., Sudman, S., and Wansink, B. (2004). Ask-
ing Questions: The Definitive Guide to Questionnaire
Design – For Market Research, Political Polls, and
Social and Health Questionnaires. Research Methods
for the Social Sciences. John Wiley & Sons, 2
nd
edi-
tion.
Campbell, M. J. (2009). Statistics at Square One. John
Wiley & Sons.
Chen, L. and Ali Babar, M. (2011). A Systematic Review
of Evaluation of Variability Management Approaches
ICE-B 2017 - 14th International Conference on e-Business
106

in Software Product Lines. Information and Software
Technology, 53(4):344–362.
Dillman, D. A., Smyth, J. D., and Christian, L. M. (2008).
Internet, Mail, and Mixed-Mode Surveys: The Tai-
lored Design Method. John Wiley & Sons, 3
rd
edition.
Gehan, E. A. (1965). A Generalized Wilcoxon Test
for Comparing Arbitrarily Singly-Censored Samples.
Biometrika, 52(1-2):203–223.
Hubaux, A., Xiong, Y., and Czarnecki, K. (2011). Configu-
ration Challenges in Linux and eCos: A survey. Tech.
Rep. GSDLAB-TR, University of Waterloo.
K
¨
astner, C., Th
¨
um, T., Saake, G., Feigenspan, J., Leich, T.,
Wielgorz, F., and Apel, S. (2009). FeatureIDE: A tool
framework for feature-oriented software development.
In ICSE, p. 611–614. IEEE.
Khan, A., K
¨
astner, C., K
¨
oppen, V., and Saake, G. (2011a).
Service Variability Patterns. In Variability@ER,
LNCS vol. 6999, p. 130–140. Springer.
Khan, A., K
¨
astner, C., K
¨
oppen, V., and Saake, G. (2011b).
The Pervasive Nature of Variability in SOC. In
FIT’11, p. 69–74. IEEE.
Likert, R. (1932). A Technique for the Measurement of
Attitudes. Archives of Psychology.
Mann, H. B. and Whitney, D. R. (1947). On a Test of
Whether one of Two Random Variables is Stochasti-
cally Larger than the Other. The Annals of Mathemat-
ical Statistics, 18(1):50–60.
Pohl, K., B
¨
ockle, G., and van der Linden, F. (2005). Soft-
ware Product Line Engineering: Foundations, Princi-
ples, and Techniques. Springer.
Posavac, E. (2015). Program Evaluation: Methods and
Case Studies. Taylor & Francis.
Presser, S. and Blair, J. (1994). Survey Pretesting: Do Dif-
ferent Methods Produce Different Results? Sociolog-
ical methodology, p. 73–104.
Presser, S., Couper, M. P., Lessler, J. T., Martin, E., Martin,
J., Rothgeb, J. M., and Singer, E. (2004). Methods
for Testing and Evaluating Survey Questions. Public
Opinion quarterly, 68(1):109–130.
Presser, S., Rothgeb, J. M., and Couper, M. P. (2004). Meth-
ods for Testing and Evaluating Survey Questionnaires.
Wiley-Interscience.
Rothgeb, J. M., Willis, G., and Forsyth, B. (2007). Ques-
tionnaire Pretesting Methods: Do Different Tech-
niques and Different Organizations Produce Simi-
lar Results? Bulletin of sociological methodology,
BMS(96):5–31.
Svahnberg, M., van Gurp, J., and Bosch, J. (2005). A Tax-
onomy of Variability Realization Techniques. Soft-
ware - Practice and Experience, 35(8):705–754.
Vale, T., Figueiredo, G. B., de Almeida, E. S., and
de Lemos Meira, S. R. (2012). A Study on Service
Identification Methods for Software Product Lines. In
SPLC’12, p. 156–163ACM.
Villela, K., Silva, A., Vale, T., and de Almeida, E. S. (2014).
A Survey on Software Variability Management Ap-
proaches. In SPLC ’14, p. 147–156. ACM.
An Evaluation of Variability Mechanisms to Manage Cloud Services
107
