Automatic Selection and Sequencing of Traps for Vibratory Feeders
Simon Mathiesen and Lars-Peter Ellekilde
The Maersk McKinney Moller Institute, University of Southern Denmark, Campusvej 55, 5230 Odense M, Denmark
Keywords:
Automatic Configuration, Dynamic Simulation, Design from Simulation, Parts Feeding, Vibratory Bowl
Feeders.
Abstract:
Vibratory parts feeders with mechanical orienting devices are used extensively in the assembly automation
industry. Even so, the design process is based on trial-and-error approaches and is largely manual. In this
paper, a methodology is presented for automatic design of this type of feeder. The approach uses dynamic
simulation for generating the necessary data for configuring a feeder with a sequence of mechanical orienting
devices called traps, with the goal of reorienting all parts from a random to fixed orientation. Then, a fast
algorithm for facilitating this configuration task automatically is developed from domain specific knowledge.
Finally, the algorithm is validated on three industrial cases and its drawbacks and strengths are discussed in
detail.
1 INTRODUCTION
Parts feeders using vibrations as means of conveying
have been a widely used concept in industrial automa-
tion for decades. This type of feeder comes in two
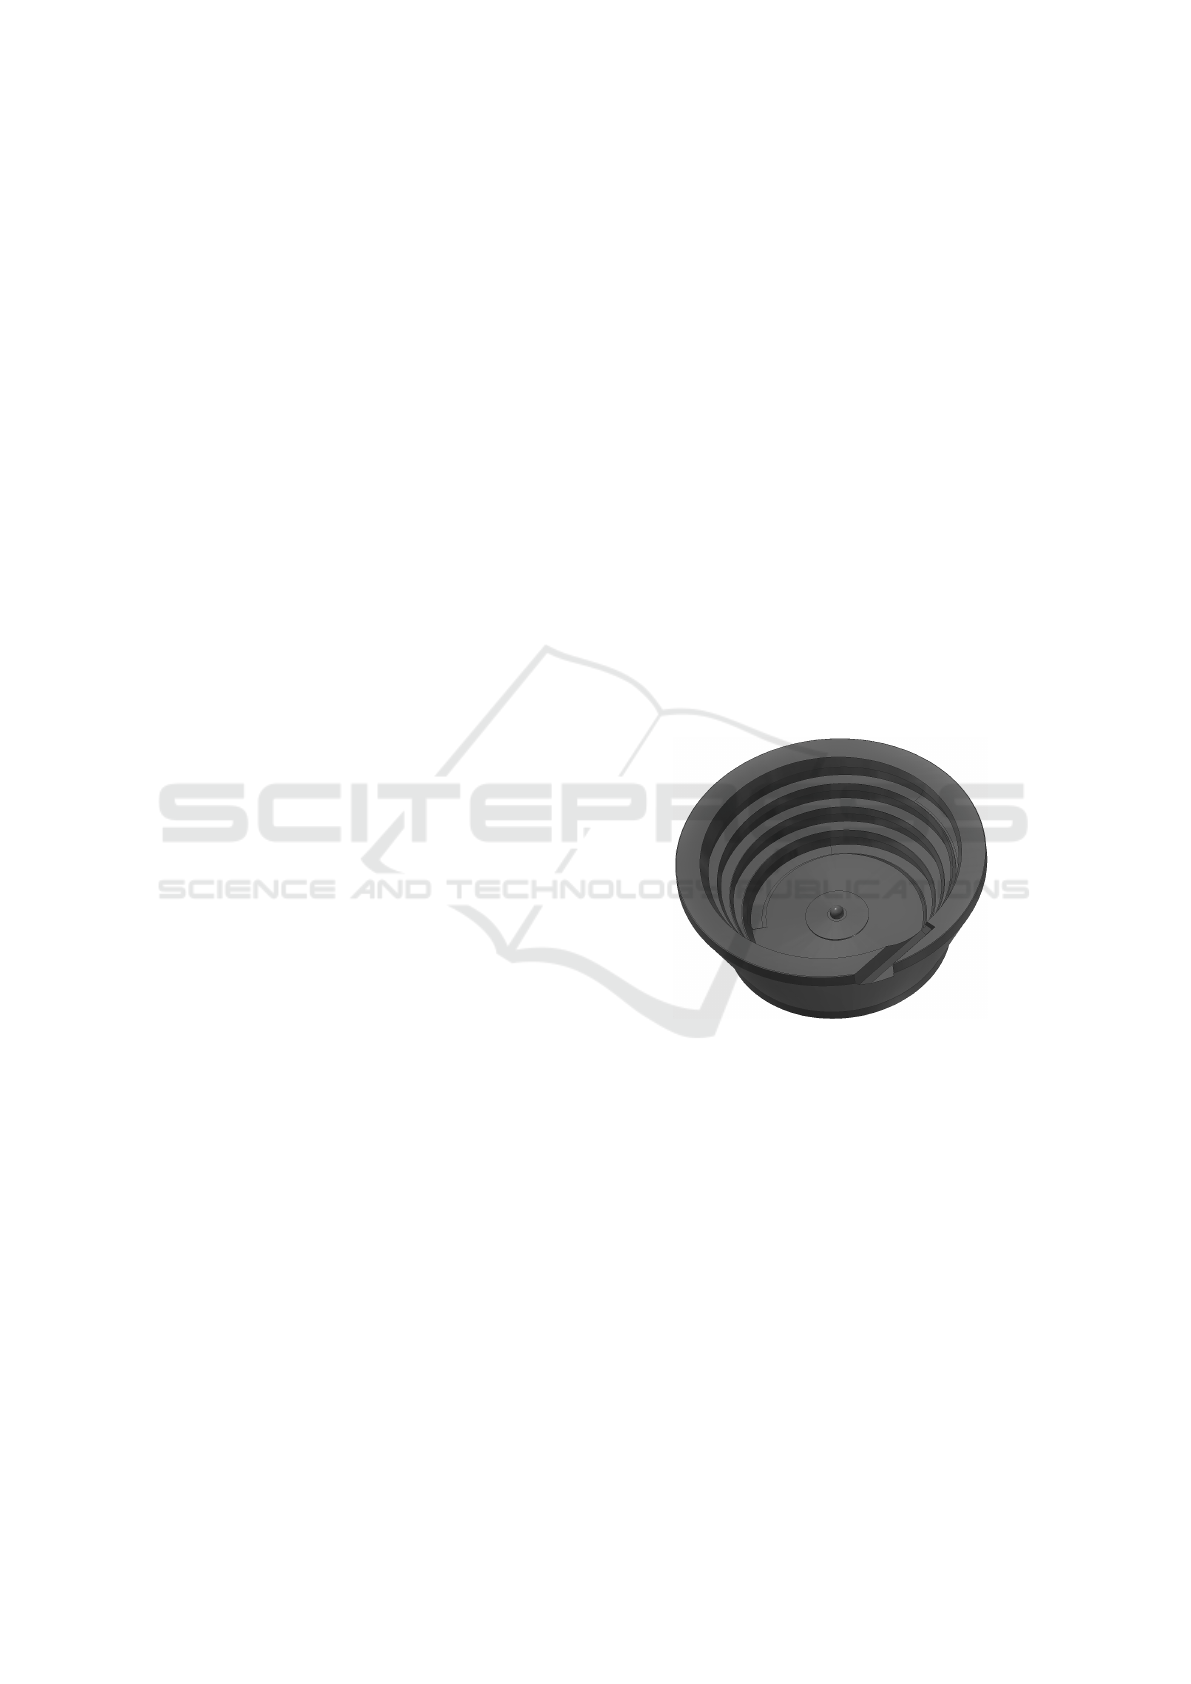
forms being the linear feeder and the bowl feeder (il-
lustrated in Figure 1).
The working principle for the feeders is fairly sim-
ple, using combined vertical and horizontal vibration
to shake parts forward along the either straight or spi-
ral track. On this track the parts encounter mecha-
nisms, so-called traps, that can cause the parts to re-
orient or force wrongly oriented parts off the track.
When used correctly, the effect of these traps are that
all parts reaching the end of the track will have the
same orientation, thereby being ready to be picked or
fed into an automated assembly system.
Although the technology has been readily avail-
able for decades, little has changed in the approach to
designing this feeder type. This task still relies heav-
ily on trial-and-error and is done by skilled techni-
cians, or engineers, combining experiences with sig-
nificant amounts of parameter tuning on the physical
system. Although some part families can be associ-
ated with some standard solution of combining spe-
cific trap mechanisms (such as caps or bolts) a high
degree of customisation is often needed. This fre-
quently result in excessively high prices even for basic
feeding solution due to the cost of the manual labour
put into designing and testing the feeder.
Figure 1: CAD-model of a vibratory bowl feeder.
Researchers have investigated the topic of feeder de-
sign before, but to our knowledge a holistic solution
for automatic design of vibratory feeders is still lack-
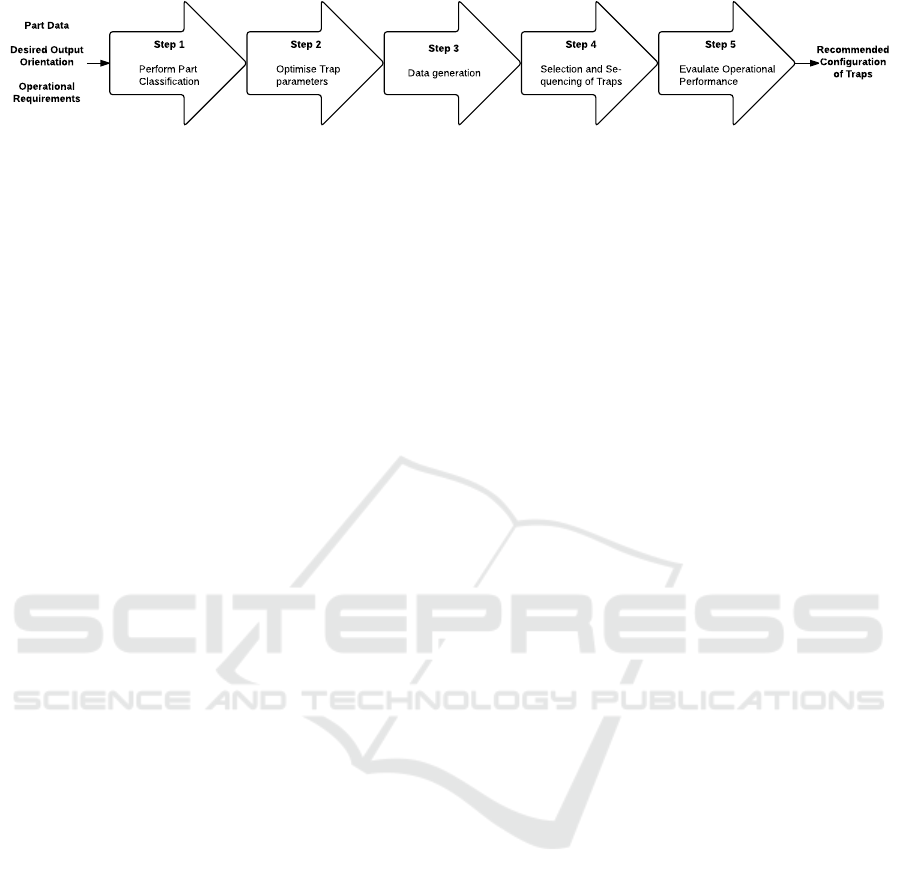
ing. The overall aim of this work is to produce such an
automatic solution, for which a general methodology
is presented in Figure 2.
The proposed method is inspired from (Mathiesen
and Ellekilde, 2016) and (Hansson et al., 2016), but
will not rely on precomputed data for generic object
categories. The four steps in the proposed method are
therefore:
1. Classifying the part to be fed to a family of parts
with the purpose of determining suited trap prin-
ciples.
2. Setting the trap parameters for the specific part
and potentially optimising these using simulation.
Mathiesen, S. and Ellekilde, L-P.
Automatic Selection and Sequencing of Traps for Vibratory Feeders.
DOI: 10.5220/0006440801450154
In Proceedings of the 7th International Conference on Simulation and Modeling Methodologies, Technologies and Applications (SIMULTECH 2017), pages 145-154
ISBN: 978-989-758-265-3
Copyright © 2017 by SCITEPRESS – Science and Technology Publications, Lda. All rights reserved
145
Step 1
Perform Part
Classification
Step 2
Optimise Trap
parameters
Step 4
Selection and Se-
quencing of Traps
Step 5
Evaulate Operational
Performance
Part Data
Desired Output
Orientation
Operational
Requirements
Recommended
Configuration
of Traps
Step 3
Data generation
Figure 2: Design methodology for automatic configuration of vibratory feeders.
3. Producing the behavioural data for traps through
simulation of the part interacting with these traps.
4. Using this data to automatically select the best se-
quence of traps that orients the part.
5. Evaluate the performance of the solution against
requirements (orienting capability, feed rate, etc.).
In this paper we specifically address steps 3 and 4
of automatically finding feeder configurations. Steps
1 and 2 are done according to (Boothroyd, 2005).
The remainder of the paper is structured as fol-
lows: Relevant literature on previous work are re-
viewed in Section 2. Section 3 presents the proposed
approach for generating behavioural data and the al-
gorithm for automatic selection and sequencing of
traps. This is followed by test results in Section 4
and general discussion, conclusion and future work in
Sections 5 and 6.
2 RELATED WORK
The work of (Boothroyd, 2005) is an extensive collec-
tion of work with guidelines for aiding in the design
of vibratory bowl feeders. The work covers the me-
chanics of the vibratory bowl feeder in detail, but also
provides an extensive appendix on part classification
for mapping specific part features (e.g. protrusions,
holes. etc.) to mechanisms potentially utilising those
features to orient the part.
Other researches have also investigated the use of
guidelines to help designers. An expert advisory sys-
tem is presented by (Tan et al., 1995) for the selection
of traps to orient parts. This expert advisor uses data
from a part classification system to provide an user
with suggestions on feasible traps. A similar rule-
based system capable of suggesting traps is presented
by (La Brooy et al., 1995), where relevant part fea-
tures are extracted directly from the CAD-model of
the part, thus eliminating the need for designers to
manually be able to classify the part.
The works described above are based on knowl-
edge obtained from formalised prior experiences and
extensive testing on physical hardware and are useful
to guide the conceptual design of the vibratory feed-
ers. Specifically, the work of (Boothroyd, 2005) also
delivers approximations of how to set the internal
parameters of a number of trap mechanisms to obtain
the desired orienting capabilities. Even so, the only
way to fully validate the performance of a feeder de-
sign is to construct it. Doing this physically is time-
consuming and costly and therefore greatly merits the
use of simulation for prototyping and data acquisition
as discussed in (Mathiesen and Ellekilde, 2016) and
(Hansson et al., 2016).
Using simulation to model and validate designs of
vibratory feeders is not a new concept. (Berkowitz
and Canny, 1996) and (Berkowitz and Canny, 1997)
investigated the interaction between one trap mecha-
nism and two types of parts being cuboids and cylin-
drical. Their work presented an overall consistency
between their prediction in simulation and experi-
ments on a physical test platform, although with some
differences. (Jiang et al., 2003) developed a custom
simulation software for vibratory bowl feeders and
validates the performance of a trap with varying op-
erational parameters for rejecting wrongly oriented
cuboids. In recent work (Stocker and Reinhart, 2016)
the Bullet Physics Engine (Coumans, 2010) is used
to model part behaviour in a vibratory feeder. Here
they investigate the efficiency of a step mechanisms
and the correlation between this efficiency, the height
of the step and the length of the part.
In the literature, simulation has primarily been
used to validate a trap design, with some parameters
manually set by a designer, but in the work by (Hof-
mann et al., 2013) an algorithm is presented for au-
tomatic parameter optimisation of trap mechanisms.
This work also uses dynamic simulation for evalua-
tion of trap performance and, in addition to the geo-
metric shape of the trap, also incorporates the vibra-
tional amplitude into the optimisation. Their optimi-
sation algorithm have been tested with a single step
trap, feeding a cuboid and a cylindrical-like object.
Another approach to optimisation of trap parame-
ters is presented in (Berretty et al., 2001). They de-
veloped an algorithm based on computational geom-
etry for finding good parameter values for four dif-
ferent trap mechanisms. Common for all four traps
is that they work by letting wrongly oriented parts
fall through a gap in the feeding track, but using only
this type of trap, the authors show that their algorithm
can find traps correctly filtering out wrong orientation
of a complex industrial part. A similar approach to
SIMULTECH 2017 - 7th International Conference on Simulation and Modeling Methodologies, Technologies and Applications
146

trap design is found in (Goemans et al., 2006) which
presents an algorithm for finding the parameters for a
trap family of blades.
Automatic optimisation of the parameters of in-
dividual traps has been explored to some degree, but
little work has been done in the automatic selection
and sequencing of these mechanisms beyond the rule-
based suggestion systems listed in the beginning of
this section. This is with the exception of (Chris-
tiansen et al., 1996) who tackles the problem using a
Genetic Algorithm (GA) approach. Their algorithm
finds good feeder designs, but due to the GA ap-
proach optimality is not guaranteed. The input data
for the algorithm is based on results from (Murch and
Boothroyd, 1971) and (Boothroyd, 1992) (earlier ver-
sion of (Boothroyd, 2005)), in the form of several ma-
trices mapping the input orientations to output orien-
tations of a part. In their work (Christiansen et al.,
1996) express plans to augment their approach with
automatic generation of the required input data for the
algorithm, but to our knowledge these plans where ei-
ther not pursued or successful.
3 AUTOMATIC
CONFIGURATION OF
VIBRATORY FEEDERS
Assuming a finite number of possible orientations of a
part on the track, the work of (Murch and Boothroyd,
1971) and (Boothroyd, 2005), presents how the be-
haviour of a trap can be encoded into a stochastic tran-
sition matrix mapping an observed input orientation
distribution to an output distribution. An example of
such a transition matrix is given in (1)
T =
O
1
O
2
... O
N
O
1
P(O
1
|O
1
) P(O
2
|O
1
) . . . P(O
N
|O
1
)
O
2
P(O
1
|O
2
) P(O
2
|O
2
) . . . P(O
N
|O
2
)
.
.
.
.
.
.
.
.
.
.
.
.
.
.
.
O
N
P(O
1
|O
N
) P(O
2
|O
N
) . . . P(O
N
|O
N
)
(1)
where O
i
represents the different orientations and
P(O
j
|O
k
) is the probability of ending in orientation
O
j
given it starts in O
k
.
When multiple traps are placed in sequence the
combined behaviour can be obtained by simple ma-
trix multiplication of the transition matrices. Given
an initial distribution, p
init
, as a row vector, of orien-
tations of the parts on the track and a sequence of M
traps with transition matrices T
i
the output distribution
p
out
can be computed as:
p
out
= p
init
M
∏
i=1
T
i
(2)
Figure 3: To obtain data mapping input orientations to
output orientations parts are simulated conveying from the
Starting area (blue), across the Trap area (grey) to the Tar-
get area (red).
The method is straight forward, but has a problem
with availability of data. Constructing the transition
matrices requires observations on how a part interacts
with a trap. First, for the method to be reliable, a sig-
nificant amount of observations are needed and manu-
ally acquiring the necessary magnitude of data is im-
practical. Secondly, these matrices are highly dedi-
cated to a specific part-trap pair as well as the specific
parameter settings for that trap. Physically building
the traps for orienting a specific part and next observ-
ing the performance of each is hence an infeasible
strategy, thus we suggest the use of dynamic simu-
lation of the vibratory feeder to produce the data effi-
ciently as discussed below.
3.1 Generating the Transition Matrices
In our earlier work (Mathiesen and Ellekilde, 2016),
dynamic simulation of vibratory feeders were anal-
ysed when using the physics engine ODE v0.13
(Smith, 2006) together with the simulation environ-
ment RobWorkSim (Joergensen et al., 2010). Using
the same simulation environment and physics engine,
and knowing the possible orientations of the part, the
transition matrices for a part-trap combination can be
generated automatically.
Figure 3 illustrates a piece of the feeder track with
three marked areas: 1) Starting area (blue), 2) Trap
area (grey), 3) Target area (red). As the name indi-
cates, traps are inserted into the Trap area with the
purpose of interacting with the parts and potentially
reorient or reject them. Any non-rejected part will
reach the target area where its resulting orientation
can be saved. This final orientation of the part is
paired with its initial orientation prior to interacting
with the trap.
The transition matrix is then constructed by
matching the two orientations to the defined set of ori-
entations of the part as follows:
1. If the part is rejected by the trap, increment the re-
jection counter for that starting orientation index.
Automatic Selection and Sequencing of Traps for Vibratory Feeders
147
2. If not rejected, find in the defined set of orienta-
tions the best matching for the the pre- and post-
trap orientations and update the corresponding el-
ement in the transition matrix.
3. Normalise each row together with its correspond-
ing rejection counter (unless all elements in equal
0).
When finding the best matching orientations it is
important to compensate for the rotation of the track,
such that the part orientation is found relative to the
direction of the track.
It is important to note, that not all traps consists of
a transition between two pieces of the original track
type (e.g. a flat track, the a trap and then the same flat
track). An example is the trap consisting of a groove,
which can be used to catch a part by its protrusion.
For this trap to function, the track is tilted at an an-
gle towards the centre of the bowl effectively making
parts, not caught in the groove as intended, slide off
the track. In this case, the tilt angle of the track must
be accounted for in the matching, which should there-
fore not only consider the direction of the track but
also the normal.
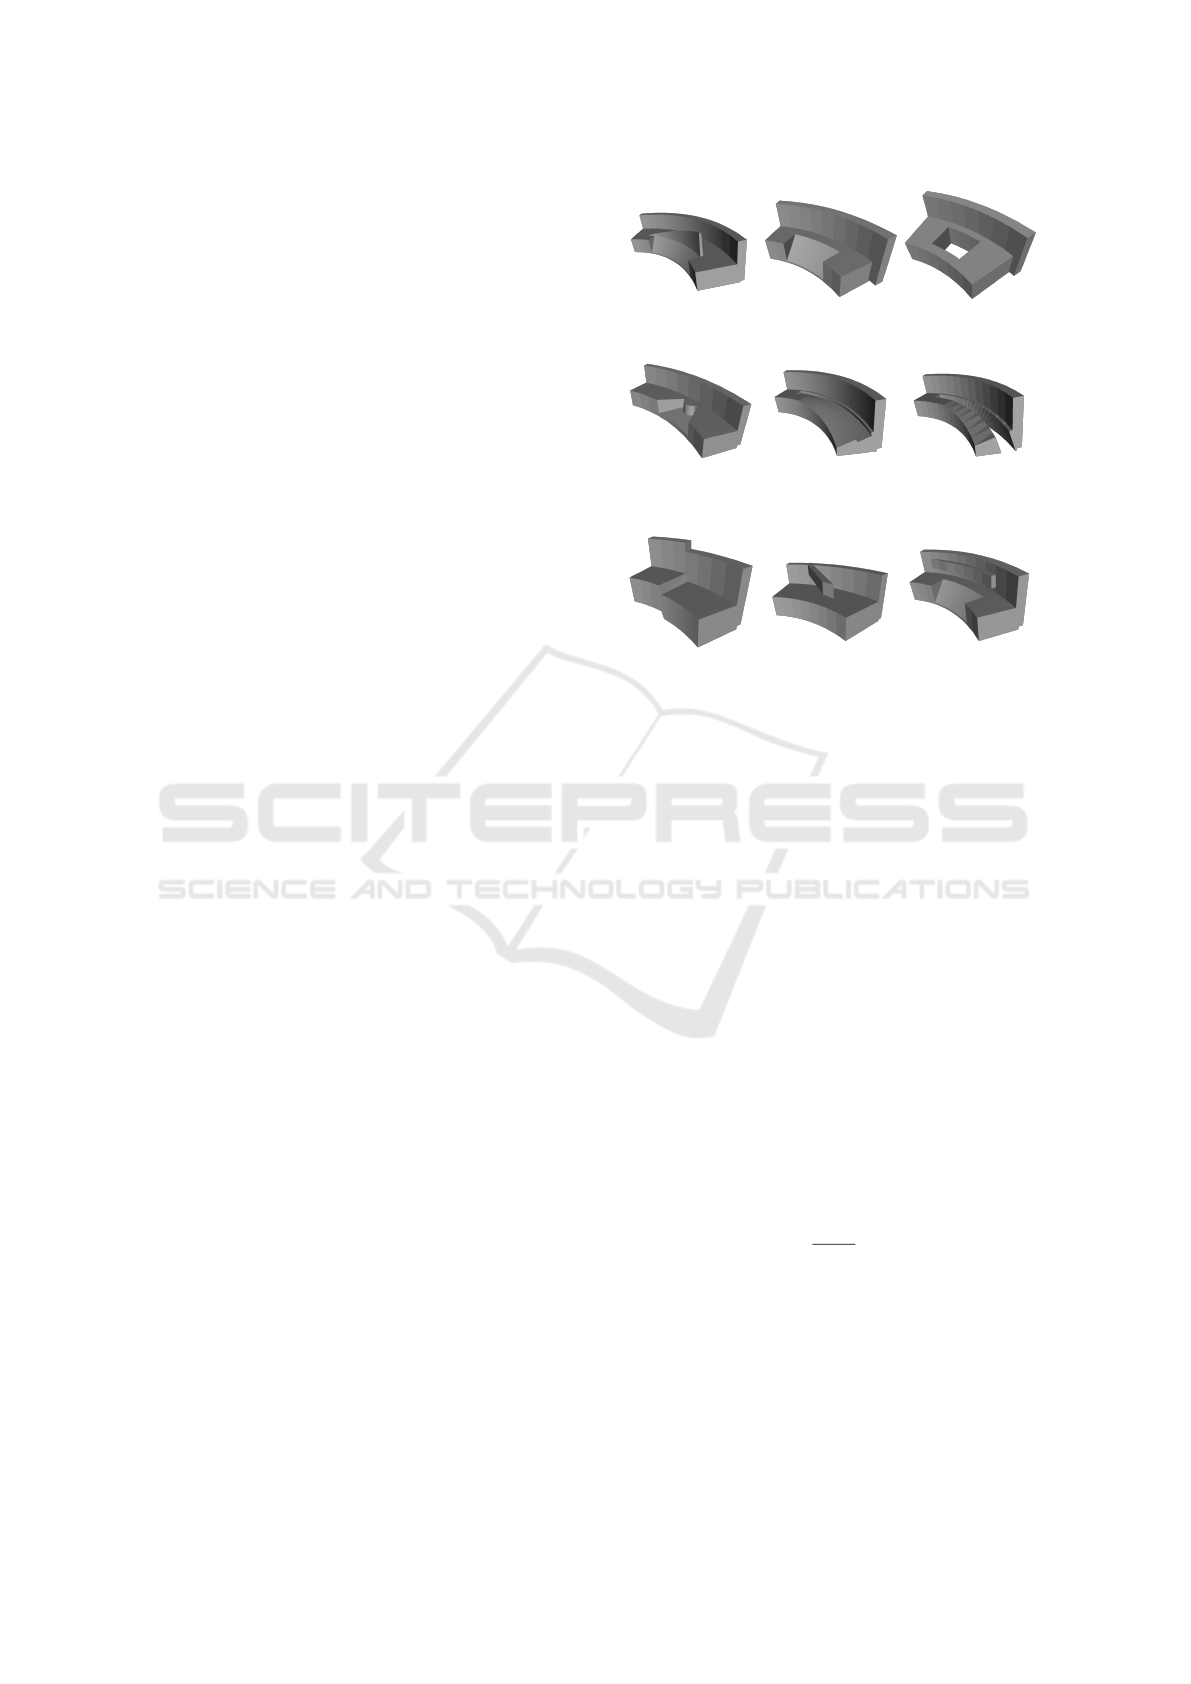
In this work a total of nine trap principles are used.
These are illustrated in Figure 4. The set of nine traps
are chosen to be sufficient for describing the algo-
rithm. The sloped track with groove and the slotted
track are treated as final traps as none of the other
traps can succeed them due to the before mentioned
angling of the track. For convenience, abbreviations
for the traps are listed in the captions.
3.1.1 Dealing with Rotational Symmetry of
Parts
Some parts, like discs and cylinders, are symmetric
around an axis of rotation, which needs to be ac-
counted for in the method for automatically matching
observed orientations. For this a so-called orientation
group is defined to represent a set of orientations only
differing in a rotation around the symmetry axis. A
practical implementation of such a group is as a list
of orientations representing the set, then a match to
the orientation can be found to the best sample within
this set.
3.2 Selecting and Sequencing Traps
The transition matrices allows combining the func-
tionality of the traps into a feeder configuration (se-
quence of traps), thus estimating the functionality of a
specific sequence of traps. The proposed search strat-
egy consists of dynamically constructing a tree, where
each node represents a feeder configuration and has
(a) Edgeriser (Er) (b) Narrowed
track (NT)
(c) Hole (Hl)
(d) Scallop (Sc) (e) Sloped track
with groove (Sp,
Final)
(f) Slotted track
(Sl, Final)
(g) Step (St) (h) Wiper blade
(WB)
(i) Wall projection
w. NT (WP)
Figure 4: All nine trap principles used in this work. Listed
with abbreviations for further reference and marking of ”Fi-
nal” to indicate a final trap.
an associated output distribution of orientations en-
coded as a row-vector p
out
and a rejection rate p
r
. For
the root the distribution will be the expected initial
distribution of parts on the track and the rejection rate
will be 0. Edges in the tree now represents different
traps and when branching to a new node, the transi-
tion matrix of the trap is post-multiplied on the distri-
bution vector of the parent, given the expected output
distribution for the child.
p
out,child
= p
out,parent
T
trap
(3)
The probability of rejection can be obtained from
p
out
by (4).
p
r
= 1 −
∑
p
out
(4)
(5)
A quality score, Q, of the configuration can now be
calculated using (7):
ˆp
out
=
p
out
|p
out
|
(6)
Q = (1 − p
r
)p
CO
(7)
where p
CO
corresponds to the correctly oriented parts
within ˆp
out
. The best quality which can be achieved
is Q = 1 and is when all parts are oriented correctly
and no parts are rejected in the process.
In many cases it can be an advantage to not look
for a specific orientation, but see which orientation
SIMULTECH 2017 - 7th International Conference on Simulation and Modeling Methodologies, Technologies and Applications
148

gives the most efficient output. In this case p
CO
in (7)
can be replaced by max( ˆp
out
).
The algorithm described above is essentially a
non-informed exhaustive search strategy and com-
plexity scales exponentially with the length of the se-
quence of traps. In general, a feeder configuration
is not limited to contain just a single instance of a
trap. This is because of some traps having probabilis-
tic behaviour. This means, that a trap can map one
input orientation to multiple output orientations with
different probabilities, e.g. a Step where parts can
end in multiple orientations, but with a potential bias
based on their shape and distribution of mass. In these
cases, repeating the same trap multiple times could be
needed for reducing the probability of an undesired
orientation. Therefore, the maximum allowed search
depth, M, must be bounded to some finite value for the
algorithm to terminate. Furthermore, the amount of
different traps, N, which can be applied to orient the
part also impact search time for the algorithm. The ac-
tual size of the tree, T , to explore for finding a feeder
configuration is therefore given by (8):
|T | =
M
∑
j=1
N
j
(8)
Searching through all possibilities will have an ex-
ponential and infeasible running time. However, by
realising that a solution can never achieve a higher
quality score than its probability of rejecting the part,
branches of the tree can efficiently be pruned away.
This is done by comparing the (1 − p
r
) value for a
node with the quality of the currently known best so-
lution. In the pseudocode of Algorithm 1 this is im-
plemented by not adding the non-promising node to
the queue where non-evaluated nodes are held. Fur-
thermore, the same check is made after a node is
taken from that queue as it could potentially have been
added before the current best solution was found. The
queue is implemented as a priority queue always hav-
ing the element with highest Q as the first element.
In addition to this branch closing strategy, an upper
bound for p
r
can be given to the algorithm to disre-
gard solutions rejecting too many parts to be feasible.
All sub-branches to a trap designated as final traps
are also closed as no trap can follow. The purpose
of a feeder configuration is to fully orient a part by
forcing the probability of an orientation to 1. Since
the data used for testing the algorithm in Section 4 is
made from traps with hand-tuned parameter-sets they
may not work optimally, hence feeder configurations
that nearly does full orientation can well be applica-
ble in a real world scenario. Therefore a margin for
treating a feeder configuration as a correct solution is
introduced.
Algorithm 1 Algorithm for finding suitable feeder
configurations for orienting parts.
// Initial state: Empty queue, q, for containing
nodes and empty list, c, for feeder configurations
add(root) to q // dummy node with Q = 0
while q 6=
/
0 do
node
cur
= best(q) // max(Q)
if depth(node
cur
) < M then
for each child node k do
Using (2) compute p
out
p
r
= 1 − sum(p
out
)
ˆp
out
=
p
out
|p
out
|
// normalise p
out
p
CO
= ˆp
out,desired
or max( ˆp
out
)
Q = (1 − p
r
) p
CO
if p
CO
≥ m
c
then
add(k) to c
end if
if (1 − p
r
) > Q
best
then
if p
r
< p
r,max
then
add(k) to q
end if
end if
end for
end if
end while
Return c
The final algorithm has three parameters that ef-
fects the result:
1. Margin for correct solution, m
c
.
2. Maximum allowed probability of rejection, p
r,max
.
3. Maximum search depth, M.
The maximum allowed p
r
should be set accord-
ing to specification from the surrounding system on
required feed rate based on possible conveying speed
for parts in the feeder. The max search depth must
also be set according to limitations on the physical
dimensions of the feeder, i.e. larger bowl diameter
makes room for more traps.
The final algorithm is presented in Algorithm 1,
where ˆp
out,desired
refers to the desired index of ˆq
out
when searching for a specific solution.
4 RESULTS
The algorithm described in the previous section has
been used to plan sequences of traps for the parts
shown in Figure 5.
Some trap principles are only applicable to certain
geometric features or dimension ratios, e.g a sloped
Automatic Selection and Sequencing of Traps for Vibratory Feeders
149
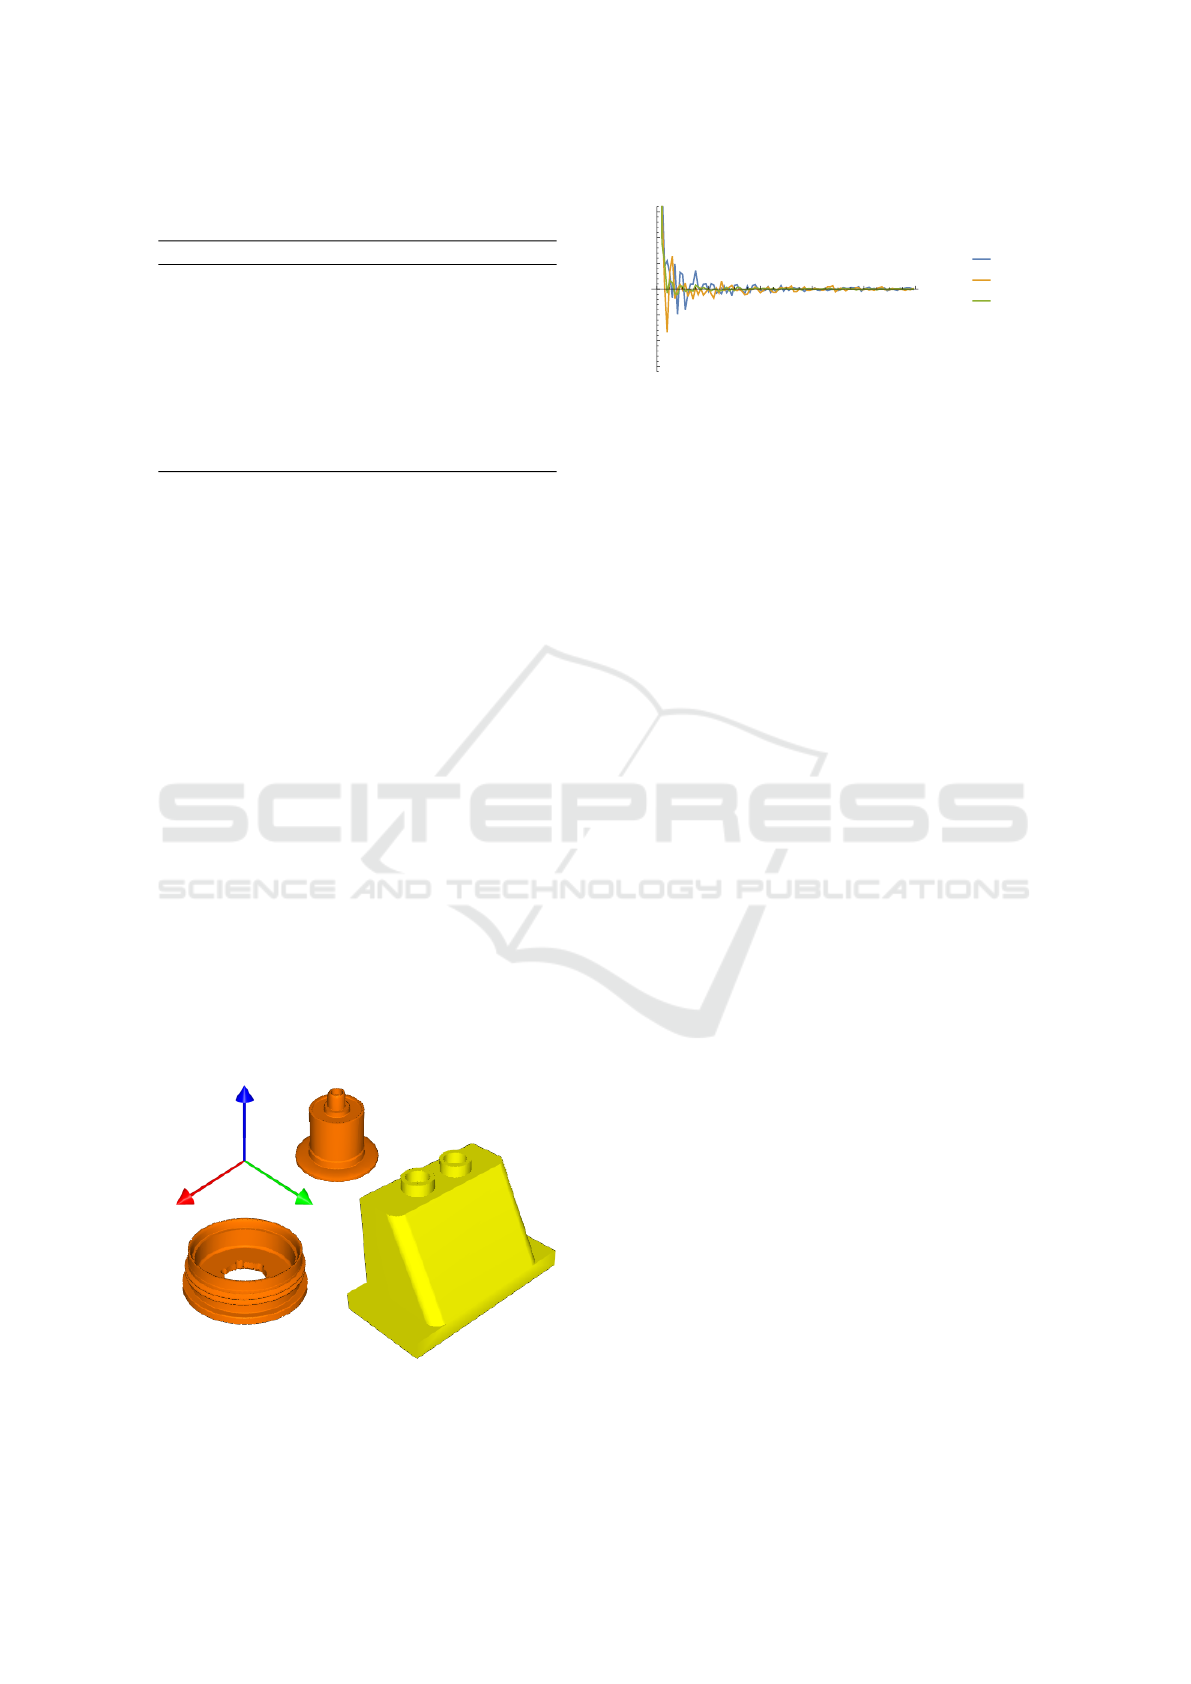
Table 1: List of the nine traps marking, with ”x”, which
were used for each part.
Trap name Cap Cone Brick
Edge riser - - x
Narrowed track - x x
Hole - - x
Scallop x - -
Sloped track w. groove x x x
Slotted track - x x
Step x x x
Wall projection w. NT x x x
Wiper blade - - x
track with a groove will not work if the part has no
protrusion that can be caught in that groove. There-
fore, data for interaction between the three parts and
the traps has only been made for a subset of the nine
traps, as listed in Table 1.
4.1 Stability Analysis of the Transition
Matrices
The proposed approach relies on accurate estimation
of the probabilities that make up the transition matri-
ces, recall (1). To investigate how many samples are
needed for this estimation to become stable, 10,000
simulations have been run for the three parts and all
of their associated traps. The effect of the trap is then
determined using (2), effectively resulting in the out-
put probability distribution vectors, p
out,i
, computed
from T
i
, where i refers to the number of samples used
to create that transition matrix. We then calculate the
difference between the current estimate and the previ-
ous using (9),
∆
i
= p
out,i
− p
out,i−100
(9)
Figure 5: The three parts used as cases for this work. From
left to right: Cap, Cone and Brick. Parts are shown in pro-
portion. For reference the coordinate system is oriented as
shown with origin in the centre of gravity of each part.
2000 4000 6000 8000 10 000
Samples
-0.015
-0.010
-0.005
0.005
0.010
0.015
Difference
Cap
Cone
Brick
Figure 6: Convergence of the transition matrices for the
three parts. The horizontal axis shows the number of sam-
ples used and the vertical the change in the output distribu-
tion, given in probability from 0 − 1.
where ∆
i
is computed for i = 100, 200, . . . , 10, 000
in steps of 100. For the three parts, we then
take the mean (∆
i
) across all traps and plotted as
{i, mean(∆
i
)} in Figure 6.
For low values of i, ∆
i
is large, thus the view in
Figure 6 is zoomed to the appropriate level of detail.
From the graph it can be seen that ∆
i
for all three parts
converges to near zero values fast, but with the Cap
and Cone both showing oscillating behaviour. This
is also the case for the Brick, but with less ampli-
tude. The result gradually becomes more stable, and
at 4000 samples ∆
i
< 0.001 for all parts, indicating
that less than 1h of the samples will change their out-
put orientation.
4.2 Orienting the Parts
The algorithm finds the feeder configurations listed in
Table 2 for the three cases. For all results shown in
the table the parameters of the algorithm were set as
follows: m
c
= 0.95, p
r,max
= 0.9, M = 5.
Recall p
CO
, was the estimated probability of correctly
orienting the part, p
r
the probability of rejection and
Q the quality score computed by (7). The results
show, that the Cap can be oriented using a Scallop
trap after a Step trap, which changes the probability
towards an orientation that can pass the scallop (the
orientation shown in Figure 5). For the Cone part, the
found configuration consists of four steps and finally
a narrowed track with a wall projection rejecting all
Cone parts not in the upright orientation labelled O
0
in Figure 11, showing the most occurring orientations
of the Cone. Using the algorithm, feeder configura-
tions are also found for the Brick. The best solution
uses a fairly involved sequence of traps to orient the
part. The probability distribution after each trap is
shown in Figure 7 and the dominant orientations of
the Brick illustrated in Figure 8. It should be noted
that a total of 24 distinct, and stable, orientations of
the Brick has been observed in simulation.
First the steps pushes the distribution of prob-
SIMULTECH 2017 - 7th International Conference on Simulation and Modeling Methodologies, Technologies and Applications
150
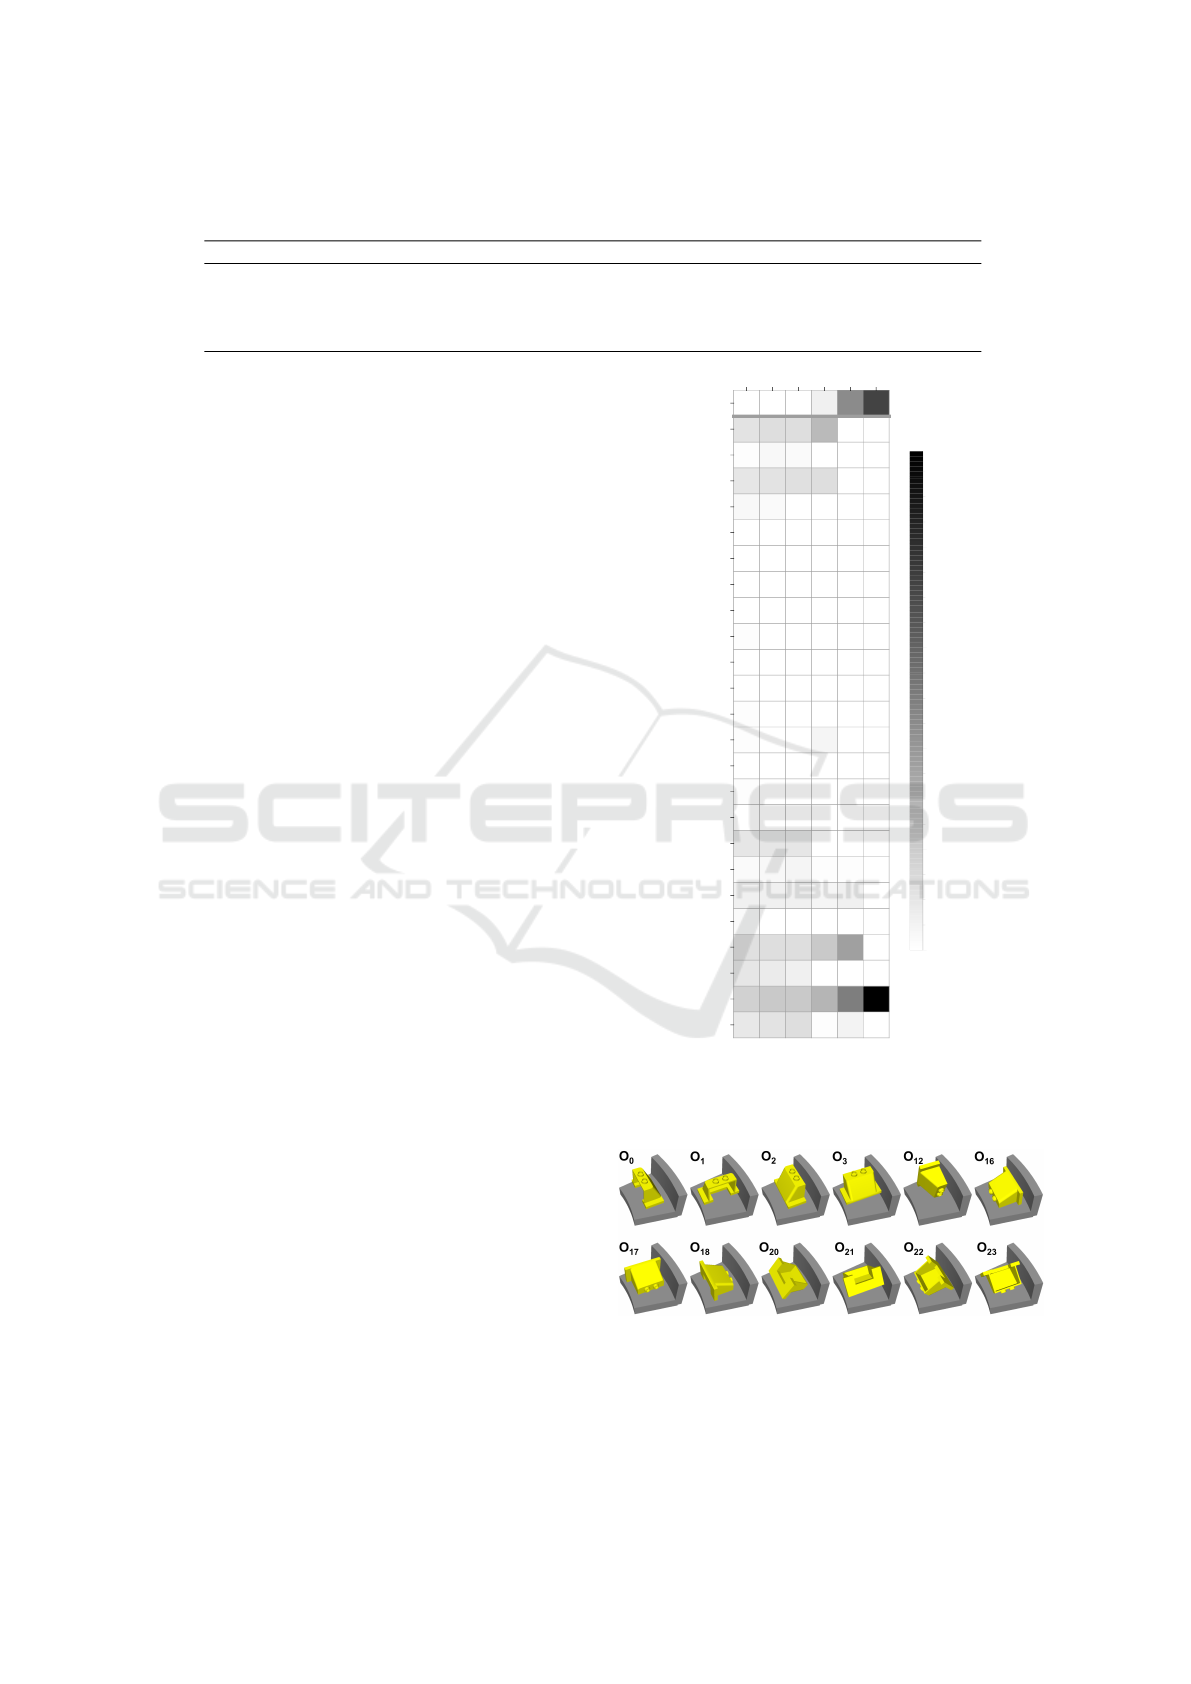
Table 2: The four feeder configurations found by the algorithm. ”Evals.” denotes the number evaluations made by the
algorithm and ”Found i.” the evaluation step that configuration was found in.
Part Feeder config. p
CO
p
r
Q Evals. Found i. Time[s]
1 Cap St → Sc 0.99 0.29 0.70 28 4 0.002
2 Cone St → St → St → St → W P 0.99 0.55 0.45 95 24 0.008
3 Brick St → St → Er → W B → NT 0.99 0.73 0.26 4671 1235 0.379
4 Brick St → Er → St → Er → W P 1.00 0.88 0.12 7731 817 0.631
ability towards the most stable orientations. The
Edgeriser trap attempts to raise the Brick resulting in
an increase in O
0
and O
12
. The Edgeriser is not suc-
cessful in raising all parts and some are reoriented to
O
22
. All parts resting in the upright orientation (O
0
,
O
1
, etc.) are then rejected by the Wiper blade. This
leaves Bricks lying down as O
18
, O
20
− O
23
, but due
to the centre of gravity of the Brick, the Narrowed
track can then reject all other orientations than O
22
.
Forcing the algorithm to search for specific ori-
entations, an alternative feeder configuration is found
for the Brick that orients it to O
0
. This configuration
scores a lower quality due to higher probability of re-
jection. Feeder configuration 1,2 and 3 only achieve a
score for correct orientation of the part of 0.99. This
is due to the hand-tuning of the trap parameters men-
tioned in Section 3.
4.3 Informed vs. Non-informed Search
To show the difference between using the presented
informed search compared to an exhaustive strategy
the number of required evaluations needs to be con-
sidered. Figure 9 shows a logarithmic plot of the
number of evaluations for the three cases, when using
the informed strategy (denoted I and shown with solid
lines) reducing the search space compared to the ex-
haustive strategy (denoted NI and shown with dashed
lines). Both the informed and exhaustive strategy in-
cluding the concept of final traps.
It can be seen in Figure 9, that the informed search
strategy improves the number of evaluations required
by several orders of magnitude. For both the Cap and
Cone part, the savings with the informed method is
around a factor of 10
4
. For the Brick part, the relative
difference is lower, but still around a factor of 10
2
. Al-
though the graphs indicate a sub-exponential runtime
for the informed search, we have no formal proof and
in worst-case it may still require exponential run time.
4.4 Repeating Traps
In the work of (Christiansen et al., 1996) they report a
feeder configuration consisting of eight repetitions of
a Pressure break trap (not used in this work), a Wiper
blade and a Slotted track. Our algorithm finds a simi-
lar repetitive sequence for the Cone part with multiple
p
r
O
0
O
1
O
2
O
3
O
4
O
5
O
6
O
7
O
8
O
9
O
10
O
11
O
12
O
13
O
14
O
15
O
16
O
17
O
18
O
19
O
20
O
21
O
22
O
23
ID St St Er WB NT
0
0.2
0.4
0.6
0.8
Figure 7: Step wise probability of orientations for feeder
configuration 3. All O
x
are the orientations and p
r
the prob-
ability of rejection. ”ID” denotes the initial probability dis-
tribution of orientations before any traps.
Figure 8: Illustration showing the dominant orientations
and when these are effected by the traps of feeder config-
uration 3.
Step traps in succession. The result of applying each
trap is illustrated in Figure 10, where the seven dis-
Automatic Selection and Sequencing of Traps for Vibratory Feeders
151
●
●
●
● ● ● ● ● ●
●
■
■
■
■
■
■
■
■
■
■
◆
◆
◆
◆
◆
◆
◆
◆
◆
◆
▲
▲
▲
▲
▲
▲
▲
▲
▲
▲
▼
▼
▼
▼
▼
▼
▼
▼
▼
▼
○
○
○
○
○
○
○
○
○
○
2 4 6 8 10
SearchDepth
10
1000
10
5
10
7
Evaluations
●
Cap, I
■
Cone, I
◆
Brick, I
▲
Cap, NI
▼
Cone, NI
○
Brick, NI
Figure 9: Run data for the search algorithm with varying
max search depth, comparing the amount of evaluations
made by the informed search vs the a non-informed, shown
on a logarithmic scale.
p
r
O
0
O
1
O
2
O
3
O
4
O
5
O
6
ID St St St St WP
0
0.2
0.4
0.6
0.8
1.0
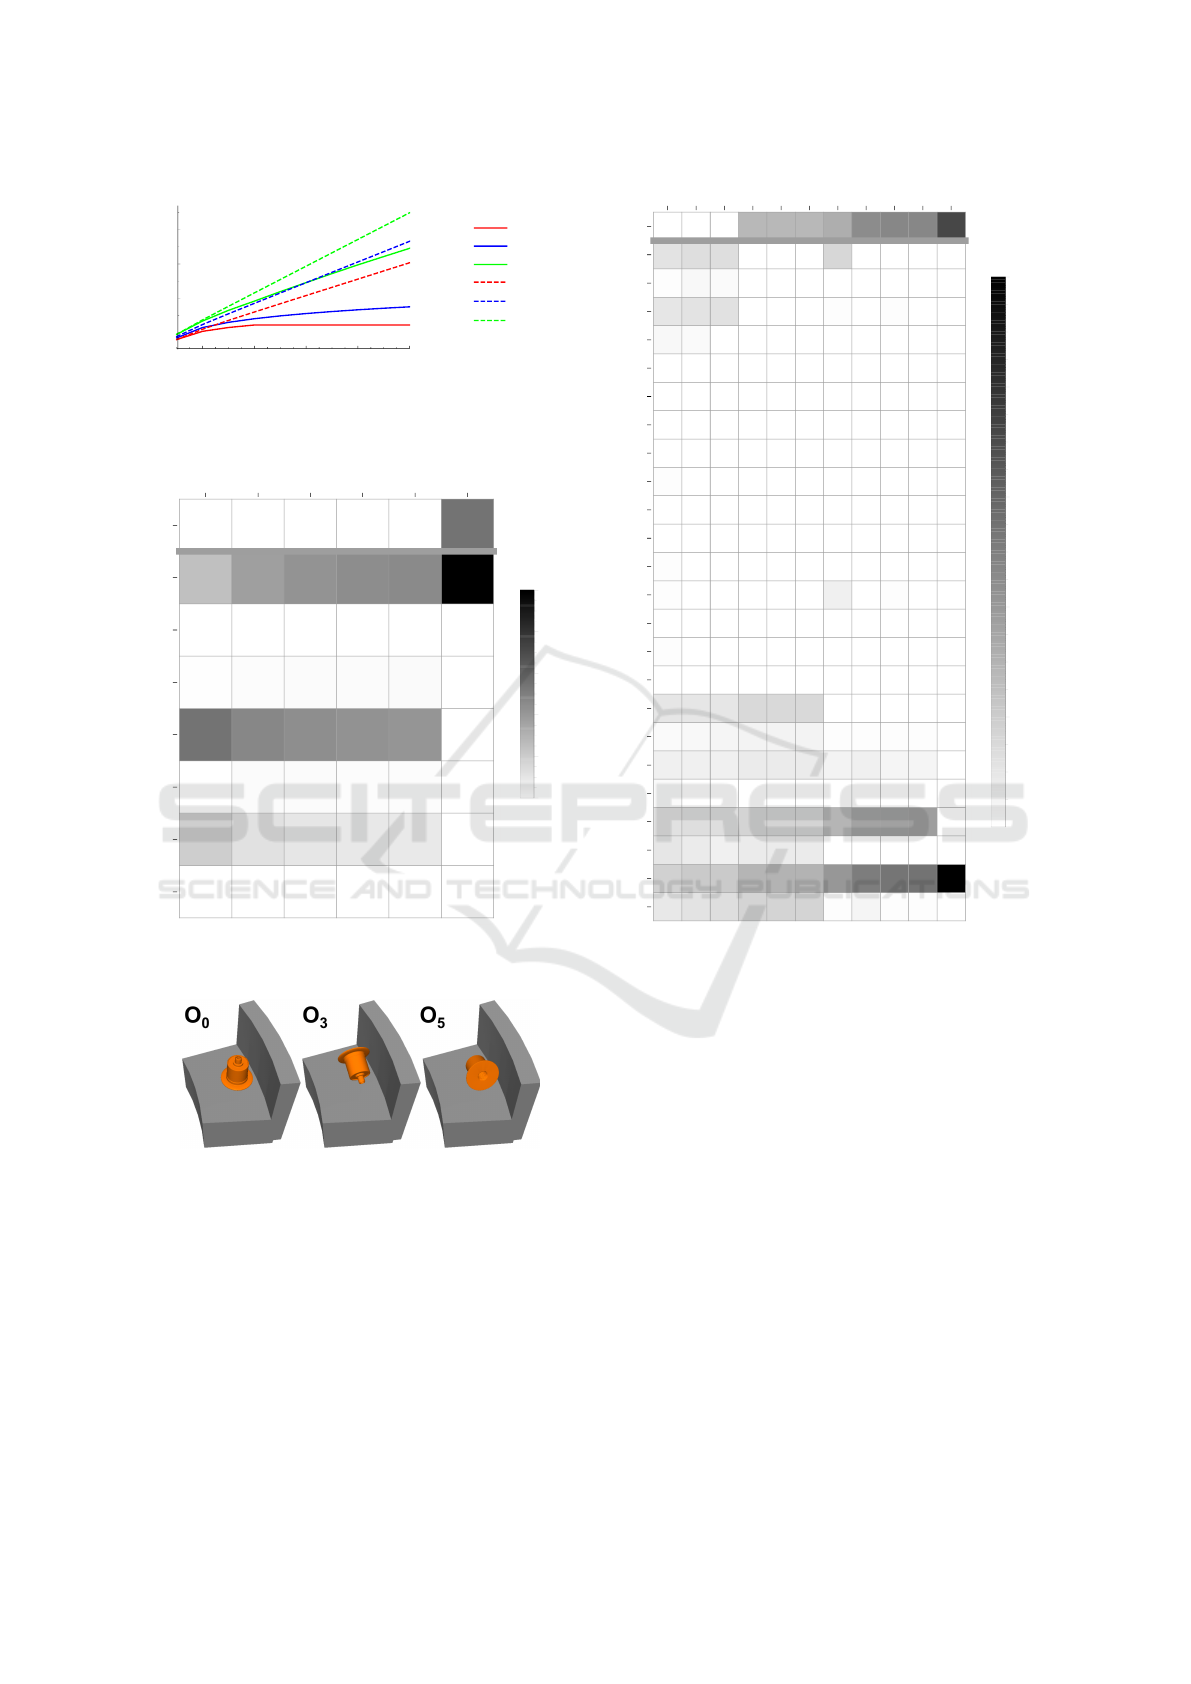
Figure 10: Step wise probability of orientations for feeder
configuration 2.
Figure 11: The three most frequent orientations of the Cone
part.
tinct orientations of the Cone is visualized with the
probability of occurrence shown as a grey-scale from
white P(0
i
) = 0 to black P(O
i
) = 1. The three most
frequent orientations are shown in Figure 11.
The figure show that the repetition of the Step trap
moves the probability for orientation O
3
and O
5
to-
wards O
0
in steps of ≈ {0.13, 0.05, 0.02, 0.01}. In-
creasing M for the algorithm allows it to add more
Step traps with, for each, a diminishing effect. For
comparison, the improvement between configuration
p
r
O
0
O
1
O
2
O
3
O
4
O
5
O
6
O
7
O
8
O
9
O
10
O
11
O
12
O
13
O
14
O
15
O
16
O
17
O
18
O
19
O
20
O
21
O
22
O
23
ID St St WB WB WB Er WB Er WB NT
0
0.2
0.4
0.6
0.8
1.0
Figure 12: Step wise probability of orientations for best
feeder configuration found for the Brick part when sequence
length M = 10.
2 in Table 2 (where M = 5) to the configuration found
for M = 10 is just 0.02 for the quality Q due to a sim-
ilar decrease of p
r
. The effect of this is even clearer
for the result shown in Figure 12. This figure show
the step-wise results for the best feeder configuration
the algorithm finds for the Brick part, allowing a max
search depth of M = 10.
The result is similar to the feeder configuration
for M = 5, but includes an extra Step trap, another
Er → W B sequence and three extra Wiper blades. Al-
though the solution is valid from the perspective of
the algorithm there is actually very little improvement
over configuration 3 previously listed in Table 2. This
new configuration scores a Q = 0.28 (0.02 higher)
due to a 0.01 decrease in p
r
. Looking at Figure 12
and the consecutive three Wiper blades, only the first
makes real changes to the probability distribution of
the 24 orientations. This is also the case for the first
SIMULTECH 2017 - 7th International Conference on Simulation and Modeling Methodologies, Technologies and Applications
152

Er → W B sequence, where the impact of the second
sequence is insignificant. Running this test with the
dataset used in (Christiansen et al., 1996), confirms
the validity of their result, but also shows that the
before mentioned sequence of consecutive Pressure
break traps have close to zero impact on the result af-
ter the fourth repetition of the trap.
5 DISCUSSION AND FUTURE
WORK
The results presented in Section 4 show that the al-
gorithm automatically finds feeder configurations that
orients the three parts used as cases. The solutions
found are optimal for the given input data, but the
quality of these feeder configuration also relies com-
pletely on behavioural data. Finding better solutions
for orienting the three parts would therefore require
either the traps being tuned to optimal performance or
more trap principles capable of reorienting the parts to
other orientations. Regarding the latter, this could es-
pecially be an advantage for the Brick, which is well
suited for orientation using the Slotted track trap, but
has very little probability of entering that trap in the
required input orientation for it to work.
The margin for considering a part fully oriented,
m
c
, should ideally be set to 1 (as discussed), but for
the test it was set m
c
= 0.95. This could potentially
have resulted in the algorithm returning solutions with
worse orienting capabilities (p
CO
score), than the ones
presented in Table 2, but scoring a higher quality due
to lower p
r
. Setting this parameter for the algorithm
should therefore be governed by some knowledge on
the optimality of the traps used in the search and the
closer the traps are to being optimal the smaller the
need will be for decreasing m
c
.
In Section 4.4 it was shown that the algorithm uses
time exploring branches of the solution tree that offers
improvement of insignificant magnitude. This is to be
expected and dealing with this appropriately would
lead to further reduction in search times. A simple
way of doing this could be to impose a lower bound
for changes in quality, but that raises the question of
where the threshold for significant improvement lies.
In the future we intend to explore this problem fur-
ther and pursue improving the algorithm by looking
for heuristics guiding the search towards good feeder
configurations faster, as well other, more aggressive,
branch termination strategies.
In the current state our method for generating data
is unable to identify stacking parts. This is a prob-
lem occurring frequently in this type of feeding sys-
tem and should be taken into account when designing
the feeder. This becomes and issue as our method as-
sumes that parts are singulated when generating data
and therefore only simulated one part interacting with
the trap at a given time. Simulating just a single part
in the feeder also does not model the effects of parts
pushing on each other, potentially introducing parts
being conveyed in other orientations than expected.
Future work should be directed at efficiently simulat-
ing multiple parts interacting with each other as well
as the feeder.
Finally we are in the process of validating the de-
signs found using the algorithm with real world tests.
6 CONCLUSION
In this paper we have outlined a framework for auto-
matic design of vibratory feeders and presented con-
crete methods for automatically encoding behavioural
data and the subsequently selection and sequenc-
ing of traps for orienting parts in a vibratory parts
feeder. The behavioural data are generated using dy-
namic simulation and encoded into transition matri-
ces known from prior literature. The selection and se-
quencing method is an informed search strategy that
efficiently reduces the computation time making the
otherwise hard combinatorial problem manageable.
To test the presented methods nine different trap types
have been implemented and behavioural data gener-
ated for three different parts together with an analysis
on how many samples are required for a stable esti-
mate of the transition matrices. The resulting designs
has been further analysed and properties of the solu-
tions are discussed.
ACKNOWLEDGEMENTS
This work was supported by The Danish Innovation
Foundation through the strategic platform MADE-
Platform for Future Production.
REFERENCES
Berkowitz, D. R. and Canny, J. (1996). Designing parts
feeders using dynamic simulation. In Robotics and
Automation, 1996. Proceedings., 1996 IEEE Interna-
tional Conference on, volume 2, pages 1127–1132
vol.2.
Berkowitz, D. R. and Canny, J. (1997). A comparison of
real and simulated designs for vibratory parts feed-
ing. In Robotics and Automation, 1997. Proceedings.,
1997 IEEE International Conference on, volume 3,
pages 2377–2382. IEEE.
Automatic Selection and Sequencing of Traps for Vibratory Feeders
153

Berretty, R.-P., Goldberg, K. e., Overmars, M. H., and
van der Stappen, A. F. (2001). Trap design for vi-
bratory bowl feeders. The International Journal of
Robotics Research, 20(11):891–908.
Boothroyd, G. (1992). Assembly Automation and Product
Design. Marcel Dekker Inc., NY.
Boothroyd, G. (2005). Assembly Automation and Product
Design. CRC Press, 2nd ed. edition.
Christiansen, A. D., Edwards, A. D., and Coello, C. A. C.
(1996). Automated design of part feeders using a ge-
netic algorithm. In Robotics and Automation, 1996.
Proceedings., 1996 IEEE International Conference
on, volume 1, pages 846–851. IEEE.
Coumans, E. (2010). Bullet physics engine. Open Source
Software: http://bulletphysics.org, 1.
Goemans, O. C., Goldberg, K., and van der Stappen, A. F.
(2006). Blades: a new class of geometric primi-
tives for feeding 3d parts on vibratory tracks. In
Proceedings 2006 IEEE International Conference on
Robotics and Automation, 2006. ICRA 2006., pages
1730–1736. IEEE.
Hansson, M. N., Mathiesen, S., Ellekilde, L.-P., and Mad-
sen, O. (2016). Configuration system for simulation
based design of vibratory bowl feeders. In Simulation,
Modeling, and Programming for Autonomous Robots
(SIMPAR), IEEE International Conference on, pages
147–154. IEEE.
Hofmann, D., Huang, H., and Reinhart, G. (2013). Auto-
mated shape optimization of orienting devices for vi-
bratory bowl feeders. Journal of Manufacturing Sci-
ence and Engineering, 135(5).
Jiang, M. H., Chua, P. S. K., and Tan, F. L. (2003). Sim-
ulation software for parts feeding in a vibratory bowl
feeder. International Journal of Production Research,
41(9):2037–2055.
Joergensen, J. A., Ellekilde, L.-P., and Petersen, H. G.
(2010). Robworksim - an open simulator for sensor
based grasping. In Robotics (ISR), 2010 41st Interna-
tional Symposium on and 2010 6th German Confer-
ence on Robotics (ROBOTIK), pages 1–8. VDE.
La Brooy, R., Jiang, C., Chan, P., et al. (1995). Design of an
expert system for automatic high-speed parts feeding.
In Sixth International Conference on Manufacturing
Engineering: Manufacturing; a Global Perspective;
Proceedings, The, page 359. Institution of Engineers,
Australia.
Mathiesen, S. and Ellekilde, L.-P. (2016). Configuration
and validation of dynamic simulation for design of vi-
bratory bowl feeders. In 2016 12th IEEE International
Conference on Control and Automation (ICCA), pages
485–492. IEEE.
Murch, L. and Boothroyd, G. (1971). Predicting efficiency
of parts orienting systems. Autom, 18:55–57.
Smith, R. (2006). Open dynamics engine. Accessed: 10-
05-2017, http://ode.org/ode-latest-userguide.pdf.
Stocker, C. and Reinhart, G. (2016). Sensitivity analysis of
the dynamic behavior of transported material in vibra-
tory bowl feeders using physics simulation. Applied
Mechanics & Materials, 840.
Tan, P., Ngoi, B., Lee, S., and Lim, L. (1995). A knowledge-
based advisor for the automatic selection and sequenc-
ing of orienting devices for vibratory feeding. Engi-
neering Applications of Artificial Intelligence, 8(1):1
– 13.
SIMULTECH 2017 - 7th International Conference on Simulation and Modeling Methodologies, Technologies and Applications
154
