
A Collaborative Environment for Web Crawling and Web Data Analysis
in ENEAGRID
Giuseppe Santomauro
1
, Giovanni Ponti
1
, Fiorenzo Ambrosino
1
, Giovanni Bracco
2
,
Antonio Colavincenzo
1
, Matteo De Rosa
3
, Agostino Funel
1
, Dante Giammattei
3
,
Guido Guarnieri
1
and Silvio Migliori
4
1
ENEA - C.R. Portici, DTE-ICT-HPC, P.le E. Fermi, 1 - 80055 Portici, NA, Italy
2
ENEA - C.R. Frascati, DTE-ICT-HPC, Via E. Fermi, 45 - 00040 Frascati, Roma, Italy
3
ENEA - C.R. Portici, DTE-ICT-RETE, P.le E. Fermi, 1 - 80055 Portici, NA, Italy
4
ENEA - Sede Legale, DTE-ICT, Lungotevere Thaon di Revel, 76 - 00196 Roma, Italy
Keywords:
Web Crawling, Big Data, Text Data, Data Mining, Networking.
Abstract:
In this document we provide an overview on the development and the integration in ENEAGRID of some tools
able to download data from Web (Web Crawling), manage and display a large amount of data (Big Data), and
extract from data relevant hidden information (Data Mining). We collected all these instruments inside the so
called Web Crawling Project. Further, the corresponding environment, called Virtual Laboratory, is able to
offer the possibility to use all these integrated tools remotely and by a simple graphical interface. A detailed
description of the developed web application will be illustrated. Finally, some experimental results on the
behaviour of the Web Crawling tool will be reported.
1 INTRODUCTION
Over the last 20 years, the Internet has shown an expo-
nential growth. It is certainly the World’s largest data
source and this is confirmed by the increasing number
of new documents/contents uploaded every day.
Web data have characteristics that involve a consid-
erable effort of analysis and organization. Indeed,
three are their main features. The first one, due to
the fast development of the Web, is the great amount
of data. The second one is their distributed storing
in different sites, sometimes geographically very far
apart. Finally, the last feature regards their form. In
many cases, because of their textual nature, data has
an unstructured (e.g. docs, pdf, texts, etc.) or “semi”
structured (e.g. HTML, XML, JSON, etc.) form.
It is in this scenario that all the most popular search
engines, such as Google, Bing and Yahoo, everyday
work and deal with this huge amount of data. In fact,
they need to periodically download the content of a
wide web space in order to update their indexes and
then provide the most recent results for the querying
tasks. There are a lot of other contexts in which the
information retrieved from Web data is very impor-
tant, such as: in Cyber Security to be protected against
the criminal or unauthorized use of electronic data;
in Business Intelligence to obtain a successful market
strategy before competitors; or in Academic Research
to analyse the historical evolution of the Web over the
years, from origins to present.
It is trivial to realize that the activity of download-
ing a large amount of data from the Internet, within a
tolerable elapsed time, becomes a critical point in all
the above application fields. This task is commonly
known as Web Crawling.
At the same time, in order to tackle the problem of
storing, copying, compressing and displaying a huge
amount of data, who decides to crawl the contents
from the Web, needs the use of suitable strategies of
data managing. It is for this reason that all these oper-
ations have to be dealt with only inside the Big Data
context.
A last consideration regards the knowledge that it can
be extracted from the Web data. As, in many cases,
data sources are in textual (unstructured or semi struc-
tured) form, it is normal to apply Data Mining tech-
niques for text data for advanced analysis. Specifi-
cally, in order to extract relevant and accurate infor-
Santomauro, G., Ponti, G., Ambrosino, F., Bracco, G., Colavincenzo, A., Rosa, M., Funel, A., Giammattei, D., Guarnieri, G. and Migliori, S.
A Collaborative Environment for Web Crawling and Web Data Analysis in ENEAGRID.
DOI: 10.5220/0006483602870295
In Proceedings of the 6th International Conference on Data Science, Technology and Applications (DATA 2017), pages 287-295
ISBN: 978-989-758-255-4
Copyright © 2017 by SCITEPRESS – Science and Technology Publications, Lda. All rights reserved
287

mation and thus to obtain quality results and high-
value content, such techniques have to be able to take
into account both syntactic and semantic aspects of
text data. It is certainly important to consider clus-
tering techniques in order to identify homogeneous
groups in the data, information classes and patterns.
The remarkable amount of data combined with the al-
gorithmic aspect is a truly costly task from a com-
putational point of view. For this reason it was im-
portant to conduct research at an advanced comput-
ing centre such as the Portici ENEA Research Centre,
which, hosting the CRESCO/ENEAGRID infrastruc-
ture (Ponti et al., 2014), offers the possibility to com-
pute and test the algorithms.
The paper is organized as follows: in Section 2 we
provide a general survey of the Web Crawling tools;
in Section 3 we describe the integration in ENEA-
GRID of the Web Crawling Project; in Section 4 we
report the results of any Web Crawling sessions per-
formed on ENEAGRID; and finally in Section 5 we
resume the main results reached and some possible
future tasks to improve them.
2 WEB CRAWLING TOOLS
Generally, a crawling technique analyses systemati-
cally and automatically the content of a network in
order to search for documents to download. The Web
crawlers, namely the programs designed to crawl, are
based on a list of URLs. They make a text copy of
all visited pages and save them in an index. When a
crawler parses an URL, all hyper links in the docu-
ment are identified and then added to the list of URLs
to visit. This process can be manually stopped or
when a specified number of connections is reached.
With the aim to integrate in ENEAGRID some web
crawling tools, several products have been investi-
gated. At the state-of-the-art, web crawler tools can
be divided into two main categories. In the first one
there are all tools allowing only to download raw web
pages (“mere crawling”), whereas in the second class
there are software programs which provide data struc-
turing or data pre-analysis in addition to mere crawl-
ing facilities. We will refer to this second family of
tools as “new generation crawling”, which embed
also post-crawling instruments, e.g. for data parsing.
Among the “mere crawling” tools, the following ones
have been taken into account:
Heritrix: It is written in Java; It respects the exclu-
sion guidelines of the META robots tags; It col-
lects material at a measured and adaptive pace
with low probability of influencing the normal ac-
tivity of a website; The interface is accessible by
using a web browser; It is scalable but not dynam-
ically scalable.
Nutch: It is based on Lucene and Java; It is encoded
entirely in Java, but data is written in language-
independent formats; It has a highly modular ar-
chitecture that allows developers to create plug-
ins for media-type parsing, data retrieval, query-
ing, and clustering. It is accessible from terminal.
BUbiNG: It is an open-source Java fully distributed
software; It is a product born in academic envi-
ronment; It is built upon the experience with Ub-
iCrawler on the last ten years of research on the
web crawling topic.
Among the “new generation crawling” instruments,
we investigated the following ones:
Scrapy: It is written in Python; It can be used to
extract data using API; It returns semi-structured
outputs (JSON, XML, CSV, etc.); It is accessible
from terminal.
OpenWebSpyder: It support the multi-threading; It
has some search engine functions; It is accessible
from web browsers;
OpenSearchServer: It performs various functions,
such as Crawling, Parsing, Analysis, Classifica-
tion, Learning, on different data sources (Web,
File system, Database and XML files).
It was also important that the selected solutions sat-
isfy the requirements of the state-of-the-art in the
Web Crawling theme both from the point of view of
methodologies and from the rules which are the best
practices in this field and without causing problems to
the visited sites. Indeed, three are the main issues to
be taken into account: the first one is technical and
concerns the so-called Denial of Service; the other
two questions are of a legislative nature and concern
the safeguarding of the confidentiality of personal in-
formation (Privacy) and the protection of intellectual
property of the data (Copyright).
It is also for these reasons that, after some tests and
experimentations, in order to establish which web
crawler was the most conform to be integrated in
ENEAGRID, we decided to adopt BUbiNG software.
In the following, we describe in details the main fea-
tures of this web crawling software, explaining the
reason of our choice.
2.1 Software Solution: BUbiNG
Among the above considered tools, the software BUb-
iNG (Boldi et al., 2016), at 0.9.11 version, is chosen
as main Web crawler to use and it is properly installed,
configured and tested on ENEAGRID. This software
KomIS 2017 - Special Session on Knowledge Discovery meets Information Systems: Applications of Big Data Analytics and BI -
methodologies, techniques and tools
288
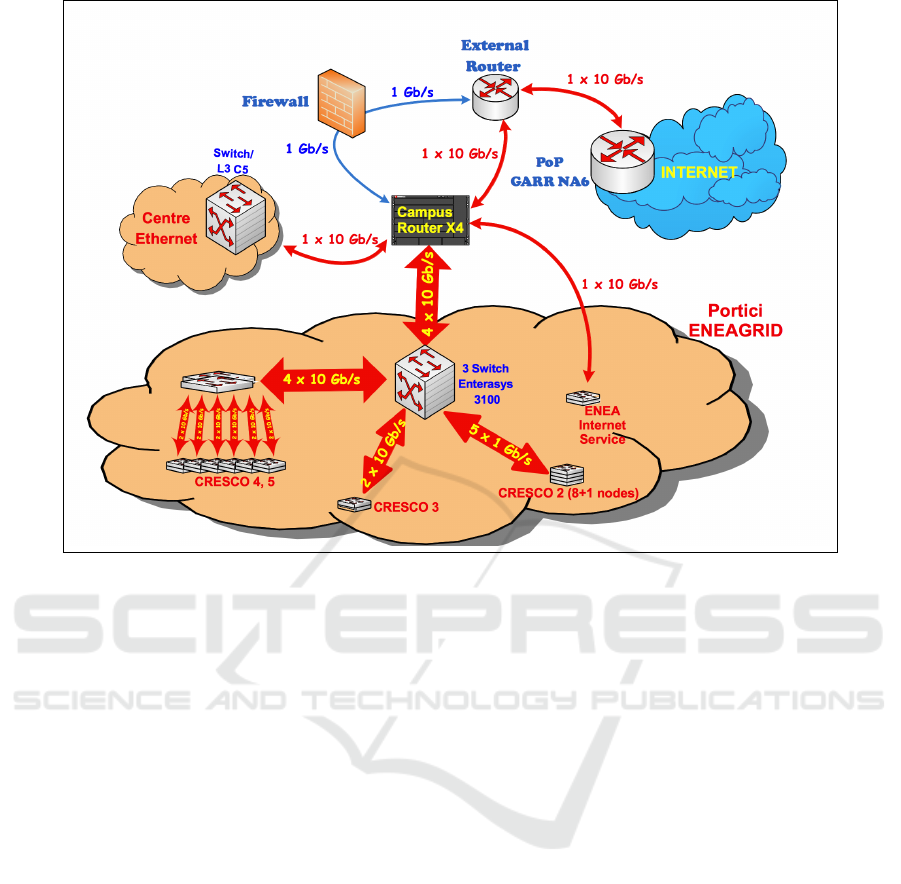
Figure 1: Portici ENEA Research Centre Network Schema.
allows the simultaneous execution of multiple agents
(e.g., Java instances that play the role of a crawler).
Each agent can communicate with each other one by
ensuring not repeated visits of the same pages and bal-
ancing the computational load. BUbiNG also allows
setting up all configuration options in a single file and
many of its parameters can be modified at runtime.
Among them, the main parameters that we can set up,
we find the filters. For example, a filter can be applied
to:
• all ready URLs to decide whether to fetch them;
• all fetched resources to decide whether to parse
them.
• all fetched resources to decide whether to store
them.
Another important setting is about the number of
threads for each inner task, i.e for the DNS resolu-
tion, the fetching and the parsing of the web pages.
Further, we can also set up the size of inner cache
memories, more precisely:
• the Workbench which contains approximately all
URLs that will be retrieved in a short time;
• the Sieve which keeps track of URLs not yet vis-
ited;
• the Bloom Filter to detect duplicated downloaded
pages;
• the URL cache which saves 128bit MurmurHash3
fingerprints of newly visited URLs.
Also, the initial seed from which a session of web
crawling starts is passed as parameter to the software,
more precisely as path of the text file where the URLs
are saved. Finally, BUbiNG saves the content down-
loaded from the Web in compressed .warc.gz files.
This data compression is very important because it let
us save space up to around 80% of the real size of the
amount of data.
3 INTEGRATION IN ENEAGRID
In order to integrate in ENEAGRID tools able to
download data from the Web, manage/display a large
amount of data and extract significant information
from them, we created the Web Crawling Project.
One of the aims of the project was also the usage
of ENEAGRID for some experimental tests instead
of high performance computation tasks. A secondary
goal was to set up a project that involves all the main
hardware and software devices of the facility. In fact,
with the Web Crawling Project we had to consider
and harmonize with each other some hpc nodes, the
networking (inner and outer) system, the storage ap-
paratus and the job scheduler.
A Collaborative Environment for Web Crawling and Web Data Analysis in ENEAGRID
289
3.1 Hardware Solutions
First of all, as hardware resources, we considered a
set of 9 machines dedicated only for the Web Crawl-
ing activity, 8 of them are used for computations, 1
as a front end. The servers are nodes of the clus-
ter CRESCO2 belonging to the Portici ENEA Re-
search Centre and integrated in ENEAGRID. Each of
them mount 2 Xeon Quad-Core Clovertown E5345
processors and 16 GByte of RAM. Suitable config-
urations, also from networking side, are carried out
to appropriately confine the network traffic. In Fig-
ure 1 we report the Network Schema of the Portici
ENEA Research Centre. The nodes are linked by 5
InfiniBand (5 × 1Gbps) cables to a Switch Enterasys
3100. From here, the network traffic passes (with
4 × 10Gbps bandwidth) across the Campus Router,
an Enterasys Matrix X4. After, the traffic is routed
(1Gbps in I/O) on the Centre Firewall and then on
the External Router, a Cisco 7606. Finally, with a
1 × 10Gbps connection, traffic reaches the Point of
Presence GARR NA6, then the Internet.
According to the ENEAGRID guidelines, we inte-
grated the web crawling software on the infrastruc-
ture. More specifically, the binary source of BUb-
iNG tool and all the relative dependencies are then
properly installed, configured in the project area of
the geographically distributed filesystem AFS (the in-
stalled version is 1.6.7-1). For data storing, as the web
crawler quickly downloads a large amount of data, we
decided to allocate a wide space on the high perfor-
mance distributed parallel clustered filesystem GPFS
(4.2.2 version). Finally, a set of bash scripts are coded
to simplify the commands submitting from the soft-
ware to the resource scheduler LSF (7.0.3 version).
3.2 Virtual Laboratory
All the Web Crawling instruments are collected
in a ENEAGRID Virtual Laboratory, named Web
Crawling. The goal of the laboratory is to make
available to a wide scientific community the crawl-
ing tools. In particular, like all the virtual labs
developed on the infrastructure, we created a public
Website where users can authenticate and then
access to an ad hoc graphical interface to intuitively
use the installed software. The scientific commu-
nity of ENEAGRID users, interested in using the
Web Crawling tools, can browse at the address
http://www.afs.enea.it/project/webcrawl/
index.php.
The site is composed of four main pages: a welcome
page (Fig. 2), a software area access page (Fig. 3),
a contacts page and a reserved documents area page.
Once an user enters its ENEAGRID credentials at the
software page of site (Fig. 3), a graphical mask (i.e,
a web application) starts on the front end machine,
and he can begin to use the Web Crawling tools.
The authentication procedure is managed by a NX
client installed locally on the user machine, while the
interface is based on FARO 2.0 technology (Mariano
et al., 2016).
3.3 Web Application
The web application is a customized version of FARO
2.0, developed over the JavaFX framework, that ex-
ploits WebViews for its interface implementation and
its operational logics. A second way to access to the
web application is by means FARO 2.0 which has a
suitable button on its Virtual Labs page (Fig. 4) to
directly start the web crawling interface.
Figure 5 shows the interface welcome page. By click-
ing on the Application button on the top bar, different
tabs for different operations are displayed:
• On the first tab (Snapshot) Web Crawling sessions
with the opportunity to perform single or periodic
snapshots can be submitted (Fig. 6). The user can
specify a session name, the number of snapshots,
the running time for each of them, the starting
date, the execution frequency for periodic snap-
shots, select the setting of the parameters to be
used and the URLs initial seed;
• In the second tab (New Configuration) the user
can create a new setting for BUbiNG software
(Fig. 7). By default, each software parameter is
Figure 2: Homepage of Web Crawling Virtual Lab site.
KomIS 2017 - Special Session on Knowledge Discovery meets Information Systems: Applications of Big Data Analytics and BI -
methodologies, techniques and tools
290
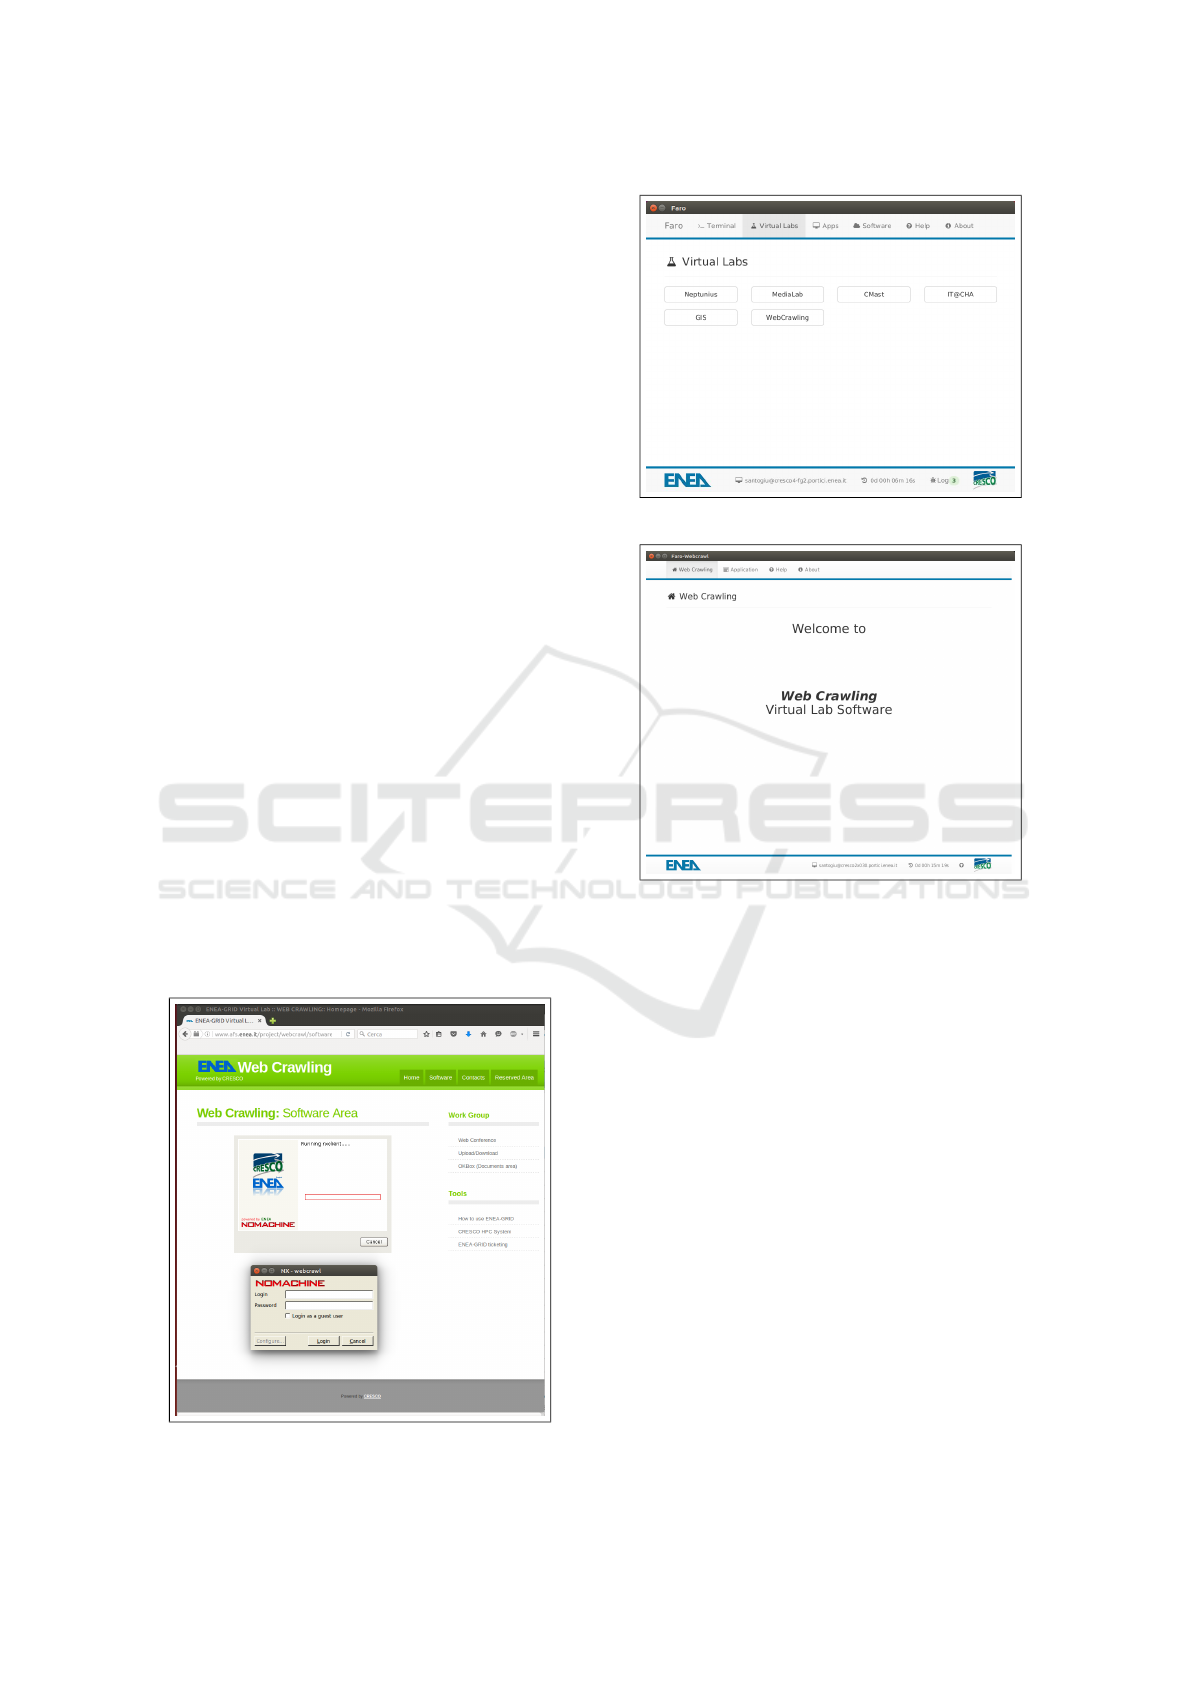
set up with the corresponding value of the best
configuration (16 agents). The user can also load
an old setting, modify it and save it as new config-
uration or overwrite over the old one.
• In the third tab (New Initial Seed) a new list of
URLs to start the crawling can be created (Fig.
8). Like the configuration, user can load an old
list, modify it and save it as new list or overwrite
over the old one;
• On the fourth tab (Monitoring), the generated traf-
fic on the network by a running snapshot, se-
lectable from the list of those that are in run, can
be monitored (Fig. 9). This tab is useful to know
in real time the amount of downloaded data, for
single agent or total, and detect eventual perfor-
mance anomalies;
• On the fifth tab (Statistics), user can view some
statistics on the performed snapshots, such as: the
amount of data downloaded, the number of the
visited pages and the downloading speed (Fig.
10).
• On the sixth and last tab (Analysis & Display) are
available some tools for the post-crawling process
(Fig. 11).
For each terminated snapshot, three main instruments
are used for the analysis, the displaying and the clus-
tering of the web data. From here, user can start/stop:
• a session, as web server, of Solr software for the
indexing, the analysis and searching of the web
data;
Figure 3: Software page of Web Crawling Virtual Lab site.
Figure 4: FARO2 Virtual Labs page.
Figure 5: GUI welcome page.
• a session, as web server, of OpenWayback product
for the browsing of the HTML pages;
• a session, as application, of Carrot
2
software for
the clustering of data.
Solr is based on Lucene and its graphical interface is
viewable via browser. It extracts and indexes a lot
of metadata from each web document (URL, crawl-
ing date, text content, position inside the source file,
etc.). In Figure 12 is reported a screenshot of the soft-
ware after a text search of the Italian word terremoto
(earthquake) on a snapshot executed only on the Ital-
ian domain .it.
OpenWayback tool, whose graphical interface is, once
again, viewable via browser, indexes the html pages
for URL and crawling date. In Figure 13 is reported a
screenshot of the software while it displays one of the
documents just searched by Sorl.
Finally, Carrot
2
, which has an independent interface,
is considered an Open Source Search Results Cluster-
ing Engine and it is well-integrated with Solr. Among
the main features of Carrot
2
it should be underlined
A Collaborative Environment for Web Crawling and Web Data Analysis in ENEAGRID
291
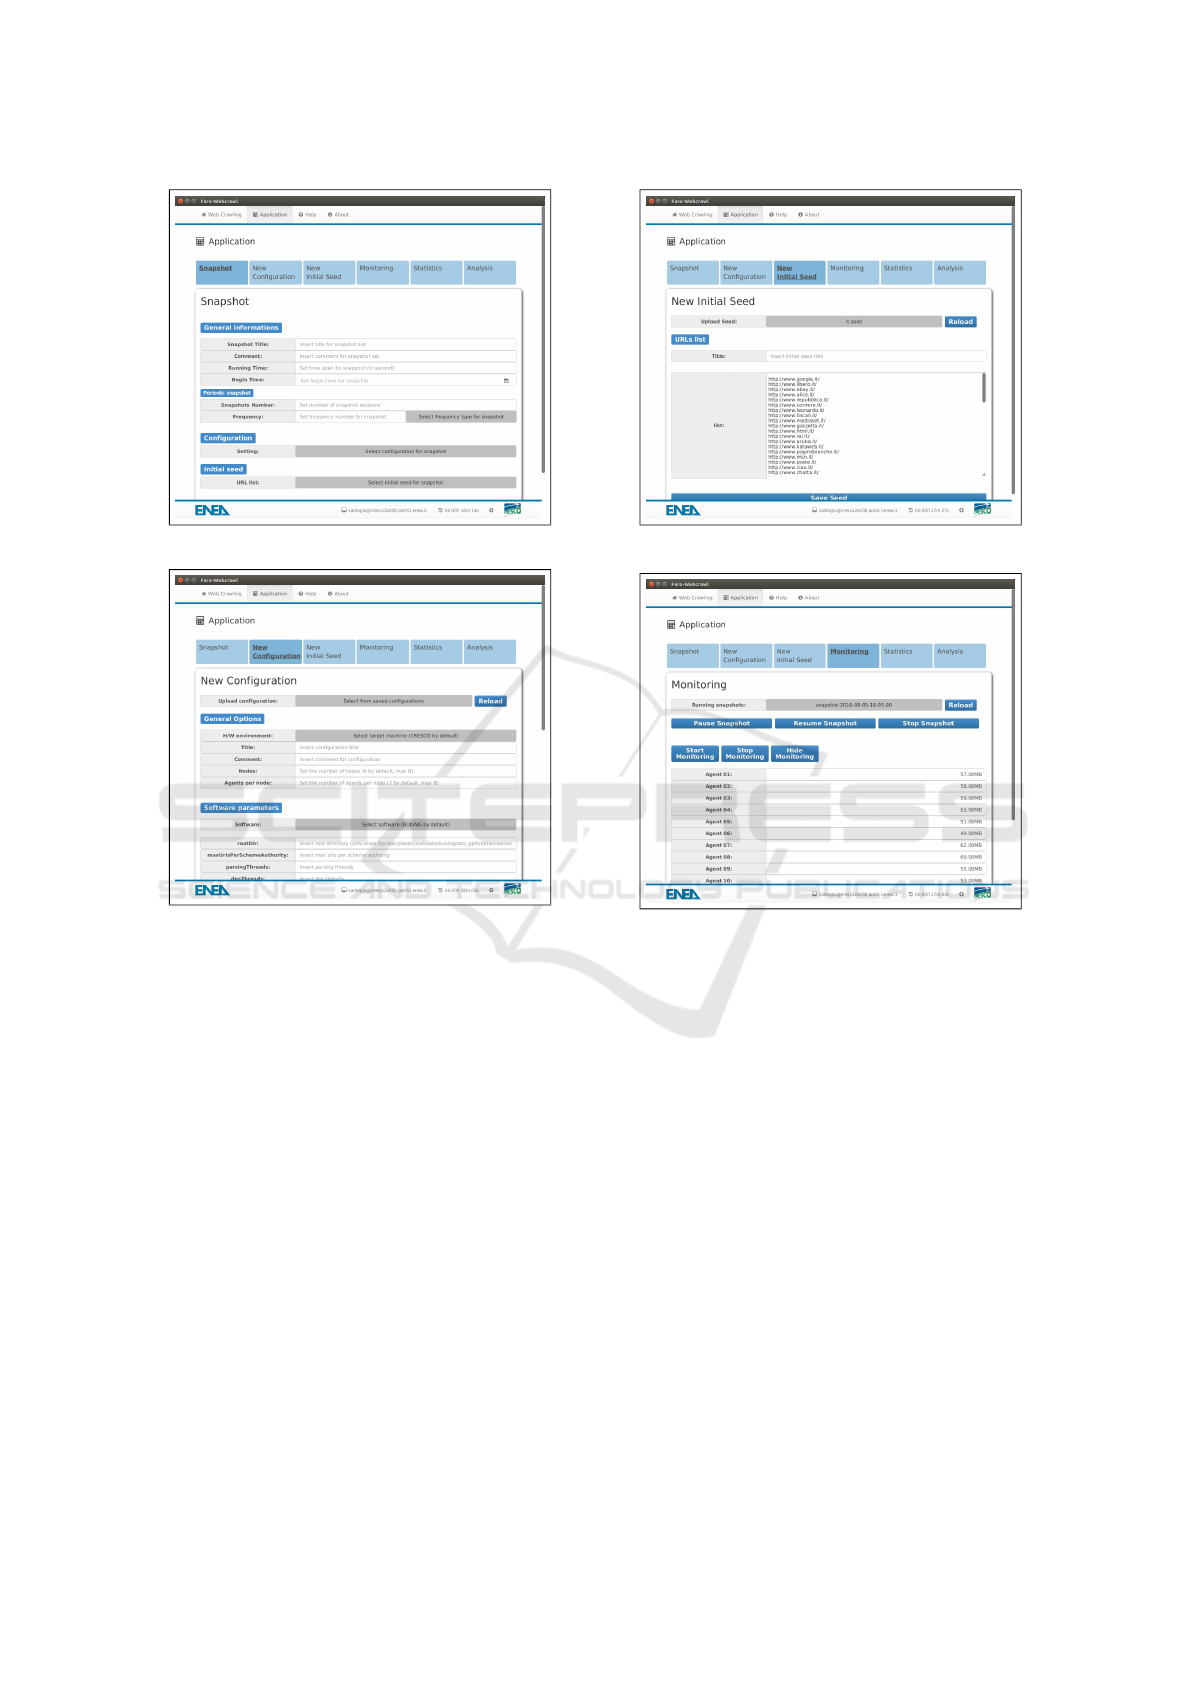
Figure 6: GUI snapshot tab.
Figure 7: GUI new configuration tab.
that it is able to create clusters on different types of
documents (also the web pages), using various clus-
tering techniques (K-means, Lingo, STC, etc.) and re-
turns the results in different forms, also graphically.
Figure 14 shows a screenshot of the software at the
end of a clustering execution. In the top left it can
be seen that the choice of data source is a collection
of web documents indexed by Solr and the algorithm
used is the K-means. The software applied the algo-
rithm on the collection by running at the first a filter
on the documents, starting from a keyword provided
by the user (in this example it has been chosen the
Italian word repubblica, i.e. republic), and it returned
a partition on the subset of files by tagging each of
these partition with a label (or also called cluster). Fi-
nally, on the right side are displayed some algorithm
parameters that can be modified to obtain a different
result.
Figure 8: GUI new initial seed tab.
Figure 9: GUI monitoring tab.
4 TESTS AND EXPERIMENTAL
RESULTS
Once BUbiNG is installed, a set of snapshots hav-
ing the same running time (15min) but with various
choices of the software parameters has been submit-
ted. The aim of this parameter tuning was to find out
the best configuration for the crawler. At the end of
this operation, after more than 40 performed sessions,
we observed that the best set up for the software, com-
puted as the amount of data downloaded per time unit
(∼1Gbps), has been obtained by using 8 nodes and
16 agents (2 agents per node). The best measured
speed had the same order of bandwidth of the net-
work system used for the Web crawling activity. In-
deed, the bottleneck for the Portici ENEA Research
Centre network was the firewall that limits the access
to 1Gbps. In order to stress BUbiNG crawler we de-
cided to perform some large Web crawling sessions.
We have taken into account the following aspects:
KomIS 2017 - Special Session on Knowledge Discovery meets Information Systems: Applications of Big Data Analytics and BI -
methodologies, techniques and tools
292
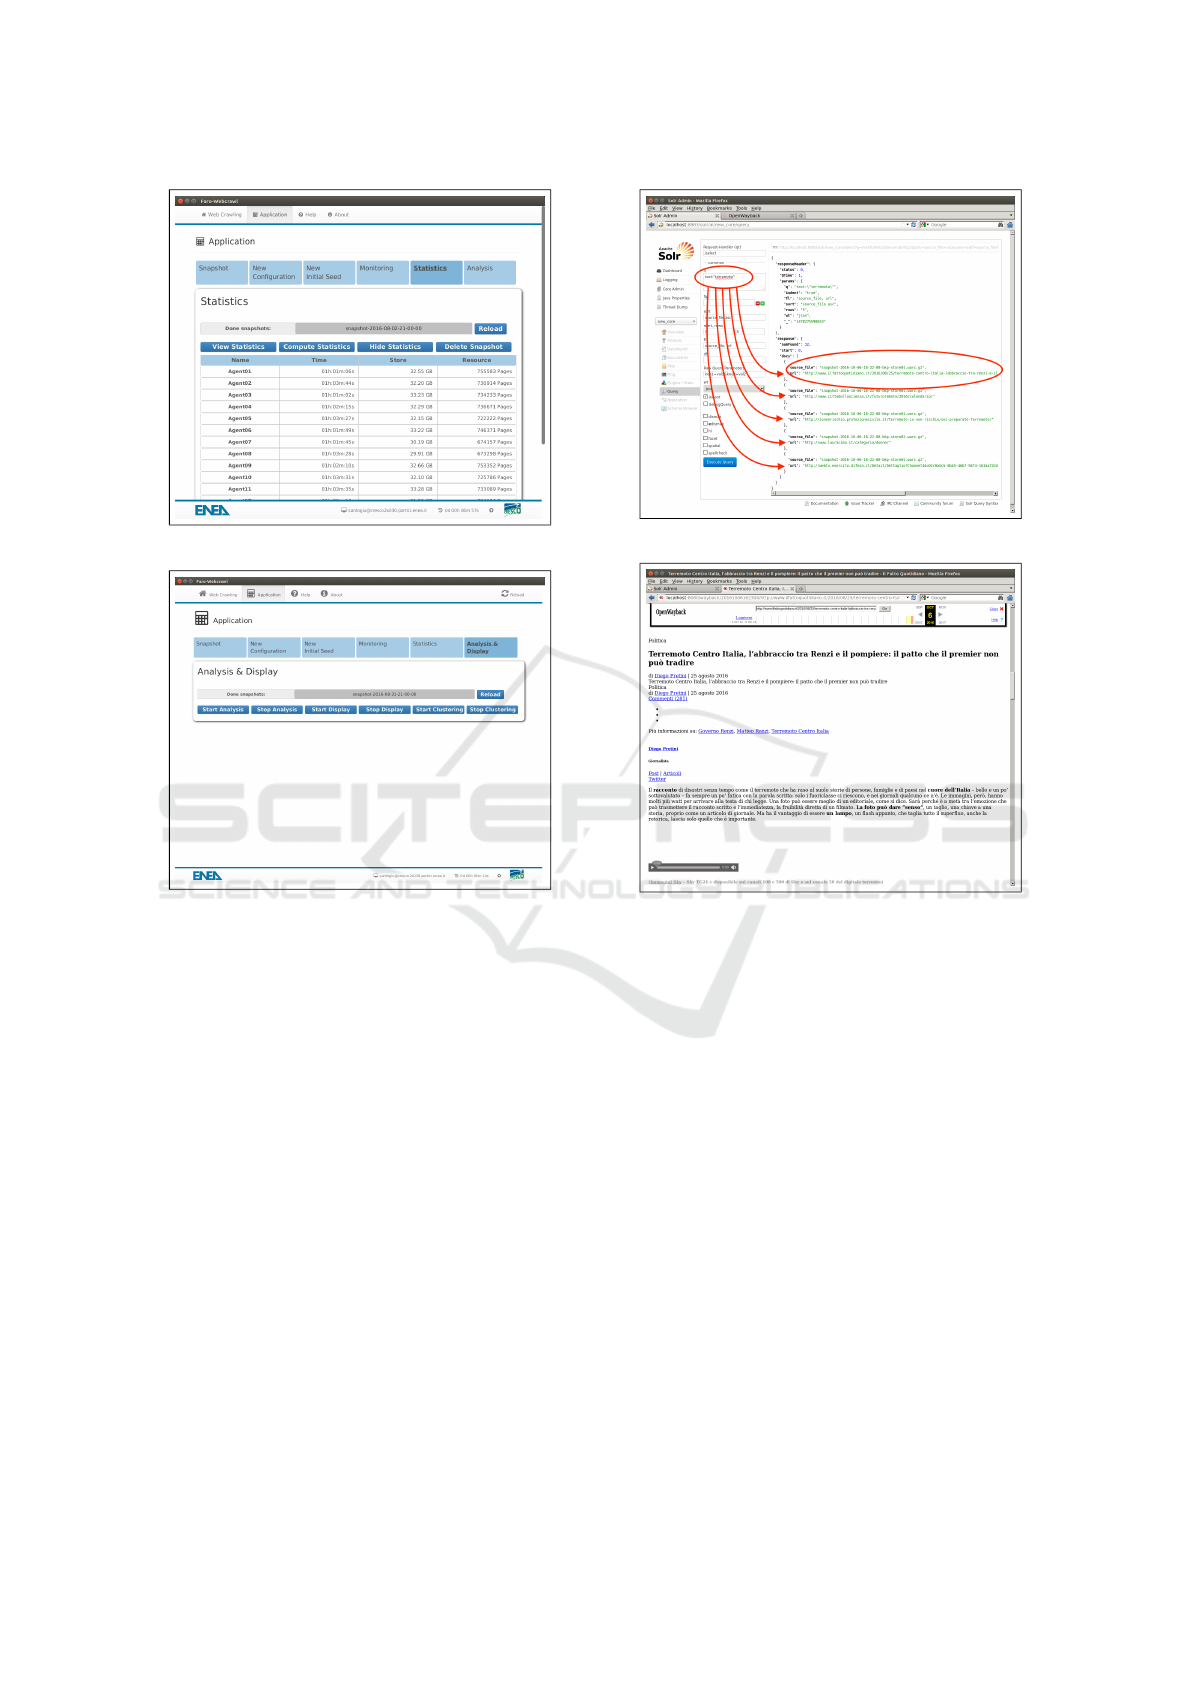
Figure 10: GUI statistics tab.
Figure 11: GUI analysis, display and clustering tab.
• we selected some periods with low network traffic
in Portici ENEA Research Centre;
• we informed the network managers to prevent
conflicts with other activities and/or fully saturate
the available bandwidth;
• we used all the available hardware resources (8
nodes) and the optimal setting of the software in
order to maximize the downloading speed;
• we monitored the snapshots during their running
time.
Two kinds of snapshot sessions have been con-
sidered: in the first one the execution time was very
long in order to evaluate a very slow performance de-
cay and the robustness of the software; in the second
one we tested the crawler by submitting some sched-
uled periodic snapshots for ensuring the uniform be-
haviour along the time, i.e. the software reliability.
The harvested material, downloaded from the Internet
by tests, was also useful to create a first database on
which apply the data mining tools. For all the tests
Figure 12: Solr interface.
Figure 13: OpenWayback interface.
we noted that no interference with the normal net-
work activity is reported. Further, all the snapshot
sessions are performed by using as initial seed a set
of only Italian URLs and by applying a filter to down-
load only Italian sites, e.g. only web pages of the .it
domain.
4.1 Tests for Long-time Snapshots
For the first kind of tests, we considered some days
of the year with low activity in the Portici ENEA Re-
search Centre, i.e. during the 2015 Christmas holi-
days. More specifically we performed the three fol-
lowing long-time snapshots:
Test 1 on 10/12/2015, from 09:30 to 17:30 (8h);
Test 2 on 28/12/2015, from 12:00 to 22:00 (10h);
Test 3 on 10/01/2016, from 01:00 to 11:00 (10h).
In Table 1 we report the statistics extracted from the
log files about the three sessions. By observing the
table we can remark that:
A Collaborative Environment for Web Crawling and Web Data Analysis in ENEAGRID
293
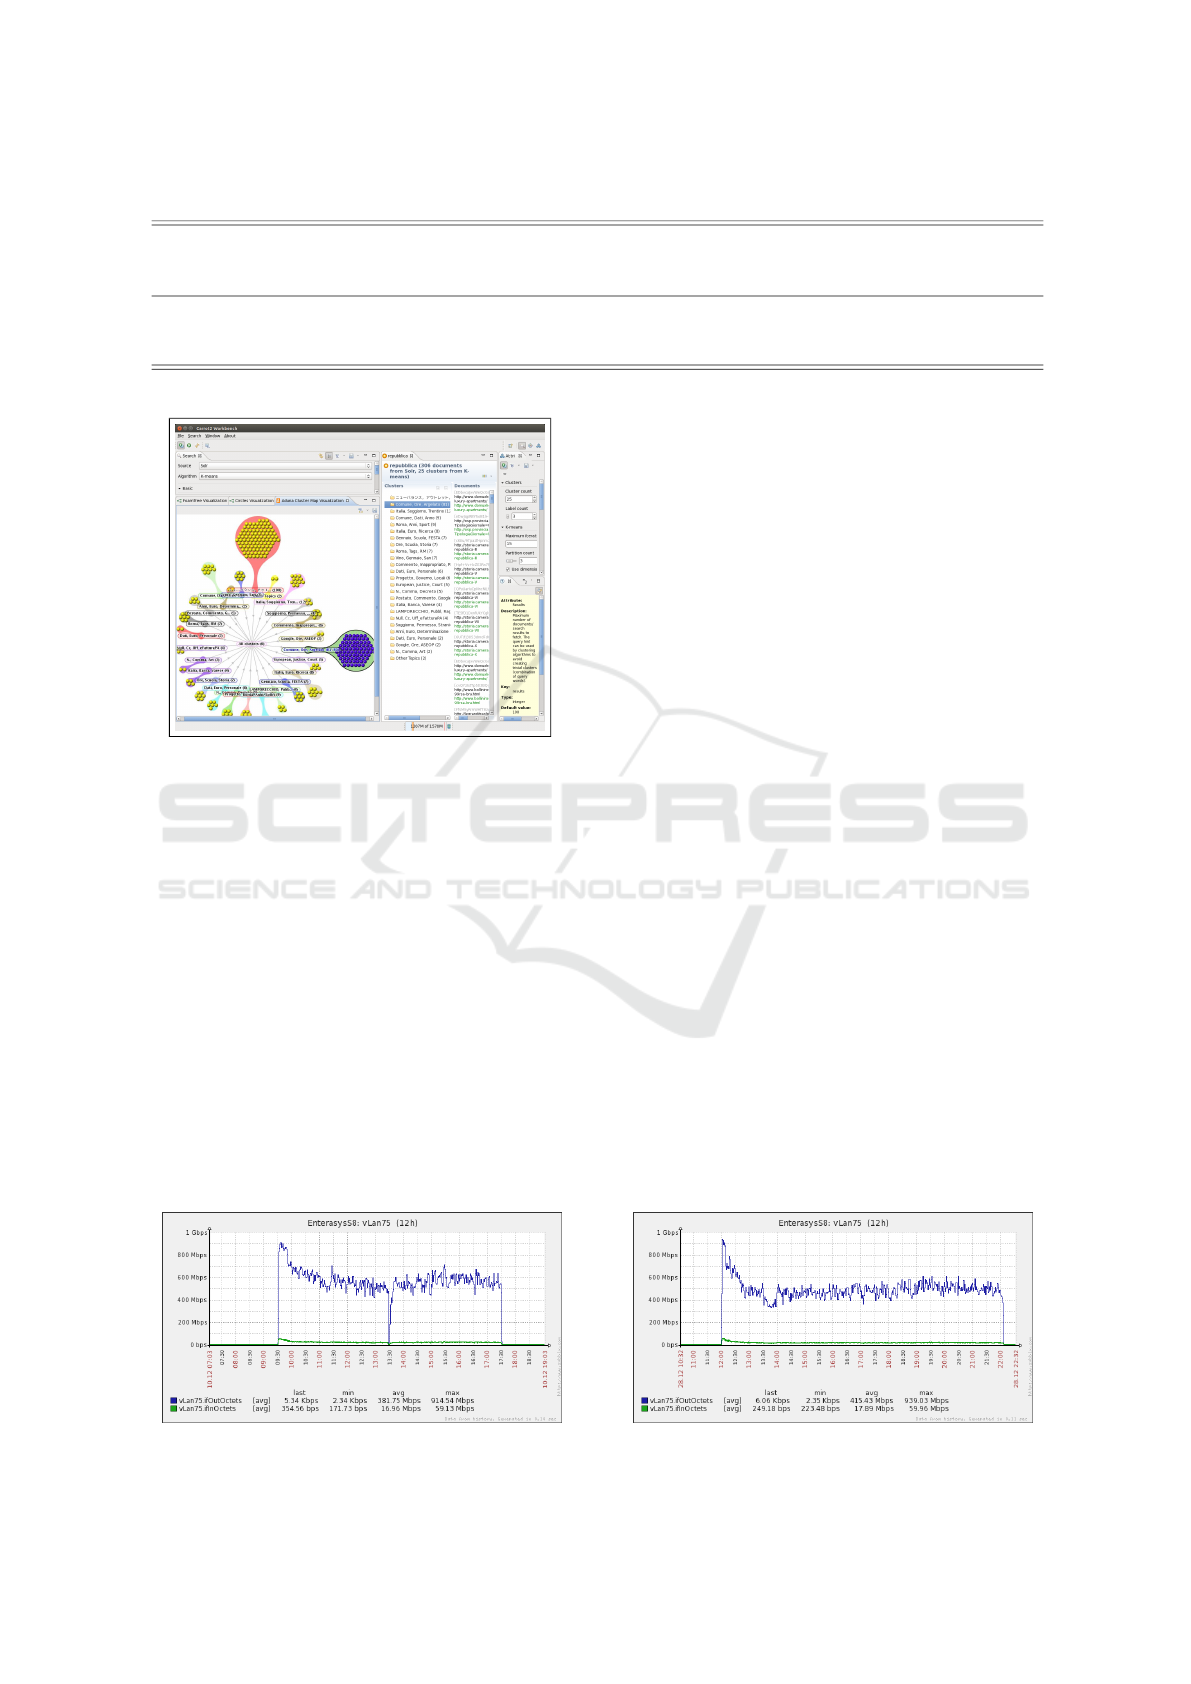
Table 1: Long time sessions performance for Test 1, 2 and 3.
Starting Running Saved compressed Downloaded Downloaded Data Resources
Date Running time Agents data data resources speed speed
[dd/mm/yy] [hh:mm] [hour] [#] [GB] [TB] [#Pages] [Mb/s] [#Pages/s]
10/12/2015 09:30 8 16 522,38 2,94 66.806.790 850 2305
28/12/2015 12:00 10 16 580,28 3,23 71.667.304 740 1959
05/01/2016 01:00 10 8 581,89 3,27 75.587.287 756 2048
Figure 14: Carrot
2
interface.
a) as absolute value, the Test 1 (by exploiting 16
agents) reached the best performance (850Mbps);
b) if the running time was equal (10h), the Test 3
(756Mbps), which used 8 agents, was slightly bet-
ter than the Test 2 (740Mbps), which exploited 16
agents;
c) the ratio between the compressed data saved on
the storage (column 5) and the real amount of
downloaded data (column 6) is ever around the
17%.
In Figures 15, 16 and 17 we report the plot of
the downloading data speed versus the time, respec-
tively for Test 1, 2 and 3. We should point out that the
real speed value was a little greater than the reported
one on the graphics because the web data are com-
Figure 15: Downloading speed for the test on 10/12/2015.
pressed before downloading. As we expected, during
the crawling, the downloading speed showed an initial
peak (up to the limit of 1Gbps) and then a damping
around a slight lower constant value (700-800Mbps).
This phenomenon of performance decreasing is com-
mon for all web crawlers. The best initial behaviour is
explained by the inner managing of the cache system.
At the beginning all the crawler cache memories (e.g.
for URLs to visit, the URLs just downloaded, etc.)
are empty. When they begin to allocate space then the
downloading speed begin to decrease. We observed
that the performance decay is only for 20% − 30%
with respect to the best initial behaviour. This is a
good result because the decrement is regular, constant
and limited over a long time. This last remark con-
firmed the high performance of the software. Further,
in Figure 15, we observed around 13:30, for few min-
utes, a quickly decay of the downloading speed and
then a fast return to the previous state. We related
this event to a momentary reset of a networking de-
vice and this unexpected phenomenon, happened dur-
ing Test 1, let us to remark a good robustness of the
software BUbiNG.
4.2 Tests for Periodic Snapshots
By the massive crawling of the first kind of tests we
verified some web crawler quality characteristics, i.e.
the efficiency and the robustness. Instead, by the sec-
ond type of tests, we proved the software reliability.
Firstly, we considered a long year period when the
network conditions were constant and with low activ-
ity, such as August 2016. Then, during this month, we
Figure 16: Downloading speed for the test on 28/12/2015.
KomIS 2017 - Special Session on Knowledge Discovery meets Information Systems: Applications of Big Data Analytics and BI -
methodologies, techniques and tools
294
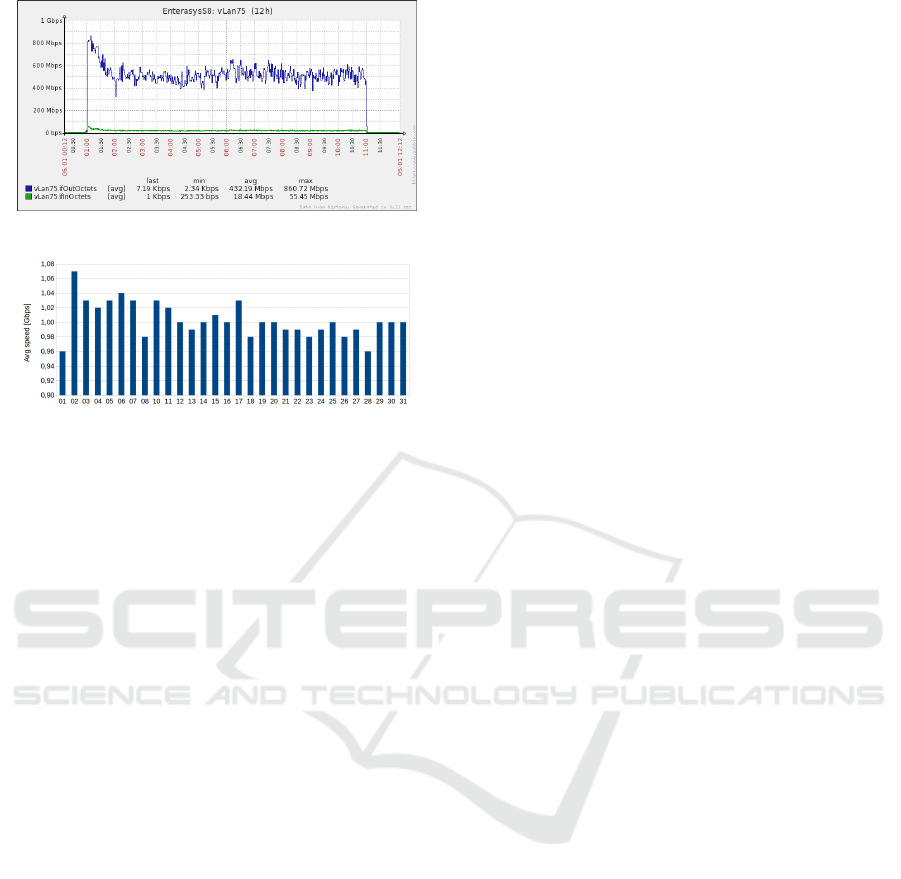
Figure 17: Downloading speed for the test on 05/01/2016.
Figure 18: Downloading avg speed for daily periodic snap-
shots during August 2016.
submitted a set of periodic snapshots. We executed 31
daily web crawling sessions, each of them kept alive
for one hour (from 21:00 to 22:00) and by using the
best set up of the software, the same of Test 1 and
2, i.e. 8 nodes and 2 agents per nodes. As total, we
downloaded about 15TB of data (on average, 484GB
per snapshot) and saved on the storage around 3,3TB
(on average, 111GB per snapshot). In Figure 18 is
reported the downloaded data speeds for each snap-
shot. We observed that they oscillated between 0,96
and 1,07Gbps with an average value around 1,00Gbps
(the bottleneck due the firewall) and variance around
0,0005Gbps. The successfully done tests and the high
performance demonstrated the good reliability of the
software.
5 CONCLUSIONS AND FUTURE
WORKS
To summarize, with this work we obtained a good
product for the web crawling activity. This tool is
completely integrated in ENEAGRID infrastructure
by the Web Crawling Project. It allows collaborative
work, thanks to its Virtual Lab, which provides a web
graphical application in order to use all instruments
integrated in the infrastructure, also remotely. In ad-
dition to the web crawling software, the Virtual Lab
offers some post-crawling solutions, i.e. for indexing,
querying, displaying and clustering the web data, in
such a way as to have a complete product. The exper-
imental results confirm the high quality of the config-
uration for the web crawling software from a point of
the efficiency, the robustness and the reliability.
For the future we hope to improve the indexing pro-
cess. Now, this task is sequentially performed by a
single machine (the front end). In the first instance,
statistics relative to this operation, show an average
of 4 hours of indexing (on single node) for each one
of crawling (on 8 nodes). We expect, by paralleling
the process (by means the other 8 nodes and/or by
a large memory machine), reaching the goal of “few
minutes” of indexing per one hour of crawling.
ACKNOWLEDGEMENTS
The computing resources and the related technical
support used for this work have been provided by
CRESCO/ENEAGRID High Performance Comput-
ing infrastructure and its staff (Ponti et al., 2014).
CRESCO/ENEAGRID High Performance Comput-
ing infrastructure is funded by ENEA, the Ital-
ian National Agency for New Technologies, En-
ergy and Sustainable Economic Development and
by Italian and European research programmes, see
http://www.cresco.enea.it/english for informa-
tion.
REFERENCES
Boldi, P., Marino, A., Santini, M., and Vigna, S. (2016).
BUbiNG: Massive Crawling for the Masses. CoRR,
abs/1601.06919.
Mariano, A., D’Amato, G., Ambrosino, F., Aprea, G.,
Colavincenzo, A., Fina, M., Funel, A., Guarnieri, G.,
Palombi, F., Pierattini, S., Ponti, G., Santomauro, G.,
Bracco, G., and Migliori, S. (2016). Fast Access
to Remote Objects 2.0 a renewed gateway to enea-
grid distributed computing resources. PeerJ Preprints,
4:e2537v1.
Ponti, G., Palombi, F., Abate, D., Ambrosino, F., Aprea,
G., Bastianelli, T., Beone, F., Bertini, R., Bracco, G.,
Caporicci, M., Calosso, B., Chinnici, M., Colavin-
cenzo, A., Cucurullo, A., Dangelo, P., De Rosa, M.,
De Michele, P., Funel, A., Furini, G., Giammattei,
D., Giusepponi, S., Guadagni, R., Guarnieri, G., Ital-
iano, A., Magagnino, S., Mariano, A., Mencuccini,
G., Mercuri, C., Migliori, S., Ornelli, P., Pecoraro,
S., Perozziello, A., Pierattini, S., Podda, S., Poggi, F.,
Quintiliani, A., Rocchi, A., Scio, C., Simoni, F., and
Vita, A. (2014). The role of medium size facilities in
the HPC ecosystem: The case of the new CRESCO4
cluster integrated in the ENEAGRID infrastructure.
pages 1030–1033.
A Collaborative Environment for Web Crawling and Web Data Analysis in ENEAGRID
295
