
Election Vote Share Prediction using a Sentiment-based Fusion of
Twitter Data with Google Trends and Online Polls
Parnian Kassraie
1
*, Alireza Modirshanechi
1
* and Hamid K. Aghajan
1,2
1
Department of Electrical Engineering, Sharif University of Technology, Tehran, Iran, Islamic Republic of
2
imec, Department of Telecommunications and Information Processing, University of Gent, Gent, Belgium
Keywords: Social Media Text Mining, Sentiment Analysis, Google Trends, Twitter, Election Prediction, Gaussian
Process Regression.
Abstract: It is common to use online social content for analyzing political events. Twitter-based data by itself is not
necessarily a representative sample of the society due to non-uniform participation. This fact should be noticed
when predicting real-world events from social media trends. Moreover, each tweet may bare a positive or
negative sentiment towards the subject, which needs to be taken into account. By gathering a large dataset of
more than 370,000 tweets on 2016 US Elections and carefully validating the resulting key trends against
Google Trends, a legitimate dataset is created. A Gaussian process regression model is used to predict the
election outcome; we bring in the novel idea of estimating candidates’ vote shares instead of directly
anticipating the winner of the election, as practiced in other approaches. Applying this method to the US 2016
Elections resulted in predicting Clinton’s majority in the popular vote at the beginning of the elections week
with 1% error. The high variance in Trump supporters’ behavior reported elsewhere is reflected in the higher
error rate of his vote share.
1 INTRODUCTION
With the widespread use of social media, researchers
have used tweets to anticipate and analyze social and
political trends. Predicting the result of an election, as
a critical political event, can save campaigns and the
media a great amount of money and effort. Estimating
the political preferences of people from social media
can complement or even replace opinion polls.
However, election-related social media data can be
quite complex and misleading. A citizen’s political
stand cannot be easily determined from their online
activity. In addition, in every country a noticeable
portion of the voters may not have access to social
media, or may not be politically active. Thus, the
online content should be processed with caution.
Models built on a data which is not validated to
convey a sentiment may introduce distortion in
prediction process. The samples gathered from social
media, i.e. tweets are correlated in time. For instance,
a tweet two weeks prior to the election may contain
more information than a tweet from a year earlier.
There has been extended research on the topic of
predicting election results from online social content.
However, most of the existing literature lack a
systematic treatment of the issues concerning social
media data which were mentioned above. By
assuming a meaningful relation between social media
data and the society’s state of mind, Pak (2010)
examines twitter as a corpus for opinion mining and
concludes that it is possible to foresee real-life social
events from it using methods such as sentiment
analysis. In the recent United States elections, Chin
(2016) introduced a method for twitter sentiment
analysis using Emoji characters in tweets to
determine the preferred candidate in each state. Effort
has been made by Tumasjan (2010), Sang (2012)
and
Birmingham (2011) on predicting German Federal
elections and Dutch senate elections. The past
literature lacks a reliable data gathering method;
where the data mined from the social media is not
sampled uniformly, and hence may not accurately
represent the pool of online users. In addition, in some
works heuristic assumptions are made in order to
derive the final result. For instance, in Sang (2012) it
is assumed that the number of a candidate’s
supporters are directly taken as proportional to the
number of tweets which contain the candidate’s
Kassraie, P., Modirshanechi, A. and Aghajan, H.
Election Vote Share Prediction using a Sentiment-based Fusion of Twitter Data with Google Trends and Online Polls.
DOI: 10.5220/0006484303630370
In Proceedings of the 6th International Conference on Data Science, Technology and Applications (DATA 2017), pages 363-370
ISBN: 978-989-758-255-4
Copyright © 2017 by SCITEPRESS – Science and Technology Publications, Lda. All rights reserved
363

name, regardless of the tweets' sentiment. As a result
of these errors, other researchers have even
questioned the validity of social media content for
forecasting events and movements (Metaxas, 2010;
Mustafaraj, 2011; Metaxas, 2011).
In this paper, we develop an accurate method for
mining election-relevant data for a statistically
correct prediction of the outcome. We have gathered
a reliable large-scale dataset from twitter and Google
Trends search interests, which is highly correlated
with real trends of US 2016. We have applied
Gaussian process regression to estimate weekly
predictions. Unlike other papers, this model is built
on predicting the candidates vote shares instead of an
absolute winner. This paper proceeds as follows. In
section 2 our method for predicting a large-scale
election is described. In section 3 the method is
applied to the data from the 2016 US elections and
concluding remarks are mentioned in section 4.
2 THE METHOD
Four main steps are followed in this method. First, a
uniformly sampled large dataset of tweets is gathered.
This data is then processed and augmented by adding
sentiment information to each tweet, collecting
relevant keywords data from Google Trends, and
arranging various online poll results. The authenticity
of this data is then checked with a correlation test. In
the end, a feature matrix is created and the Gaussian
process regression model is trained.
2.1 Data Collection
Social political events often have a short time span
and great complexity. As mentioned in DiGarzia
(2013), large datasets of online social content must be
used to achieve accurate results. The online data
sources used in this paper are twitter and Google
Trends, as well as the online election polls held by
polling firms and news reports, such as HuffPost
pollster. These online polls are refined and later used
as labels when training the model. These surveys are
scattered over time, thus, the online polls are arranged
chronologically and a final poll result is calculated for
each week by adding the weighted sum of the surveys
held in that week. Poll results are used as labels when
training the statistical model.
The data has been gathered from public tweets
containing the candidates’ names with a high
sampling rate of 1000 tweets per day per candidate
during active election months (about 6 months for US
Election). It should be mentioned that the method was
also applied to a dataset of 100 tweet per day per
candidate, which resulted in undesirable outcomes.
Around 370,000 tweets are gathered, however, about
70,000 repetitious tweets contain both candidates’
names which are then removed, resulting in a final
300,000 tweet dataset. Despite what was stated in
Sang (2012), the number of tweets containing a
candidate’s name does not necessarily reflect the
user’s election votes. Thus, the tweets’ sentiment
needs to be taken into account. Table 1 demonstrates
this fact in an example in which it is unlikely for the
first user to vote for Clinton.
The sentiment of a sentence can be analyzed using
the grammatical structure and the choice of words.
The RNTN algorithm (Socher, 2013) can determine
the sentiment of a phrase as positive or negative with
an accuracy rate of 80.7%. Due to processing
limitations, a simpler algorithm is used in our
experiment (Bose, 2017; Rinker 2017).
After eliminating common terms, frequent
hashtags and words are extracted from the twitter
data, and manually grouped into meaningful word
sets, 26 sets in our case. Each group contains an
election-relevant term that is used frequently in
tweets. The word representing each set is called a
‘keyword’. This classification is done using common
knowledge on election events. Table 2 explains this
process with an example.
The keywords are later used as search queries for
collecting the Google Trends (2017) data. Google
Trends returns a vector
on ‘Search interest factor’
which presents the popularity of a search query over
time.
Assuming
to be a keyword, we define:
..
≝Google Trends
search interest for keyword
in week ,
∈
1,
,
(1)
where is the total number of weeks in the dataset.
Table 1: An example of why all the tweets containing a
candidate’s name are not posted by their fans.
Sentiment Tweet
Negative
Crooked Hillary: Not In The Pocket Of Anyone
After Receiving $6 Million From Soros
#WakeUpAmerica
Positive
I thought Hillary did well on #60Minutes. So
calm and reasonable. Such a change from the
Republican'ts.
KDCloudApps 2017 - Special Session on Knowledge Discovery and Cloud Computing Applications
364

Table 2: Grouping raw words into keywords.
KeywordRawWords
Bernie
"
bernie","sanders","berniesanders"
Hack
"
hacked","hack","hacking","hackers",
"hacker
","hackinghillary","russianhackers"
GunControl
“gun","guns","guncontrol",
"stopgunviolence
"
Immigration
"
immigration","immigrant","refugees",
"refugee
"
Terrorism
"
terrorist","terrorists","terrorism","terror",
"isis
"
Abortion
"
abortion","abortions","abortionists"
2.2 Evaluation of Data Authenticity
A common mistake in the area of election prediction
is using a dataset which is not correlated with the real-
life social event. The validity of the gathered data
must be determined before going any further.
For each keyword, a popularity vector (
) is
generated using the twitter data. We define:
..
≝
,
,
,∈
1,
,
(2)
where
,
is the total number of tweets in the
dataset from week and
,
is the number of tweets
containing keyword
. These vectors are
concatenated creating the matrix :
..
, 1
, 2
(3)
where is the total number of keywords.
The correlation matrix () between these vectors
is then calculated:
..
,
,,
∈ 1,2
(4)
A correlation test for every
,
is taken as well,
resulting in a p-value for each cell of , and only the
matrix cells with small p-values (
0.05 are
taken into account. There are 3 types of cells. First,
the cells showing the correlation of a keyword from
twitter with the search interest of a keyword in
Google Trends. Second, cells exhibiting the
correlation of two keywords’ popularity both from
twitter, and the third, cells showing correlation of two
keywords’ search interest from Google Trends.
After comparing values of the cells from each of
these types with the external information the authors
had on the election events, conformities were found
between twitter, google trends and the real-world
events. This confirms that our previous choice of data
gathering sampling rate (1000 tweets per day per
candidate) has been fine enough to create a
statistically relevant dataset to train a valid statistical
model. It should be noted that if the correlations
mentioned above aren’t seen within and between
twitter dataset and Google Trends, the data gathering
sampling rate must be increased until the datasets
describe real-life events properly. Choosing a low
sampling rate may result in an unreliable feature
matrix.
Figure 1 shows Spearman correlation matrices for
US 2016 election keywords. Cells with large p-values
are set to zero. For instance, keywords ‘WikiLeaks,
Russia, Email’ are highly correlated, whether chosen
from twitter or Google Trends; these words were also
related in the election news.
Twitter dataset is then narrowed down to the
tweets containing these validated keywords and later
used to form a feature matrix, such that the relevance
between the world events and social media is
maintained.
2.3 Feature Extraction
In order to evaluate the effect of adding tweets’
sentiment to the analysis, two feature matrices are
created, where only one of them includes sentiment
information. In sentiment analysis, a value ∈
1,1 is assigned to the sentences. For a keyword
we define:
,
,
,
..
,
is the
sentiment value of the
th
tweet containing
keyword
in week
(5)
where
,
is the total number of tweets in week
including the keyword
. Each row in the feature
matrix corresponds to a meaningful time interval i.e.
one week for the US Elections. A row in either of the
feature matrices consists of previous week’s vote
shares as well as Google Trends and twitter
popularity statistics such as the mean, variance, upper
and lower quantile values, etc. One feature matrix
also includes the statistics for each
,
vector.
For instance in week (row ), statistics are
included for each
,
where .
As previously explained, the refined online poll
results are used as labels, making the sample size
small, i.e. equal to , the number of weeks. PCA is
applied to the feature matrix to reduce the number of
Election Vote Share Prediction using a Sentiment-based Fusion of Twitter Data with Google Trends and Online Polls
365
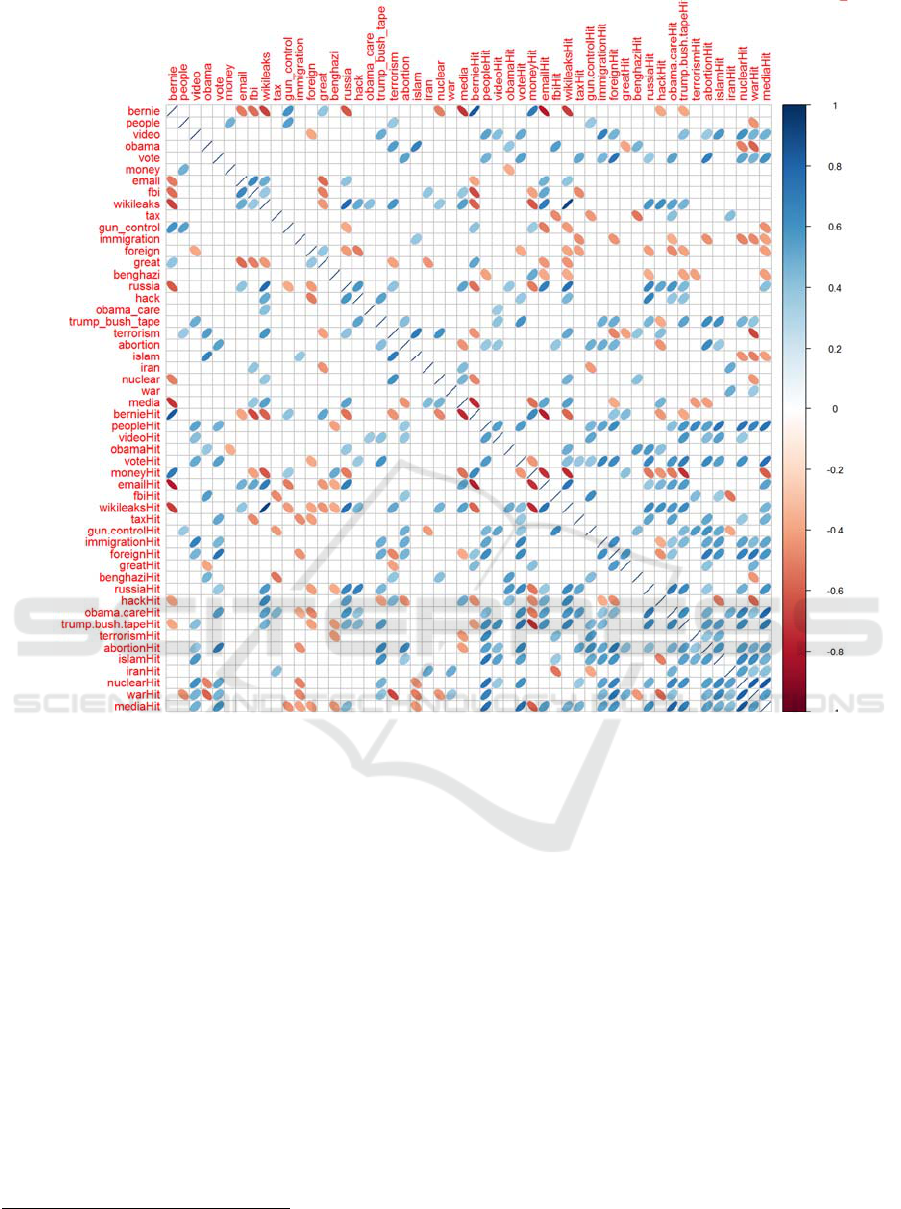
Figure 1: Spearman correlation matrix for US 2016 Election keywords.
dimensions. Using the first components of the
principal components as the final feature matrix, it is
guaranteed that the regressors’ dimensions are
perpendicular and thus uncorrelated. This satisfies the
conditions of the linear model, resulting in an
accurate prediction.
2.4 Statistical Model
The vote shares of online polls from earlier weeks
contain important information which can be used in
the current week’s estimation. Unlike other papers we
treat the vote shares as time series and use Gaussian
process regression instead of guessing the election
winner with a classifier. Comparing our results with
similar works, we demonstrate that Gaussian process
regression achieves more promising predictions than
1
The dataset is available at: https://drive.google.com/drive/
folders/0Bwy0w0vFyfpIZU9QdmprRmRJbU0?usp=sharing
other methods.
3 IMPLEMENTATION ON THE
US 2016 ELECTIONS
In this section we use the method explained above to
predict the results of the 2016 US Elections. With a
sampling rate of 1000 tweets per day for a span of 6
months, a dataset of more than 370,000 tweets is
gathered
1
. Keywords are then extracted and the
corresponding Google Trends data is also collected
with GtrendsR package
(Massicotte, 2017). The
tweet sentiments are analyzed using the packages
Rsentiment (Bose, 2017) and SentimentR (Rinker,
2017). The accuracy of these packages is tested
(Table 3) with a manually labeled dataset (Kotzias,
KDCloudApps 2017 - Special Session on Knowledge Discovery and Cloud Computing Applications
366

2015). Eligibility of this data is checked with the
authors’ knowledge on US2016. Using PCA, the first
20 components are kept as the final feature matrix.
The dataset of raw online poll results
(FiveThirtyEight, 2016) is refined and used as sample
labels.
Figures 2, 3, 4 and 5 show the result of using
Gaussian process regression on the data described
above. Red dots are the actual outcomes and blue dots
show the predicted values.
The model foresees election results at the
beginning of the election week. Using the jackknifing
(Efron, 1982) the error distribution of our model is
estimated. In Table 4, it can be seen that 80% of the
variations in Clinton’s vote share is explained with an
error of 0.74%.
Table 3: Estimated accuracy rate of two R packages for
sentiment analysis.
Accuracy Package
74.7% Rsentiment
84.0% SentimentR
Table 4: Error estimations, mean error and R-squared.
Adjusted R
2
Mean erro
r
Sentiment Candidate
0.800.74% Not Included
Clinton
0.820.50% Include
d
0.491.10% Not Included
Trump
0.431.08% Include
d
Finally, the model is tested for the election day
(Table 5). Clinton’s vote share has been predicted
quite accurately; however, Trump’s vote share is
rather unpredictable. This can be explained by the
behavior of some Trump’s supporters, who might
have not expressed their opinion in polls, or were not
as active on social media as Clinton’s supporters.
This difference in behavior has been reported in
various post-election analytical reports (Mosh Social
Media, 2017)
4 CONCLUSION
We conclude that Twitter and Google Trends can be
employed as mirrors reflecting the public opinion on
large-scale political events such as elections, aiding
us with a powerful tool to forecast these events.
However, for the following reasons our method might
fail in some cases. Not all of the voters are twitter and
google users. It must be mentioned that social media
isn’t always reliable, having active spammer robots,
etc. These problems can be solved in the future with
tracking each user’s behavior over time for validating
the consistency or trend of their opinion. We finally
suggest that time series models, such as Gaussian
process regression, provide us with more information
on the political phenomena (e.g. a continuous
variable such as vote share) and lower prediction
error compared to ordinary classifiers, i.e. Support
Vector Machines.
Table 5: US 2016 vote share prediction prior to the election day.
Clinton Trump Description
45% 40% Estimated vote share without sentiment
47% 40% Estimated vote share with sentiment
48.0% 45.9% US 2016 Election results (Popular Vote)
Election Vote Share Prediction using a Sentiment-based Fusion of Twitter Data with Google Trends and Online Polls
367
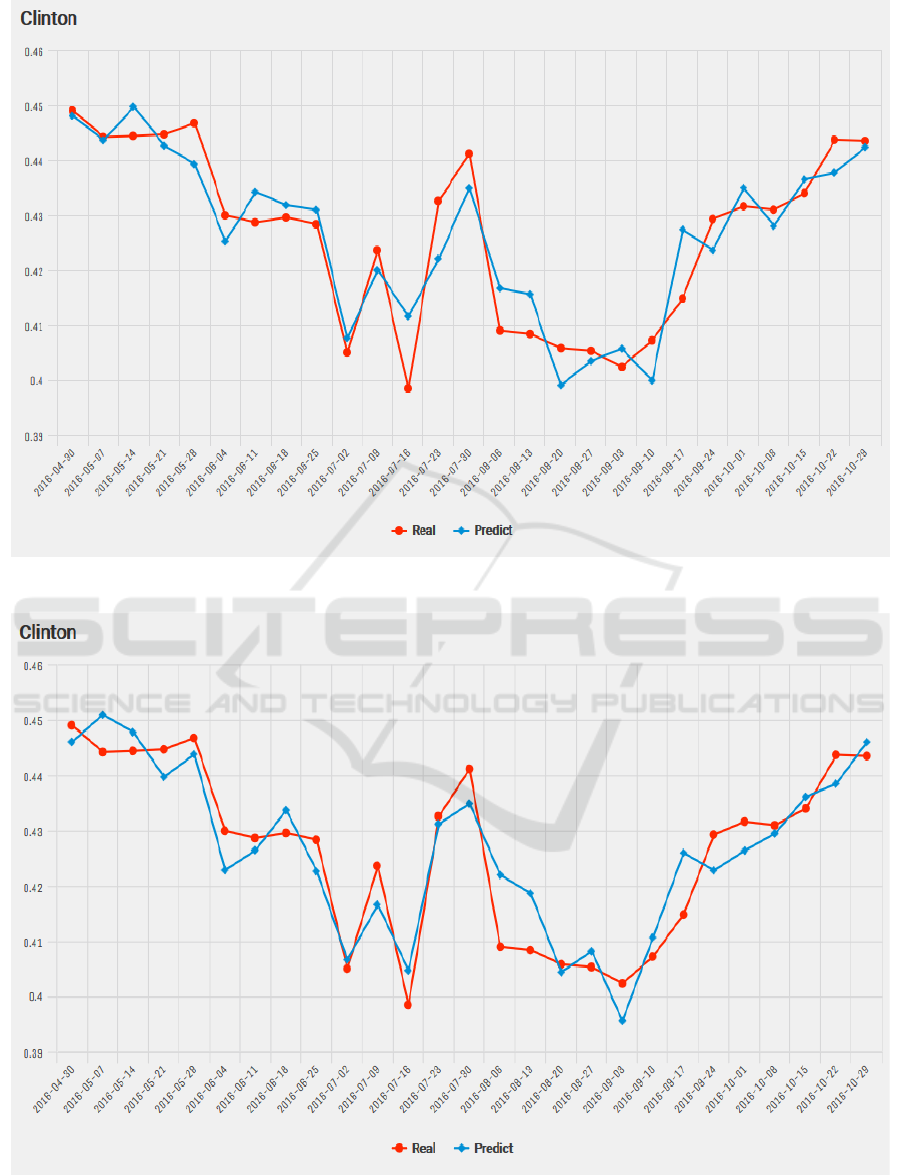
Figure 2: Predicting online election polls without sentiment data for Clinton.
Figure 3: Predicting online election polls with sentiment data for Clinton.
KDCloudApps 2017 - Special Session on Knowledge Discovery and Cloud Computing Applications
368
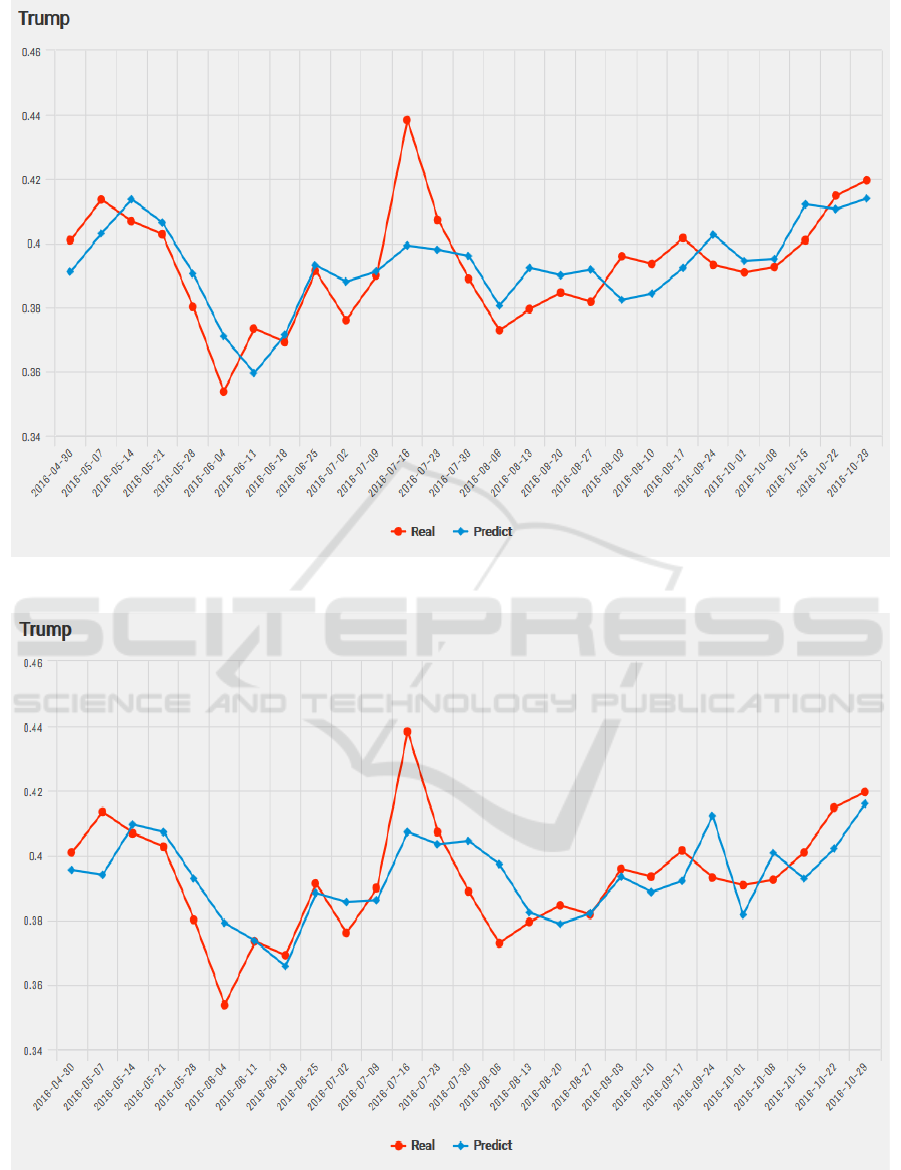
Figure 4: Predicting online election polls without sentiment data for Trump.
Figure 5: Predicting online election polls with sentiment data for Trump.
Election Vote Share Prediction using a Sentiment-based Fusion of Twitter Data with Google Trends and Online Polls
369

ACKNOWLEDGMENTS
The first two authors acknowledge helpful
discussions with Prof. Kasra Alishahi, Mr. Ahmad
Ehyaei and Mr. Farzad Jafarrahmani.
REFERENCES
Bermingham, A. and Smeaton, A.F., 2011. On using
Twitter to monitor political sentiment and predict
election results.
Bose, S. (2017). CRAN - Package RSentiment. [online]
Cran.r-project.org. Available at: https://cran.r-
project.org/package=RSentiment.
Chin, D. et al, 2016. Analyzing Twitter Sentiment of the
2016 Presidential Candidates.
DiGrazia, J. et al, 2013. More tweets, more votes: Social
media as a quantitative indicator of political behavior.
PloS one, 8(11), p.e79449.
Efron, B., 1982. The jackknife, the bootstrap and other
resampling plans. Society for industrial and applied
mathematics.
Google Trends. (2017). Google Trends. [online] Available
at: https://trends.google.com/trends/.
Henrique, J. (2017). Jefferson-Henrique/GetOldTweets-
python. [online] Available at:
https://github.com/Jefferson-Henrique/GetOldTweets-
python.
Kanjana, J. and Mehta, D. (2017). 2016 Election Forecast.
[online] Projects.fivethirtyeight.com. Available at:
https://projects.fivethirtyeight.com/2016-election-
forecast/.
Kotzias, D., Denil, M., De Freitas, N. and Smyth, P., 2015,
August. From group to individual labels using deep
features. In Proceedings of the 21th ACM SIGKDD
International Conference on Knowledge Discovery and
Data Mining (pp. 597-606). ACM.
Massicotte, P. (2017). Perform and Display Google Trends
Queries. [online] Cran.r-project.org. Available at:
https://cran.r-project.org/package=gtrendsR.
Metaxas, P.T. et al, 2011, October. How (not) to predict
elections. In Privacy, Security, Risk and Trust
(PASSAT) and 2011 IEEE Third Inernational
Conference on Social Computing (SocialCom), 2011
IEEE Third International Conference on (pp. 165-171).
IEEE.
Mosh Social Media. (2017). Propaganda in the age of social
media. [online] Available at:
https://mosh.co.nz/propaganda-age-social-media/
Mustafaraj, E. and Metaxas, P.T., 2010. From obscurity to
prominence in minutes: Political speech and real-time
search.
Mustafaraj, E. et al, 2011, October. Vocal minority versus
silent majority: Discovering the opionions of the long
tail. In Privacy, Security, Risk and Trust (PASSAT) and
2011 IEEE Third Inernational Conference on Social
Computing (SocialCom), 2011 IEEE Third
International Conference on (pp. 103-110). IEEE.
Pak, A. and Paroubek, P., 2010, May. Twitter as a Corpus
for Sentiment Analysis and Opinion Mining. In LREc
(Vol. 10, No. 2010).
Rinker, T. (2017). Calculate Text Polarity Sentiment
[online] Cran.r-project.org. Available at: https://cran.r-
project.org/package=sentimentr.
Sang, E.T.K. and Bos, J., 2012, April. Predicting the 2011
dutch senate election results with twitter. In
Proceedings of the workshop on semantic analysis in
social media (pp. 53-60). Association for
Computational Linguistics.
Socher, R., Perelygin, A., Wu, J.Y., Chuang, J., Manning,
C.D., Ng, A.Y. and Potts, C., 2013, October. Recursive
deep models for semantic compositionality over a
sentiment treebank. In Proceedings of the conference
on empirical methods in natural language processing
(EMNLP) (Vol. 1631, p. 1642).
Tumasjan, A. et al, 2010. Predicting elections with twitter:
What 140 characters reveal about political sentiment.
ICWSM, 10(1), pp.178-185.
KDCloudApps 2017 - Special Session on Knowledge Discovery and Cloud Computing Applications
370
