
A Comparative Study for Cost-Utility Analysis Methods: An
Application to a Case Study on Multicomponent Vaccine against
Meningococcal B Disease
Paolo Landa
1
, Elena Tànfani
2
and Angela Testi
2
1
Medical School, University of Exeter, Heavitree road, EX1 2LU, Exeter, U.K.
2
Department of Economics and Business Studies, University of Genoa, 16126 Genoa, Italy
Keywords: Discrete Event Simulation, Decision Tree, Markov Model, Cost-Utility Analysis, Health Technology
Assessment, Health Economics.
Abstract: The aim of this study is to explore and compare the results of application of three different modelling
techniques used to perform Cost-utility Analysis in Health Economics and Health Technology Assessment
(HTA). The three modelling techniques described are Decision Tree, Markov model and Discrete Event
Simulation. For each of these modelling techniques was evaluated the introduction of a multicomponent
serogroup B meningococcal vaccine. The preliminary cost-utility analysis herein developed considers societal
perspective, and evaluates the impact of vaccination on Italian infants less than one year of age. The models
validation and the Incremental Cost-Effectiveness Ratio (ICER) resulting from each technique are reported,
in preliminary results each modelling technique gives different ICER, depending on the modelling technique.
1 INTRODUCTION
In Health Economics and Health Technology
Assessment (HTA) the use of modelling techniques is
strongly recommended for the introduction of a new
device, drug, clinical pathway, vaccine or other
instruments that can have an impact on patients’
health and on National Health Service (NHS)
budgets. For the decision-maker, usually represented
by NHS, it is important to know the incremental cost-
effectiveness of the technology that represents the
change in cost and effectiveness achieved by the new
technology compared with current practice. In
international literature the main modelling techniques
applied to evaluate the introduction of new
technologies are: Decision Tree, Markov Model and
Discrete Event Simulation. Each technique has its
strength and weak characteristics that enable the
method to be the best to fit the analysis.
While in the literature the use of Decision Tree
and Markov models are the main techniques applied
for Cost Effectiveness Analysis (Muennig and
Bounthavong, 2016), the adoption of DES is recent.
Decision trees are simple and directed graph
without recursion and they represent a formal way to
describe decisions, embodying the paradigm of
decision analysis. Each decision can be divided into
three components: the decision node (the
representation of the moment when the decision
maker has to do a choice between competing
strategies), the decision strategy (represented by the
set of actions or events consequent to a certain
decision) and the outcome nodes (which represent the
outcome in cost and effectiveness).
Even if it is the simplest method of analysis, the
use of decision trees (Aleem et al., 2009) presents
some limitations from the perspective of performance
and outcome analysis. Firstly simplification errors
may occur when measuring the final outcome of
treatment decisions with values such as quality-
adjusted life years (Van der Velde, 2005; Naglie et
al., 1997). It is also difficult to perform adequately an
analysis considering the variation of some parameters
during a long time horizon in a clinical environment
(Aleem et al., 2009) and various factors (including
expenses and patient preferences for medical
services) are involved in the decision-making
process, and these cannot be accurately reflected in a
decision tree (Burch et al., 2012; Bhandari et al.,
2003).
Markov models are cyclic directed graphs used
when a decision problem has the exposure to some
Landa, P., Tànfani, E. and Testi, A.
A Comparative Study for Cost-Utility Analysis Methods: An Application to a Case Study on Multicomponent Vaccine against Meningococcal B Disease.
DOI: 10.5220/0006490201630170
In Proceedings of the 7th International Conference on Simulation and Modeling Methodologies, Technologies and Applications (SIMULTECH 2017), pages 163-170
ISBN: 978-989-758-265-3
Copyright © 2017 by SCITEPRESS – Science and Technology Publications, Lda. All rights reserved
163

risks or events is variable or changes during a certain
time horizon. Most of Markov models used in
healthcare are semi-Markov state transition models,
where state transitions can vary during the time
horizon (Stahl, 2008).
DES is a very flexible modelling method in which
entities may interact or compete with each other for
resources in a system. Every interaction between
entities (with each other or with the resources in the
system) is an event. Every interaction changes the
state of the entity involved and of the system as a
whole (Stahl, 2008).
The time between each event can be handled
probabilistically, using fixed time increments, or
both, depending on the nature of the system being
modelled. DES are composed by entities, attributes,
queues and resources. In a simulation model entities
are objects characterised by attributes, usually entities
are represented by patients or element of a chain, such
as products, that can interact with the other entities
inside the system. Entities are the main element of the
simulation and are generated in the beginning of the
model or during the execution.
Attributes are specific characteristics of each
entity, represent the information of the entity such as
the chronic disease of a patient, the health status if we
consider patients as entities. Attributes can vary
during the simulation and they are very important in
the simulation when the entity interact with other
entities inside the system or when some events
occurs.
Events are actions or things that can occur inside
the simulation environment or to an entity (e.g. an
infection or a virus that change the health status of a
patient). Resources are represented by service
providers for entities inside the model. Most of the
resources are limited (e.g. the nurses of a Cardiology
Unit or the MRI machines inside a Radiology
department). When resources are used by entities,
other entities have to wait, creating a queue. Queues
are managed following several rules, depending also
on the modeller choice (e.g. priority queues, First In -
First out, Last In – First out). All the elements above
described work and interact and compete in a specific
frame of time, usually it is the period time to represent
the system. (Karnon et al., 2002)
The disadvantage of cost-effectiveness analysis
limitations and inaccuracies of Markov models are
easily avoided with the use of DES. In literature
several studies describe the principles and the
methodologies of decision-analytical modelling for
Health Technology Assessment (Sun and Faunce,
2007).
In this study three modelling techniques were
applied to verify the cost utility of the introduction of
a new multicomponent vaccine for the Neisseria
meningitidis serogroup B (NmB) in the Italian NHS
context.
The Neisseria meningitidis (Nm) is a gram
negative bacterium that cause meningitis or other
forms of meningococcal diseases. Even if the
incidence of this disease in Italy has low values, the
diseases caused by Nm represent a public health
problem that produce a sensible economic impact on
the society (Anonychuk et al., 2013; Davis et al.,
2011). The incidence of disease is variable within the
geographical areas (Harrison et al., 2009), since after
the introduction of meningococcal serogroup C
vaccination, the serogroup B has become the main
agent of meningococcal disease. The disease most
affects children under one year of age are mainly
affected. In Italy, about 60% of typed cases of
meningococcal disease are now caused by NmB
(European Centre for Disease Prevention and
Control, 2010; Istituto Superiore di Sanità, 2014).
2 MODEL DESCRIPTION
In order to perform the technique comparison on
Cost-utility evaluation three models with three
techniques were developed: Decision tree, Markov
and DES models. The three techniques were
developed using respectively TreeAge® Pro 2015,
Microsoft Excel® 2013 and Lanner Witness® 2016.
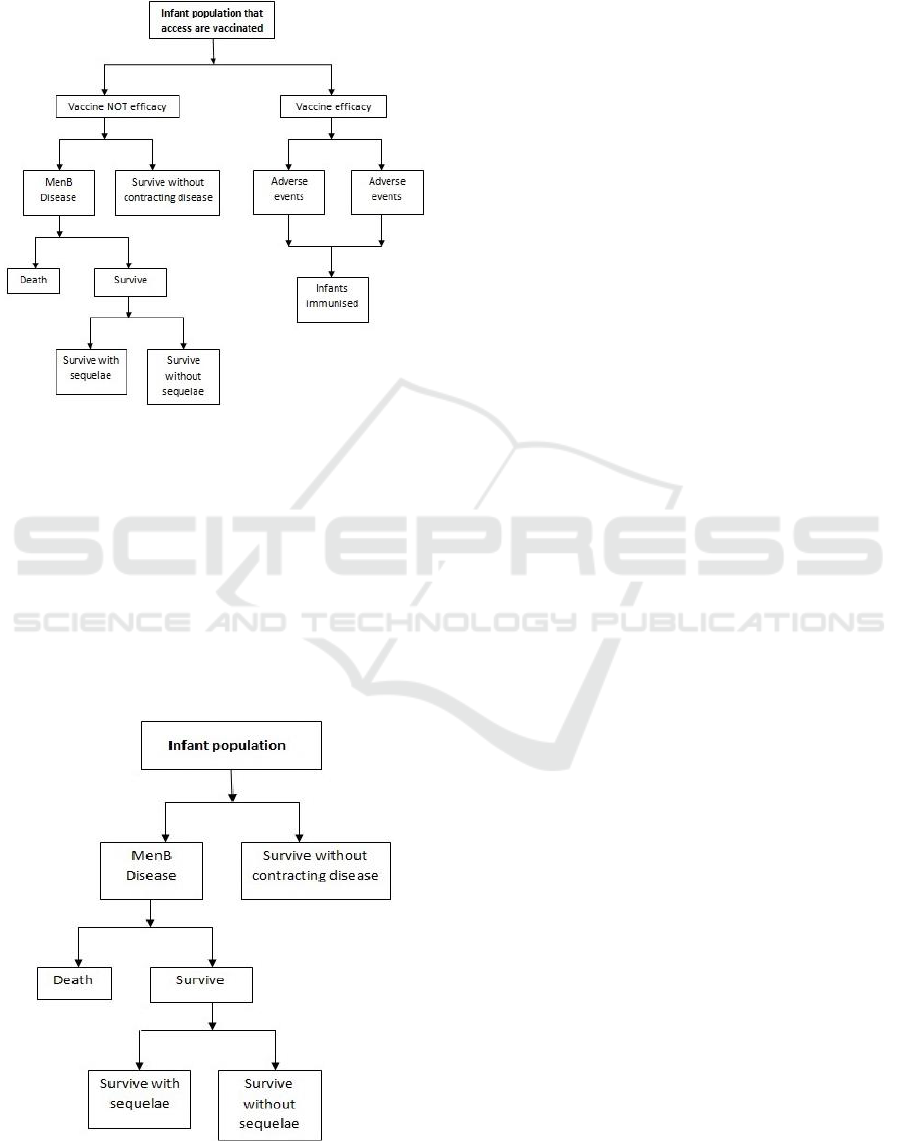
2.1 Decision Tree Model
The decision tree herein presented (Figure 1) belongs
to a previous study developed for economic
evaluation of Bexsero® vaccine in Italy (Gasparini et
al., 2016).
Figure 1: Decision tree model.
SIMULTECH 2017 - 7th International Conference on Simulation and Modeling Methodologies, Technologies and Applications
164
The tree is composed firstly by the choice node
where begin the two branches representing the
strategies: “Vaccinate infant Italian population” and
“Not vaccinate infant Italian population”. Vaccinated
infants can be immunised or not immunised against
NmB, immunisation depends on the effectiveness of
the vaccine. If infants are immunised then they can
have adverse events or not, usually represented by
allergic reactions or flue. Infant not immunised for the
missed effectiveness of the vaccine can have adverse
event or not, but they have the same conditions and
risks of infants that do not participate to vaccination
program.
Infants that are not immunised can live their entire
life without contracting the disease. If an infant has
the NmB disease, there can be three different health
status: Death, Survive with sequelae (the
consequence of the disease represented by chronic
diseases or disabilities) and Survive without sequelae.
The list of possible sequelae are: Amputation with
substantial disability, Anxiety, Arthritis, Depression,
Motor Deficits, Blindness, Epilepsy or Seizure,
Severe Neurological Disability, Mental retardation
(cognitive problems), Hearing loss with cochlear
implantation, Moderate/Severe bilateral Hearing loss,
Moderate/Severe unilateral Hearing loss, Renal
Failure, Chronic migraine, Skin necrosis, Scars and
Severe Speech or communication problem.
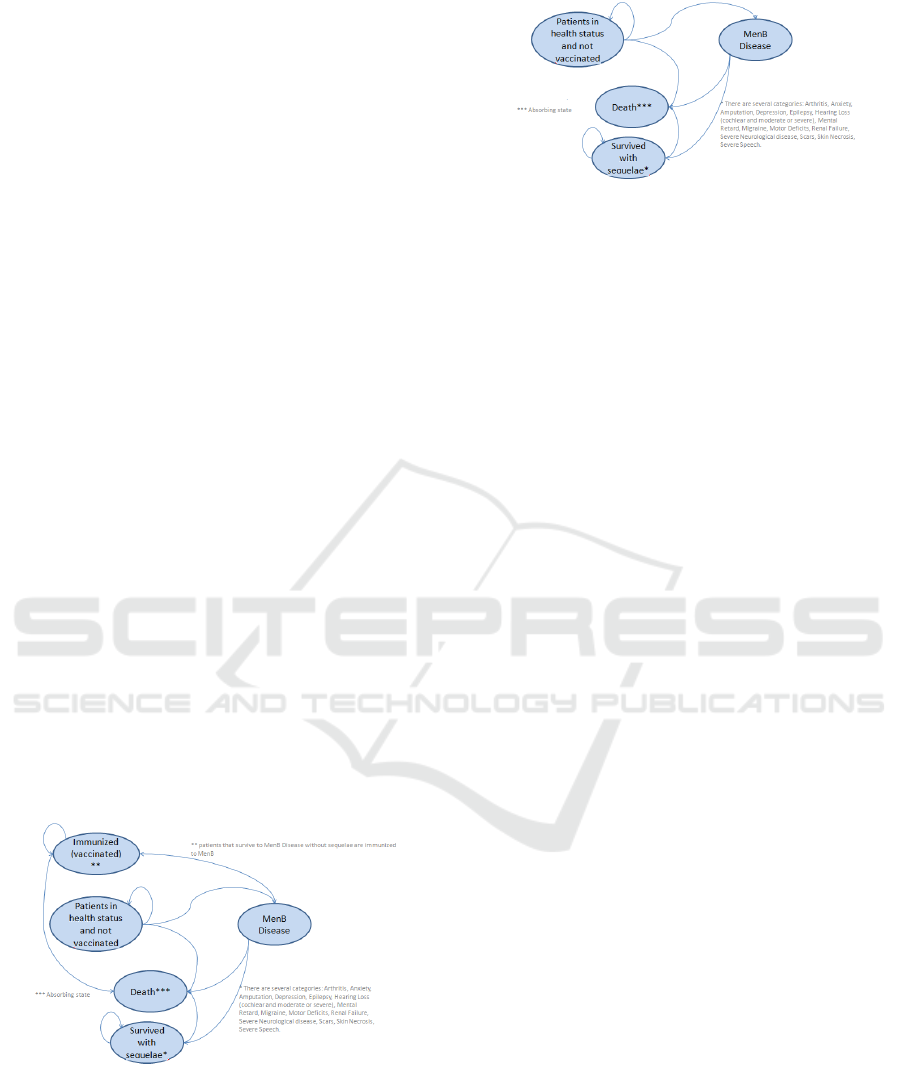
2.2 Markov Model
Markov models are widely adopted into Cost-
Effectiveness Analysis. The model herein developed
is split into two sub-models: Vaccination program
(Figure 2) and No Vaccination program (Figure 3).
Figure 2: Markov model for vaccination program.
The first model is composed by five status:
Patients in health status and not vaccinated,
Immunized (vaccinated), MenB disease, Death and
Survived with sequelae. Firstly all infants are in a
good health status and are not vaccinated. If the infant
Figure 3: Markov model for no vaccination program.
population is vaccinated then there can be two status:
infant that are immunized change the status into
“Immunized”, while not immunized infants are still
in the previous status. Infants that will have NmB
disease pass through the transitional status “MenB
Disease” and consequently transferred into one the
following health status: “Death” if infant dies,
“Survived with sequelae” if infant survives with
sequelae and “Patients in health status and not
vaccinated” if infant survives without sequelae. The
No Vaccination program model has the same
configuration but it is not considered the
“Immunized” health status for the missing
vaccination program. The absorbing state for each
model is “Death”.
2.3 Discrete Event Simulation Model
Simulation enables to develop models built to
determine the response of a system to changes in its
internal structure and inputs. It can reproduce a
simplified representation of a dynamic process that is
too complex for a direct analysis, considering that it
is a cheaper and simple tool for analysts.
Two DES sub-models were developed: the first
sub-model shown in Figure 4, represents and
describes the clinical pathway that infants have to
follow when they are vaccinated (vaccination model).
The second sub-model, shown in Figure 5, describes
the actual scenario where all the infants are not
vaccinated against NmB (the so-called
“comparator”).
2.3.1 Vaccination Model
Infants when are vaccinated can be immunized or not,
considering the effectiveness of the vaccine. If the
vaccine is effective then the infant is immunized and
protected for lifetime. If vaccine is effective then
there can be adverse or not adverse events (high body
temperature or allergic reaction). Infants not
immunized can acquire the NmB during their life of
survive without contracting the disease. If infants
acquire the NmB disease can die, survive without
A Comparative Study for Cost-Utility Analysis Methods: An Application to a Case Study on Multicomponent Vaccine against
Meningococcal B Disease
165
sequelae or survive without sequelae. The description
of the pathway for vaccinated infants is shown in
Figure 4.
Figure 4: Flow chart for Vaccination model.
2.3.2 No Vaccination Model
The second DES model (Figure 5) describes the
actual scenario where infants are not vaccinated and
consequently not immunized against NmB. If the
National Health Service does not include vaccination,
infants can live their whole life without contracting
the disease. If during their life they acquire the
disease, then infants can have two possible outcomes:
death or Survive. Survivors are divided into two
different categories: without or with sequelae.
Figure 5: Flow chart for No Vaccination model.
2.3.3 Elements of DES Model
Infants are entities in the model and correspond to the
number of infants born in a year.
Once infants are generated by the simulator, then
they are sent to the “Vaccination” queue, where the
“Vaccination” resource distribute infants into
“Adverse Events”, “No Adverse Events” and “No
Vaccination” queues. These queues contain
respectively infants that had adverse events after the
vaccination cycle, that had not any adverse event and
that were not immunized by the vaccine
(unprotected).
This last resource named “No Vaccinated Flow”
collects patients that are not vaccinated or
unprotected and submit them to the “Incidence”
resource, that distribute entities into “Disease” and
“No Disease” queues. Infants that have the disease are
hospitalized and the resource “Effect of Disease”
distribute them into “Deaths”, “Survival with No
Sequelae”, “Sequelae” (with the different sequelae
reported previously) queues. The distribution of
elements inside the model follows the probability
distributions described in Gasparini et al. (2016).
3 CASE STUDY
3.1 General Characteristics
The three modelling techniques were applied to the
Italian epidemiological scenario of 2012. Data used
in this study refer to a previous study (Gasparini et al.,
2016) where a Cost-Utility Analysis was performed
using a decision tree model.
3.2 Model Parameters, Costs and
Utilities
A detailed specification of data, incidence of disease,
model assumptions, cost and outcome values and
distribution is herein reported.
The main parameters and assumption respect the
criteria given by Italian guidelines for economic
evaluation in healthcare (AIES, 2009; Capri et al.,
2001). The adoption of discount rate for both costs
and utilities is needed to evaluate the relative values
during the long time horizon. The probability of
disease is provided by the Italian Institute of
Healthcare (Istituto Superiore di Sanità) and it is
related to NmB cases occurred annually in Italy from
2007 to 2012. The vaccine herein evaluated is
supposed to give a full lifetime protection. In Table 1
general model parameters are reported.
SIMULTECH 2017 - 7th International Conference on Simulation and Modeling Methodologies, Technologies and Applications
166

Table 1: General model parameters.
Parameter
Value
Probability of disease
0.0000023
Vaccine compliance
0.9
Discount rate for costs and utility
0.03
Probability of death
0.0673
Probability of Amputation with
substantial disability
0.01
Probability of Anxiety
0.068
Probability of Arthritis
0.025
Probability of Depression
0.05
Probability of Motor deficits
0.019
Probability of Blindness
0.004
Probability of Epilepsy or Seizure
0.02
Probability of Severe Neurological
disability
0.021
Probability of Mental retardation
(cognitive problems)
0.254
Probability of Hearing loss requiring
cochlear implantation
0.02
Probability of Moderate/severe bilateral
hearing loss
0.05
Probability of Moderate unilateral
hearing loss
0.05
Probability of Skin necrosis
0.015
Probability of Scars
0.03
Probability of Severe speech or
communication problems
0.037
Probability of Renal failure
0.019
Probability of Chronic migraine
0.10
Probability of Survive without sequelae
0.402
Outcomes were measured using Quality Adjusted
Life Years (QALYs), one of the main measures of the
value of health outcomes. The classification system
assumed for QALY was EuroQoL EQ-5D. In Table 2
are reported annual health outcomes for all the health
status related to the NmB sequelae, death and
survival.
Costs reported in the model are annual costs in
Euro (€) currency at January 2013 values, previous
years costs were adjusted to January 2013 levels. Four
categories were defined for costs: Direct costs related
to meningococcal sequelae, Indirect costs related to
meningococcal sequelae, Costs related to acute phase
of disease and Costs associated to vaccination (Table
3).
The first category represents all the direct cost
associated to sequelae (e.g. the direct cost of
seizures), while the second category includes social
costs that indirectly affect patients with the sequelae
(e.g. the special education needed in school for
children with cognitive problems, or the lost income
of a parent that had to quit the job to follow the child
with severe neurological disability).
Table 2: Health outcomes.
Health status
QALY
Death
0
Survive
1
Amputation with substantial disability
0.613
Anxiety
0.687
Arthritis
0.690
Depression
0.729
Motor deficits
0.830
Blindness
0.260
Epilepsy or Seizure
0.830
Severe Neurological disability
0.060
Mental retardation (cognitive problems)
0.541
Hearing loss requiring cochlear
implantation
0.810
Moderate/severe bilateral hearing loss
0.910
Moderate unilateral hearing loss
0.910
Skin necrosis
0.900
Scars
1.000
Severe speech or communication problems
0.390
Renal failure
0.820
Chronic migraine
0.814
Table 3: Costs for economic evaluation.
Cost
Euro(€)
Amputation with substantial disability
7,339
Anxiety
1,146
Arthritis
1,184
Depression
3,192
Motor deficits
7,682
Blindness
4,076
Epilepsy or Seizure
2,272
Severe Neurological disability
94,880
Mental retardation (cognitive problems)
7,507
Hearing loss requiring cochlear
implantation
6,327
Moderate/severe bilateral hearing loss
3,163
Moderate unilateral hearing loss
3,163
Skin necrosis
1,066
Scars
533
Severe speech or communication problems
9,796
Renal failure
56,126
Chronic migraine
892
Medical care: cost of hospitalization per
case
7,900
Public Health Response
3,223
Acute phase lost productivity of parent or
relatives
870
Acute phase lost productivity of patient
1,426
Special case education
14,556
Lost productivity of parent
24,500
Lost productivity of patient
24,500
Primary cycle of vaccination (4 doses)
200
Vaccine administration per dose
5.80
Hospitalization for 1 anaphylactic reaction
1175
Mild or moderate adverse event
3.40
A Comparative Study for Cost-Utility Analysis Methods: An Application to a Case Study on Multicomponent Vaccine against
Meningococcal B Disease
167

The costs of acute phase of disease is the third
category and it represents the costs bore by the
national healthcare system and the society during
both the hospitalisation and the treatment of the
individuals that might be at risk of NmB (e.g. the
DRG of hospitalisation and the chemoprophylaxis
treatment). Also were considered indirect costs of
parents and patient during the acute phase of the
disease, represented by the missing income of parents
and patient during the hospitalisation. The fourth and
final category is the costs associated to vaccination,
where are included the cost of the vaccine, the cost of
administration of the vaccine, the costs of
anaphylaxis reaction and the mild or moderate
adverse event, usually managed with one box of
paracetamol.
4 PRELIMINARY RESULTS
4.1 Model Validation
In order to perform a validation it is necessary to
compare the model predictions with data used to in
the simulation model (Eddy, 1985).
There is not a simple and universally applicable
procedure to apply for model validation. Each case
can be considered by itself, but to simplify it can be
achieved identifying the desirable characteristics in
the reporting of cost-effectiveness models (Mc Cabe
and Dixon, 2000).
The first validation was done for the Decision tree
model, where using the strategy of “No Vaccination”
was checked if the results were corresponding in
terms of incidence, deaths, survival with and without
sequelae and number of patients with the sequelae.
This first validation gave the same results as the
actual epidemiological scenario without the
vaccination program.
Model validation was performed using the
following values for “No vaccination” and
“Vaccination” sub-models of Decision Tree, Markov
and DES models. For model validation the following
values were selected: the total number of infant in the
model, the number of deaths for NmB disease, the
number of sequelae, the number of infants without
sequelae. In Table 4 the validation show a slight
variation within the models. This small variation is
given by the characteristics of each techniques, where
events can happen at the end of a cycle or in a
particular point in time.
Table 4: Model validation.
Value
Decision
tree
Markov
DES
Infant population
at the end of the
simulation/cohort
531,372
531,372
531,372
No of deaths
(Vaccine Model)
1
1
1
No of infants with
sequelae (Vaccine
Model)
90
90
89
# Survived
without sequelae
(Vaccine model)
11
12
12
# deaths (No
Vaccine Model)
7
7
8
# infants with
sequelae (No
Vaccine Model)
43
42
43
# Survived
without sequelae
(No Vaccine
model)
55
55
56
4.2 ICERs Comparison
Incremental Cost Effectiveness Ratio (ICER) is used
in economic evaluation in health economics to
evaluate a new technology (e.g. drugs, vaccines,
therapeutics) and compare it with other technologies.
The evaluation requires different results in order to
confirm or not the introduction of a new technology,
one of these results is the incremental cost-
effectiveness ratio (ICER), which is the ratio of the
change in costs of a new technology (compared to the
alternative, such as doing nothing or using the best
available alternative treatment) to the change in
effects. For the three techniques the corresponding
ICER were reported in Table 5.
Table 5: ICER values for DT, MM and DES techniques.
Modelling technique
Value (€)
Decision Tree
109,762
Markov Model
117,713
Discrete-Event Simulation
115,675
Considering a threshold value defined by the
National Health Technology Assessment guidelines
(Capri et al., 2001) of € 40,000.00, the introduction of
vaccine is not advisable for the Italian
epidemiological scenario.
The ICER values given by each technique are
different and each variation in the result can be
explained by the characteristics of model adopted for
cost-utility evaluation. Decision tree is not able to
represent the future events that depends on previous
SIMULTECH 2017 - 7th International Conference on Simulation and Modeling Methodologies, Technologies and Applications
168

events in the time (e.g. herd immunity). It is possible
to achieve it with data approximation of these events,
by modelling data with a detailed analysis, usually
with the joint use of commercial spreadsheets and
dedicated software, but these approximations can
affect the final result.
The Markov Model can better represent the
decision problem involving risk that is continuous
over time, considering the timing of events and the
possibility that events may happen more than once
(Sonnenberg and Beck, 1993). As the ability of
Markov models consists in representing repetitive
events, time dependence of both probabilities and
utilities that allow a more accurate representation of
clinical reality for the model (Briggs and Schulper,
1998), the weakness is in the total missing of
memory. The behaviour of the process subsequent to
any cycle inside Markov models depends only on its
description in that cycle. This means that the process
has no memory for earlier cycles (Sonnenberg and
Beck, 1993). Finally DES provides a flexible
approach to represent complex systems (Law, 2007)
and, its ability enable this technique to be one of the
better techniques to perform Cost-Effectiveness
analysis (Karnon et al., 2012, Caro et al., 2010).
Events can happen in any moment in the time (not in
the beginning of the end of the cycle as Markov
models), being able to better represent reality.
5 CONCLUSIONS
The choice of modelling technique is very important
in Health Technology Assessment for the economic
evaluation and the study of impact of the introduction
of a new technology in a National Healthcare System.
In this study each of these techniques were applied to
evaluate the introduction of a new vaccine against
Neisseria meningitidis serogroup B. For each model
developed was described the characteristics and the
composition in detail. The three techniques were
validated and it was computed the Incremental Cost
Effectiveness Ratio (ICER) and compared to the
Willingness to pay value of € 40,000.00.
The preliminary results show that the introduction
of the vaccine is not advisable in Italy. The
comparison between the three modelling techniques
shows that ICERs resulting have some differences.
The limitation of this study is represented by the
adoption of the same assumptions for each of the
technique. A further study aims at analysing the
techniques with different model assumptions, and to
evidence the main differences in terms of
performance indicators.
ACKNOWLEDGEMENTS
The authors acknowledge support from the Italian
Ministry of Education, University and Research
(MIUR), under the grand FIRB n. RBFR081KSB.
Data was provided by a previous collaboration with
the Department of Health Science (Prof. Roberto
Gasparini, Prof. Donatella Panatto and Dr. Daniela
Amicizia) and the Department of Economics and
Business studies of the University of Genoa (Italy).
REFERENCES
AIES, 2009 Proposta di line guida per la valutazione
economica degli interventi sanitari in Italia
PharmacoEconomics – Italian Research Articles;
11(2):83-93.
Aleem, I. S., Jalal, H., Aleem I. S., Sheikh, A. A., Bhandari,
M., 2009 Clinical decision analysis: incorporating the
evidence with patient preferences. Patient Prefer
Adherence, 3:21-24.
Anonychuk, A., Woo, G., Vyse, A., Demarteau, N., Tricco,
A. C., 2013 The cost and public health burden of
invasive meningococcal disease outbreaks: a
systematic review. Pharmacoeconomics.31(7) 563-76.
Bhandari, M., Devereaux, P. J., Swiontkowski, M. F.,
Tornetta, P., Obremskey, W., Koval, K. J., et al., 2003.
Internal fixation compared with arthroplasty for
displaced fractures of the femoral neck. A meta-
analysis. J Bone Joint Surg Am. 85-A:1673-1681.
Briggs, A., Sculpher, M., 1998. An introduction to Markov
modelling for economic evaluation.
Pharmacoeconomics. 13(4):397-409.
Burch, J., Hinde, S., Palmer S., Beyer F., Minton J., Marson
A., et al. The clinical effectiveness and cost-
effectiveness of technologies used to visualize the
seizure focus in people with refractory epilepsy being
considered for surgery: a systematic review and
decision-analytical model. Health Technology
Assessment 2012; 16:1-157.
Capri, S., Ceci, A., Terranova, L., Merlo, F., Mantovani, L.
2001 Guidelines for economic evaluations in Italy:
Recommendations from the Italian Group of
Pharmacoeconomic Studies. Drug Information Journal.
35:189-201.
Caro, J. J., Möller, J., Getsios, D., 2010. Discrete Event
Simulation: The Preferred Technique for Health
Economic Evaluations? Value in Health 13(8) 1056-
1060
Davis, K. L., Misurski, D., Miller, J., Karve, S., 2011 Cost
impact of complications in meningococcal disease:
evidence from a United States managed care
population. Human Vaccine. 27(4) 458-465.
Eddy, D., Technology assessment: the role of mathematical
modelling. In: Mosteller F., editor. Assessing medical
technologies. Washington, DC: National Academy
Press, 1985: 144-60
A Comparative Study for Cost-Utility Analysis Methods: An Application to a Case Study on Multicomponent Vaccine against
Meningococcal B Disease
169

European Centre for Disease Prevention and Control:
Surveillance of invasive bacterial diseases in Europe
2008/2009. http://www.ecdc.europa.eu. Accessed 2013
Gasparini, R., Landa, P., Amicizia, D., Icardi, G., Ricciardi,
W., de Waure, C., Tànfani,E., Bonanni, P., Lucioni, C.,
Testi, A., Panatto, D., 2016 Vaccinating Italian infants
with a new multicomponent vaccine (Bexsero®) against
meningococcal B disease: A cost-effectiveness analysis.
Human Vaccine and Immunotherapeutiscs 12(8) 111-
222. DOI: 10.1080/21645515.2016.1160177
Harrison, L.H., Trotter, C.L., Ramsay, M.E., 2009 Global
epidemiology of meningococcal disease. Vaccine 27
Suppl 2:B51-63.
Istituto Superiore di Sanità (ISS): Dati di sorveglianza delle
malattie batteriche invasive aggiornati al 10/04/2013.
http://www.simi.iss.it/dati.htm. Accessed May 2014.
Karnon, J., Stahl, J., Brennan, A., Caro, J. J., Mar, J., MD,
Moeller, J., 2012. Modeling Using Discrete Event
Simulation: A Report of the ISPOR-SMDM Modeling
Good Research Practices Task Force–4. Med Decis
Making 32(5):701–711. doi: 10.1177/
0272989X12455462
Law M. A., 2007. Simulation Modeling & Analysis.
McGraw-Hill, 4th ed.
Muennig, P. and Bounthavong M., 2016. Cost-
Effectiveness Analysis in Health: A Practical
Approach. Jossey-Bass, 3
rd
ed.
Naglie, G., Krahn, M. D., Naimark, D., Redelmeier, D. A.,
Detsky, A. S., 1997. Primer on medical decision
analysis: part 3--Estimating probabilities and utilities.
Med Decis Making.17:136-141
Oostenbrink, R., Moll, H. A., Essink-Bot, ML. 2002 The
EQ-5D and the Health Utilities Index for permanent
sequelae after meningitis: a head-to-head comparison.
J Clin Epidemiol; 55:791-99; PMID:12384194;
http://dx.doi.org/10.1016/S0895-4356(02)00448-1
Sonnenberg, F. A., Beck J. R., 1993. Markov Models in
Medical Decision Making. A Practical Guide. Med
Decis Making. 13 (4) 322-338. doi: 10.1177/
0272989X9301300409
Stahl, J. E., 2008. Modelling Methods for
Pharmacoeconomics and Health Technology
Assessment. An Overview and Guide
Pharmacoeconomics 2008; 26 (2): 131-148
Sun, X., Faunce, T., 2007. Decision-analytical modelling in
health-care economic evaluations. The European
Journal of Health Economics 9 (4), 313-323. DOI
10.1007/s10198-007-0078-x
Van der Velde G. 2005. Clinical decision analysis: an
alternate, rigorous approach to making clinical
decisions and developing treatment recommendations.
J Can Chiropr Assoc 2005; 49: 258-263
Witness (2015). User guide. Lanner Group, London, UK
SIMULTECH 2017 - 7th International Conference on Simulation and Modeling Methodologies, Technologies and Applications
170
