
Comprehensive Fitness Control in Young Soccer Players
Comparison of Laboratory and Field Testing Indicators
Anna Zakharova, Kamiliia Mekhdieva and Anastasia Berdnikova
Institute of Physical Education, Sport and Youth Policy, Ural Federal University named after the first President of Russia
B.N. Yeltsin, 19 Mira Street, Yekaterinburg, Russia
Keywords: Young Soccer Players, Training and Testing, Field and Laboratory Tests.
Abstract: Young athletes require a specialized approach to training process, taking into consideration a broad range of
physiological and training aspects. The study is focused on the evaluation of fitness level of young soccer
players and the search for interrelations between parameters of laboratory and field tests with the
physiologic measurements during match play. The proposed paper provides coaches, sports scientists and
physicians with important information on effective training control based on accessible and reliable tests.
Twenty six healthy male soccer players born in 2004 currently aged 12-13 were recruited for the study. Data
obtained from laboratory testing (cycling stress-test with gas-exchange measurements, Wingate cycling test,
and blood lactate measurements), maximal interval running field test and soccer game analysis with heart
rate monitoring were analysed. Firstly, Wingate cycle test parameters in young soccer players aged 12-13
were described in details. Furthermore, significant interrelations between indicators of physical state,
obtained from the various types of tests were revealed. The most important finding was close correlations
between measured indicators during the game with results of laboratory and field tests. Based on mentioned
above, laboratory and field tests can be widely used in training control of young soccer players.
1 INTRODUCTION
Successful training of an athlete is determined by the
timeliness and quality of the periodic control. The
fitness level control in sport means monitoring and
evaluation of physical capacities and in any kind of
sport measurements are to:
correspond to the competitive activity, i.e. be
specific;
match the athletes age and their sport
achievements;
provide with informative and reliable data that
appraise the athlete current state, their strengths
and weaknesses.
At present the regular control of the functional
state of young soccer players gradually gets a greater
meaning because of the early age beginning of sport
training in soccer, increase of training load at the
initial stage of training, and moreover due to the
high intensity in competition and its athletic
character in the adult soccer. The other problem we
faced in the XXI century is poor children’s
cardiovascular system development (Zakharova,
2015) because of easy social, transport and living
conditions in comparison with those of latter half of
the twentieth century.
Thus in boyhood days it is necessary to lay the
foundation for specific physical fitness level and
monitor it to meet the requirements to the robust
athlete in future soccer career.
It is commonly assumed that data obtained
during the competition are the most reliable
indicators of athletes’ fitness level. Much
information can be received from numerous
portative sport devices but heart rate belts and
monitors are not permitted during official soccer
matches (Laws of the Game. FIFA, 2016,
Impellizzeri, 2004).
Stated above enabled us to formulate the aim of
the study ̶ to assess the fitness level of young
soccer players by means of laboratory and field tests
and find connections between functional testing
parameters and physiological measurements during
match play.
Modern functional diagnostics provides us with
the opportunities to study thoroughly various
athletes’ indicators that are important in sports
activities. The only stumbling block is the set of
Zakharova A., Mekhdieva K. and Berdnikova A.
Comprehensive Fitness Control in Young Soccer Players - Comparison of Laboratory and Field Testing Indicators.
DOI: 10.5220/0006495600250032
In Proceedings of the 5th International Congress on Sport Sciences Research and Technology Support (icSPORTS 2017), pages 25-32
ISBN: 978-989-758-269-1
Copyright
c
2017 by SCITEPRESS – Science and Technology Publications, Lda. All rights reserved

methods to be used. They must be limited in number
but provide overall information about physical
competence. For research in a sport team it is
important to choose the quickest testing procedure
possible.
2 ORGANIZATION AND
METHODS
Subjects. Twenty six healthy male soccer players
born in 2004 currently aged 12-13 (height –
161.5±7.32 cm, body mass – 49.5±6.71 kg) were
recruited for the study. The participants of the study
had about 5 years of sport experience in soccer. All
subjects were free of cardiovascular or any other
chronic disease. The investigation conforms to the
principles of the Declaration of Helsinki of the
World Medical Association. Athletes involved in
the study had been provided with comprehensive
information on the procedures, methods, benefits
and possible risks before their parents’ written
consent was obtained and their permission was
given. The study was approved by the Ural Federal
University Ethics Committee.
2.1 Anthropometric Measurements
Weight and body composition were measured with
the use of the MC-980MA Plus Multi Frequency
Segmental Body Composition Monitor (TANITA,
Japan) based on the advanced Bioelectric Impedance
Analysis (BIA) technology. The following
parameters were registered: body mass (kg), body
mass index (BMI), muscle mass (kg; %), fat mass
(kg; %), fat free mass (kg), bone mass (kg),
intracellular and extracellular water (%), metabolic
rate (kcal) and body mass balance.
2.2 Laboratory Exercise Testing
All laboratory tests were conducted in the research
laboratory “Sports and health technologies” of the
Institute of Physical education, sports and youth
policy, UrFU. Laboratory exercise testing included
maximal ramp cycling test with gas-exchange
evaluation, cycling Wingate test and blood lactate
measurements.
2.2.1 Maximal Ramp Cycling Test
Exercise testing was performed with the use of a
bicycle ergometer ERG 911S (Schiller AG,
Switzerland) and a desktop metabolic monitor
Fitmate PRO (COSMED, Italy). Maximal ramp
protocol was applied in accordance with ACC/AHA
2002 guideline update for exercise testing (2006).
The test started from the load of 0 W during warm-
up stage (1 min) with further load increase (40 W
per minute). Athletes were recommended to keep the
cadence about 80 rpm. The test was considered to
have been performed at a maximal level of effort in
case of: (1) the inability of the subject to maintain
the expected cadence (80 rpm) despite verbal
inciting; (2) refusal to continue the test due to
subjective exhaustion of the muscles; (3) the
appearance of absolute medical indicators. Maximal
cycling test is widely used by sports physicians and
practitioners in assessment of physical fitness and
aerobic capacity. This type of protocol is quite
informative, relatively safe and easily reproducible.
The following parameters were recorded starting
with the first warm-up stage (1 min) and
continuously during exercise testing: oxygen
consumption (VO
2
, ml/kg/min), heart rate (HR,
bpm), stated exercise load (P, W), volume of
ventilation (Ve, l/min), and respiration rate
(Rf, 1/min). The current values of all measured
parameters were demonstrated on the metabolic
analyzer screen and saved in the device memory for
ongoing analysis.
Systolic blood pressure (SBP, mm Hg) and
diastolic blood pressure (DBP, mmHg) were
registered with the use of integrated tonometer blood
pressure monitor (Shiller AG, Switzerland) after
each second minute of the test. Immediate post-
exercise measurements of HR, SBP and DBP during
5 minutes of recovery period were recorded. SBP
and DBP values were manually fixed into
metabolograph memory.
Gas-exchange measurements during stress test
enabled us to obtain important information on
athletes’ aerobic capacity (Vilikus, 2012) and
accurate values of metabolic changes under stress
conditions. VO
2max
– the maximal value of oxygen
consumption during the test, anaerobic threshold
(AT) and its relation to VO
2max
(%) were determined
through the stress-test. These indices characterize
athletes’ aerobic abilities and efficiency of oxygen
utilization by working muscles.
A combination of the obtained physiologic
characteristics during stress test with their further
analysis provided with comprehensive information
about integral response of respiratory apparatus,
muscles and cardiovascular systems to exercise load.
In other words, it allowed estimating not only
oxygen uptake, transport and utilization, but also

efficiency of respiration at a maximal level of effort
(Ve
max
, l/min – maximal volume of ventilation per
minute; Rf
max
, 1/min – maximal respiration rate;
V
max
– maximal volume of one inspiration) and
muscle strength of athletes (P-VO
2max
– the power
reached at VO
2max
). These indicators are considered
as maximal individual for this particular type of test.
We also consider P
170
, W – cycling power at a
heart rate 170 beats per min, as a physical working
capacity indicator similar to PWC 170 – Cycle test,
the primary purpose of the which (Cambell et al.,
2001) is to predict the power output at a projected
heart rate of 170 beats per minute (bpm). For
example, one athlete has 180 W
at the HR =170 bpm
while the other has only 150 W. The former is more
physically fit than the latter.
2.2.2 Cycling Wingate Test
Cycling Wingate test was conducted with the use of
the ergometer BIKE MED (TechnoGym, Italy) and
Cardio Memory software V 1.0 SP3. Anaerobic
power measures were obtained using leg cycling
Wingate anaerobic test, and included peak power
(PP, W), relative PP (W/kg), power at 15 (P
15
, W)
and 30 sec (P
30
, W), average power (AP
30
) and their
relative values (P
15
, W/kg, P
30
, W/kg, AP
30
, W/kg).
2.2.3 Lactate Measurements
Blood lactate concentration (La, mmol/l) during
performance testing of athletes was measured with
the use of the portable device Vario Photometer DP
300 (Diaglobal, Germany) on microsamples of
capillary blood from the fingertip. Post-exercise
measurements of lactate were performed
immediately after interval field testing and twice
during the match (after the first and the second
halves). It is well-known that lactate is the end
product of the metabolic process of glucose
utilization (anaerobic glycolysis) (Goodwinn, 2007).
Thus, both in terms of the soccer game, as well as
the interval running field testing, the rate of lactate
elevation was considered as a measure of anaerobic
abilities and a response to physical exertion.
2.3 Field Soccer Tests
The maximal running interval testing was carried out
on a pitch in a circle (lap) marked by 4 cones (20m x
20 m). Athletes performed High Intensity Interval
Training (HIITraining) of 8 sets of 20-second
interval (Tabata Protocol) with an “all-out” effort
separated by 10 seconds of passive recovery
(Tabata, 1996). GPS Garmin Forunner 310XT was
used to measure the distance length covered in each
of 8 intensive bout and monitor heart rate (HR)
during the HIIT-test and HR recovery after it. For
quick and easy data access and HR and distance
information acquisition and processing the GPS
navigator configurations were installed on the
interval training (12 intervals × 20 sec + 10 sec for
rest). The additional 4 intervals were used for
processing an athlete recovery data. According to
the classification of training and competitive
physical activities the highest result shown in the
first cycle of the test corresponds to the zone of
anaerobic alactic power (D
max
, m; V
max
, km/h) and it
is the indicator of speed abilities (Tarbeeva, 2011) or
athlete’s running speed (Zakharova, 2015). The sum
of the first three results (D
1-3
), which depends
mainly upon the degree of the covered distances
decrease, serves the marker of ability to maintain
high speed. The result obtained within all 8 cycles
corresponds to the work in anaerobic glycolic zone
and the sum of 8 distances (D
1-8
) characterizes
special stamina and anaerobic glicolytic potential of
athlete’s working muscle groups (Tarbeeva, 2011,
Zakharova, 2015).
All players were informed of the rating of the
perceived exertion rating (RPE) scale (CR-10) and
familiarized with it a month before the start of the
study. The CR-10 scale proposed by Foster (1995,
2001), was presented to each player 12 min after
Maximal running interval testing. This was done to
exclude the influence of emotional factor after the
test.
2.4 Soccer Game Analysis with Heart
Rate Monitoring
To estimate age features of competitive activity of
young soccer players the heart rate monitoring with
GPS Garmin Forerunner 310XT (Garmin, USA) was
used. HR was recorded every 5 sec during each
training session using HR monitor with individually
coded HR transmitters to avoid interference. To
measure the distance length covered during the game
GPS navigation was used. Software Garmin Express
and Garmin Connect helped us to determine the
maximal velocity of young soccer-players,
maximal and average HR, amount of time in
different heart rate zones and others recovery
speed.
The match (11 vs 11) was played on a regular
size (105 × 68 m), synthetic-grass soccer pitch in
two halves of 35 minutes (the official duration of the
game for a given age of players), with 10-minute
rest interval. During the game a ball of size 5 was
used. To ensure that the game would restart
immediately if the ball left the field of play, spare
balls were kept all around the perimeter of the pitch.
Six players were observed during the match.
The perceived exertion rating (RPE) scale (CR-
10) was presented to each player 7 minutes after
each half of the game.
2.5 Statistical Analysis
Statistical analysis was performed with the use of
statistic software package “SPSS Statistics 17.0”
(IBM). The descriptive analysis of the obtained data
was applied to determine basic functional status of
athletes. Normality of distribution was assessed by
the Shapiro-Wilk test. Mean value (M) and standard
deviation (SD) of the used parameters were
calculated. Pearson correlations between the
measured parameters were calculated to estimate the
relations between results of laboratory, field and
real-game measurements. The level of significance
was set at P < 0.05.
3 RESULTS AND DISCUSSIONS
The obtained data of anthropometric measurements
of young soccer players (Table 1) show that
generally athletes had age and gender appropriate
body mass, height and most part of other indices.
High values of fat free mass (muscle mass) point at
good physical status and beneficial training effect of
soccer.
Table 1: Anthropometric and body composition analysis
of young soccer players (12-13 years).
Parameters M±SD (min-max)
Height, cm 161,07 ± 7,64 149-176
Weight, kg 49,37 ± 6,41 36,8-61,7
CC, cm 73,65 ± 3,57 66-79
NC, cm 34,04 ± 2,13 30-39
MM, kg 38,85 ± 5,14 29,4-48,4
MM, % 78,59 ± 3 70,96-83,81
Fat, kg 8,48 ± 1,97 4,9-12,9
Fat, % 17,13 ± 3,15 11,7-25,1
BMI, kg/m
2
18,95 ± 1,54 16-21,5
CC – chest circumference; NC - neck circumference; MM-
muscle mass.
Table 2 shows the results of laboratory cycling
stress-test. On average, VO
2max
in the studied group
corresponded to high level in reference to age and
gender norm in soccer for 12-13 years (Cunha,
2011) and slightly lower one for age of 14.2±0.5
years reported VO
2max
= 56.5 ± 0.9 (Buchheit, 2008).
Average HR before the test, measured at rest
sitting on cycle ergometer, was higher than sport
norm. This result indicates the poor cardiovascular
development that leads to low aerobic abilities. At
the same time HR
max
was within athletic norm
(Table 2), that means the balanced heart-muscle
development of young soccer players. But this
balance was reached thanks to good but not
excellent power index (P-VO
2max/kg
, W).
Meanwhile, most of the stress-test parameters
varied within a certain range. This indicated
considerable difference of level of aerobic
performance and physical state of players of the
same age.
Table 2: Stress-test parameters of soccer players.
Parameters M±SD
(min-max)
Athlete
norm
VO
2max
,
ml/kg/min
54.34 ± 6.08 (45.8-66.6) 55
HR before the
test, bpm
90.28 ± 10.59 (70-109) 70
HR
max,
bpm 182.89 ± 5.63 (172-192) 180-195
P
170,
W 183.78 ± 35.14 (136-258) -
P-VO
2max
, W 222.67 ± 35,18 (152-294) >250
P-VO
2max
/kg,
W/kg 4.74 ± 0.46 (4.04-5.48)
>5
Ve
max
, l/min 82.37 ± 16.97
(55.2-123.2)
80-100
Rf
max
, 1/min 54.57 ± 12.98 (35.4-81.6) -
V
max
(Ve/Rf), l
1.55 ± 0.45 (0.96-2.86) >2
METS 15.56 ± 1.79 (13-19) >15.5
HR – heart rate; P-VO
2max
- power reached at VO
2max
;
P-VO
2max
/kg – relative maximum power at P-VO
2max
; VO
2
– oxygen consumption; Ve
max
– maximal volume of
ventilation; Rf
max
– maximal respiration rate; V
max
–
maximal volume of one inspiration.
As running speed and acceleration abilities are of
great importance in soccer we reported opportunity
to measure peak power in cycling Wingate test for
testing of 11-12 years old (Zakharova, 2016). No
information about Wingate-test parameters in the
age of 12 was found.
In the present study (Table 3) relative PP and AP
were as high as the same indicators of 15-16 years
old soccer players (Jastrzębski, 2011, Junior, 2010)
and higher than that of forwards (Joo, 2016)
whereas all absolute values were lower. In
comparison with 17 years old players with identical
experience in soccer, the tested players showed
lower values of PP, but the same values of AP
(Chtourou, H., 2012). This undoubtedly
demonstrates the high level of leg muscles fitness
for anaerobic work specific for soccer.
Table 3: Wingate-test parameters of soccer players.
Parameters M±SD (min-max)
PP, W 517.21 ± 102.9 (371-698)
PP, w/kg 10.83 ± 1.24 (8.67-12.92)
P
15
, W 421.71 ± 96.87 (292-628)
P
15
, W/kg, 8.53 ± 1.12 (6.99-10.33)
P
30
, W 337.71 ± 95.6 (226-497)
P
30
, W/kg 6.78 ± 1.11 (5.06-9.15)
AP
30
, W 415.29 ± 87.01 (314-607)
AP
30
, W/kg 8,69 ± 0.96 (7.22-10.6)
Fatigue, % 41.29 ± 10.17 (25-62)
t
pp
, s 5.64 ± 4.63 (2-17)
PP – peak power; AP – average power; t
pp
, - time of PP
attainment.
The results of interval running test are showed in
Table 4 and Figures 1 and 2.
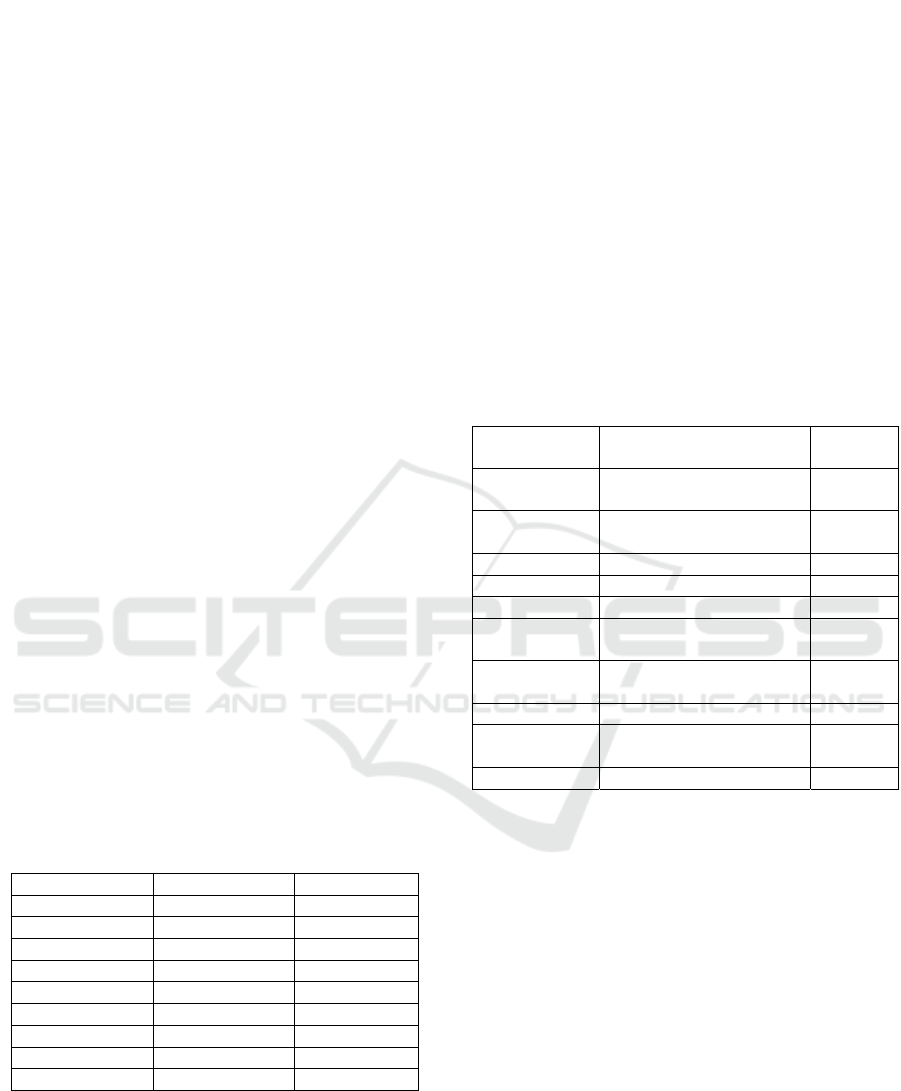
Table 4: Results of interval running test of soccer players.
Parameters M±SD Max
D
max
per interval, m 114.45 ± 7.03 132
ΣD, m 746.82 ± 57.64 831
∆D, m 31.82 ± 9.36 45
HR
max
, bpm 189.36 ± 7.51 202
HR
mean
, bpm 161.91 ± 6.22 171
V
max
, km/h 20.6 ± 1.27 23.76
V
mean
, km/h 16.8 ± 1.3 18.7
V
min
, km/h 14.87 ± 1.69 17.1
∆V, km/h 5.73 ± 1.19 8.1
La, mmol/l 7.89 ± 3.1 15.6
RPE 7 ± 1.41 9
D
max
– distance covered in the best interval; ΣD – total
distance for the test; ∆D – individual RPE – rate of the
perceived exertion; La – capillary lactate concentration; V
– velocity; ∆V – drop of the velocity during the test
(between individual V
max
and V
min
)
∆D (m) was calculated as the difference between
the best interval and the interval with the minimum
distance in the HIIT-test. This indicator ∆D (m) was
adopted as a criterion of the ability to perform high-
intensity running with minimal loss of productivity.
The optimum value was assumed at ∆D ≤ 30 m.
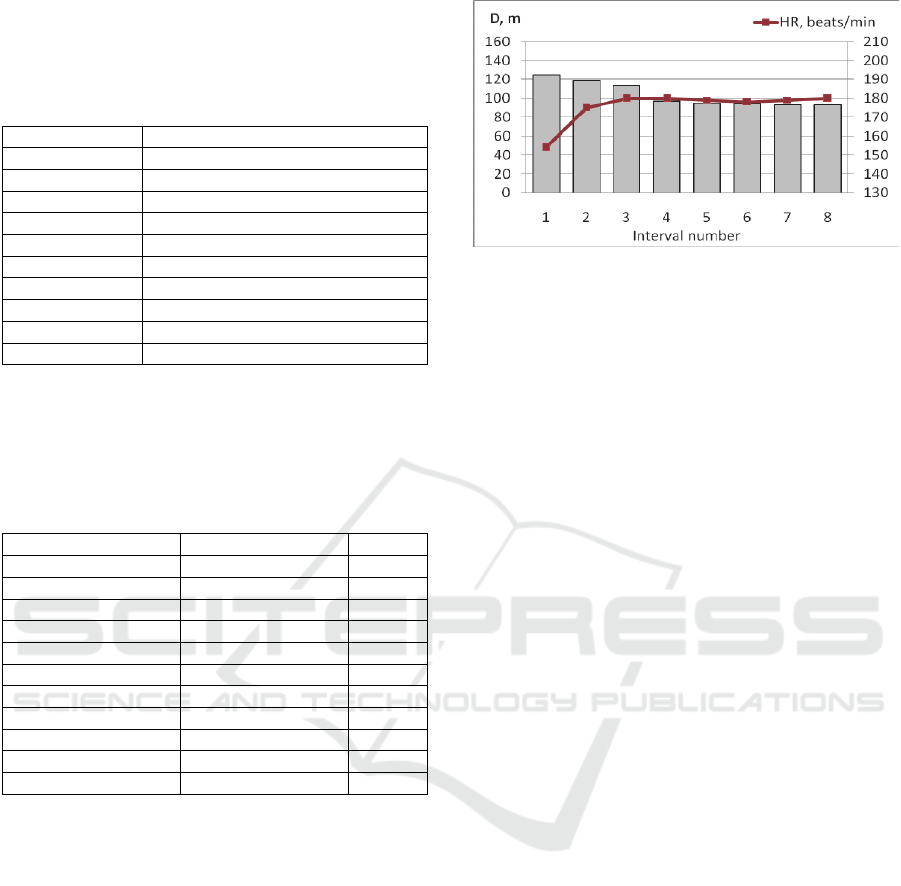
The desirable excellent conditioning bar chat of
young football players is shown in Figure 1.
Figure 1: The desirable excellent conditioning bar chat of
young soccer players.
The results of running interval test detect the
physical fitness of every subject. The comparison
and ranking of the first (best) distance results of all
athletes reveal the winner in speed, while champion
in 8 distances amount shows the desirable level of
specific endurance (Figure 2).
Many researchers have repeatedly performed the
subsequent detailed analysis of external and internal
load indicators, as well as technical and tactical
preparedness of athletes during the played soccer
matches (Mohr M., 2003; Castagna, C., 2003;
Krustrup, P., 2005; Castagna, C., 2009; Aquino,
R.L., 2016). The value of data obtained during the
game cannot be overestimated. A variety of match
analysis methods and tools allows not only to
characterize one or several sides of a player's
preparedness, but also to compare the obtained data
with the results of the other tests. It is provided by
short, but not less informative tests that do not
require sophisticated equipment and huge energy
costs for players (as during the game).
During the whole game players (n = 12) covered
8500 ± 460 m (7930-8910 m), of which 4000 ±
550 m (3190-4560 m) were performed in the first
half of the game and 4500 ± 500 (3910-5210 m) in
the second half. The studied group of players
showed a high level of the total distance covered per
game in comparison with the data of other
researchers in accordance with the age and gender
norms in soccer (Barbero-Álvarez, 2013: age – 14.3
± 1.3 years, total distance – 7145 ± 685 m; Buchheit,
2010: age – U13, total distance – 6549 ± 597 m, age
– U14, total distance – 7383 ± 640 m; Buchheit,
2008: age – 14.2 ± 0.5, total distance – 5372 ±
125 m).
The average and peak HR during the match were
160.5 ± 6.06 bpm (154-170 bpm) and 194.83 ± 6.94
bpm (range 188-206). The values of HR
max
and
HR
mean
during the game were authentically lower
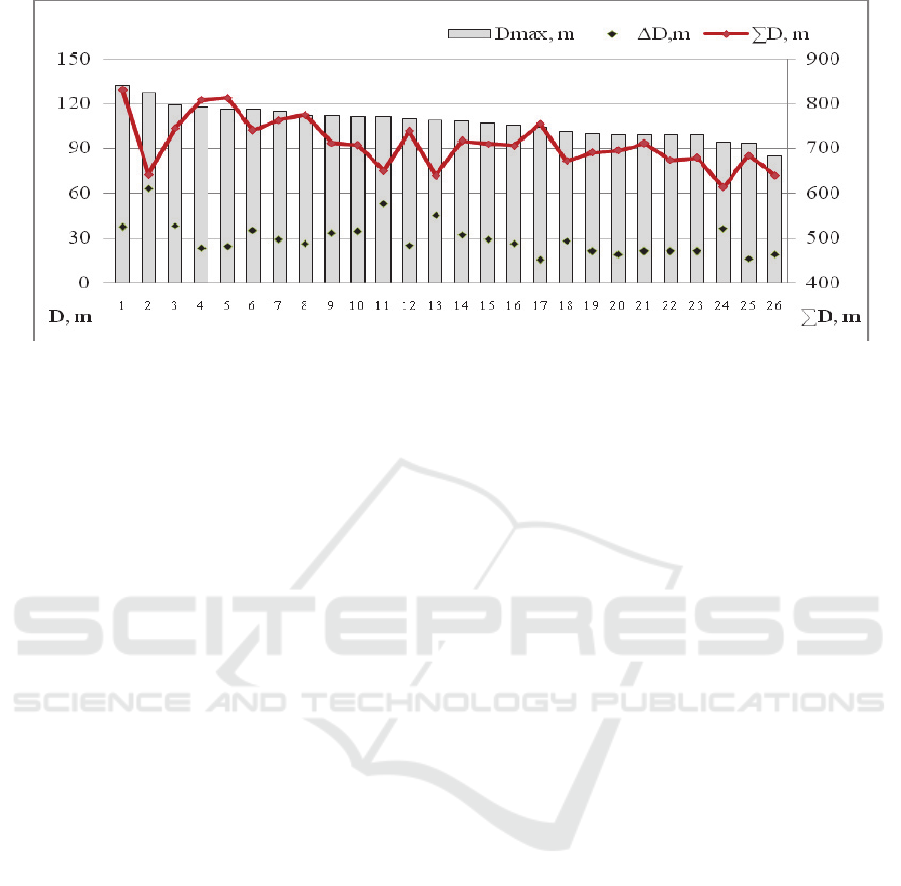
Figure 2: Young soccer players (n=26) individual results of interval running test.
than in Barbero-Álvarez study (2013) (HR
max
–
205.7 ± 5.4 bpm, HR
mean
– 179.7 ± 6.8 bpm).
Lactate values after the first and second half of
the game were 5.48 ± 2.28 ml/l (2.87-9.25 ml/l) and
3.71 ± 1.81 ml/l (2.44-6.91 ml/l) respectively. RPE
response of players showed values of 4.17 ± 0.41 (4-
5) and 5.5 ± 0.55 (5-6) after the first and second half
of the game respectively.
During the match the players showed an average
speed of 10.4 ± 1.61 km/h (7.6-11.54 km/h). The
peak game speed was 20.4 km/h and it was lower
than average values reported by Buchheit, 2010
about the players of the same age (age – U13, peak
game speed – 22.3 ± 1.4; age – U14, peak game
speed – 24.4 ± 1.8).
Taking into account the results of laboratory tests
and field tests discussed above it can be assumed
that low values of maximum speed during the game
are associated with the game tactics but not with low
fitness level of young players.
Data obtained from correlative analysis showed
that there were strong interrelations between the
parameters of physical fitness of young soccer
players obtained from different tests.
In particular, we found significant correlations
between PP and P-VO
2max
(r = .805, P < 0.01), PP
and P
170
(r = .630, P < 0.05), AP and P-VO
2max
(r = .822, P < 0.01), AP and P
170
(r = .626, P < 0.05),
AP and VO
2max
(r = .566, P < 0.05).
Above-mentioned proves the interrelation
between athletes’ maximal power and strength
manifestation in VO
2max
protocol, or strange as it
may seem between anaerobic power (PP, AP) and
aerobic capacities in athletes. In other words, muscle
strength abilities provide athletes with advantage in
endurance, as shown in better physical
characteristics during aerobic laboratory and field
tests, as well as lower exertion during the game.
Furthermore, we found strong correlations
between the results of laboratory and field tests and
measurements obtained during the soccer game. Our
results showed that RPE during the game correlated
with VO
2max
(r = -.622, P < 0.05), La concentration
after the 1
st
half well correlated with the following
indices: PP (r = .923, P < 0.01), relative PP (r = .934,
P < 0.01), AP (r = .884, P < 0.05), relative AP
(r = .841, P < 0.05), D
max
(r = .859, P < 0.01).
Concentration of La after the 2
nd
half correlated
with P-VO
2max
(r = -.946, P < 0.01) and P
170
(r = -.898, P < 0.01).
HR at 150 W during stress test correlated with
the following indices of Wingate test: PP (r = -.518,
P < 0.05), AP (r = .-628, P < 0.01), AP/kg (r = -.640,
P < 0.01), HR
max
at interval running field test (r =
.564, P < 0.05) and La concentration after the 2
nd
half (r = -.967, P < 0.01); HR
max
during interval
running field test correlated well with HR
mean
during
the game (r = .816, P < 0.05).
Moreover, we found the following relationship
of external load indicators between HIIT-test and
measurements obtained during the soccer game:
distance covered in the first half of the game
correlated with the total distance in HIIT-test (ΣD)
(r = .628, P < 0.05) and D
max
(r = .629, P < 0.05);
distance covered in the second half of the game
correlated with ΣD (r = -.889, P < 0.05), D
max
(r = -.746, P < 0.05), D
min
(minimum distance
covered per interval) (r = -.929, P < 0.05).
The internal load indicators of the same tests also
showed a good correlation. RPE after the 2
nd
half
correlated with RPE of HIIT-test (r = .71, P < 0.05);
HR
max
during HIIT-test correlated well with HR
mean
during the game (r = .82, P < 0.05) and HR
max
during
the game (r = .63, P < 0.05).
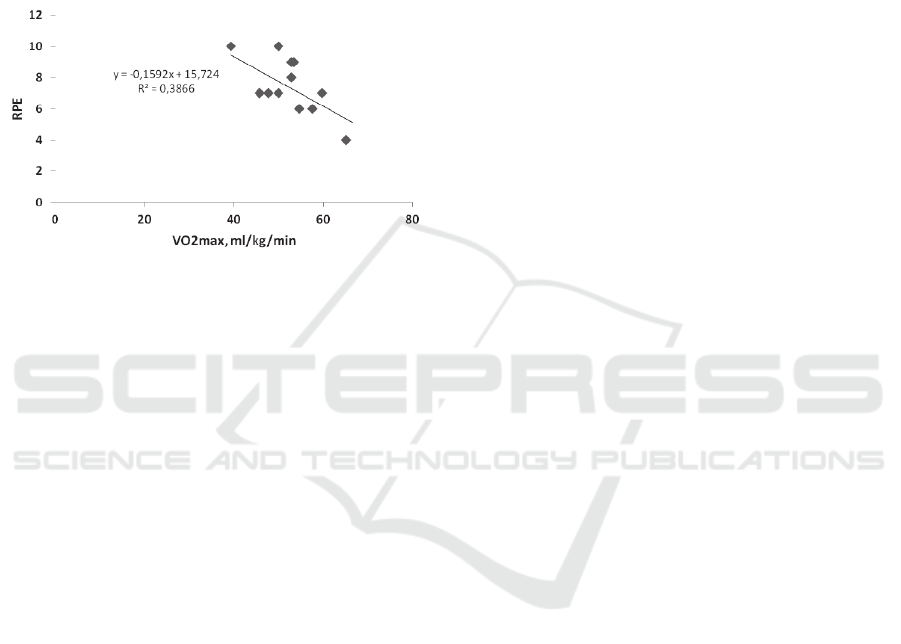
Figure 3 demonstrates the relation between the
rate of the perceived exertion during the game and
maximum oxygen consumption. One can see that the
higher VO
2max
was the lower rate of exertion athletes
had after the game. Thus better abilities of oxygen
consumption, transport and utilization in young
soccer players provide them with better physical
load tolerance during the game.
Figure 3: Graph, describing relations between the rate of
the perceived exertion (RPE) after the game and maximum
oxygen consumption (VO
2max
).
4 CONCLUSIONS
1. Complex testing of soccer players aged 12-13
in laboratory and field condition revealed very good
(better-than-average) physical preparedness of
athletes. The fitness indicators of the young soccer
players in tested group corresponded to the general
patterns of athletes’ development of age mates in
soccer. Currently there is a negative trend of poor
cardiovascular development in young players that
causes low aerobic abilities. The roots of this
problem go far beyond the training process. But the
inability to allocate time for replenishment of this
component in the training process provokes a chain
reaction of fitness underdevelopment that will lead
to pathological changes in the functional system and
early withdrawal from sports in the near future.
High fitness level of young players is a good
basis for the further harmonious development of
athletes that will provide the best conditions for the
development and manifestation of technical and
tactical skills. Nevertheless, in future it is necessary
to pay special attention to development of
cardiovascular system, since it will be the limiting
factor of exercise performance.
2. Wingate cycle test parameters in young
soccer players aged 12-13 were described in detail
for the first time. There are significant interrelations
between indicators of physical state, obtained from
the various types of laboratory and field tests. As
major physiologic parameters during the game
correlate with the indicators from laboratory and
field tests, these easy reproducible and accessible
tests can be widely used in training control of young
soccer players.
3. A close interrelation of indicators of
external and internal load in the field test and the
soccer game allows asserting the optimality of the
application of the HIIT-test for testing the
preparedness of young players. A short test time in
contrast to the duration of the game allows one to
assess comprehensively the physical preparedness of
a player without use of additional sophisticated
technical equipment.
4. The complex testing used in this study is
optimal and provides comprehensive information
about the functional state and physical fitness of
soccer players. Laboratory and field tests fully
complement each other, have clear evaluation
criteria and contribute to sport science and training
and testing practice.
ACKNOWLEDGEMENTS
The work was supported by Act 211 Government of
the Russian Federation, contract № 02.A03.21.0006
REFERENCES
ACC / AHA 2002 guideline update for exercise testing:
summary article: a report of the American College of
Cardiology / American Heart Association Task Force
on Practice Guidelines. Journal of American College
of Cardiology, 2006: 48: 1731 pp.
Aquino, R.L., Gonçalves, L.G.C., Vieira, L.H., Oliveira,
L.P., Alves, G.F., Santiago, P.R., Puggina, E.F.
(2016). Biochemical, physical and tactical analysis of
a simulated game in young soccer players. Journal of
Sports Medicine and Physical Fitness. 56, 1554-1561.
Barbero-Álvarez, J.C., Pedro R.E., Nakamura F.Y.
(2013). Validity of a repeated-sprint ability test in
young soccer players. Science & Sports, 28(5), 127-
131.
Buchheit, M., Delhomel, G., Ahmaidi, S. (2008). Time-
motion analysis of elite young French soccer
players. Coaching and Sport Science Journal, 3, 21.
Buchheit, M., Mendez-Villanueva, A., Simpson, B. M.,
Bourdon, P. C. (2010). Match running performance
and fitness in youth soccer. International journal of
sports medicine, 31, 818-825.

Cambell, P. et al., 2001. Prediction of physical activity and
physical work capacity (PWC 170) in young
adulthood from childhood and adolescence with
consideration of parental measures. Am J Human Biol,
13, pp. 190-196.
Castagna, C., D'ottavio, S., Abt, G. (2003). Activity
profile of young soccer players during actual match
play. The Journal of Strength & Conditioning
Research, 17, 775-780.
Castagna, C., Impellizzeri, F., Cecchini, E., Rampinini, E.,
Alvarez, J.C.B. (2009). Effects of intermittent-
endurance fitness on match performance in young
male soccer players. The Journal of Strength &
Conditioning Research, 23, 1954-1959.
Chtourou, H., Hammouda, O., Souissi, H., Chamari, K.,
Chaouachi, A., Souissi, N. (2012). Diurnal variations
in physical performances related to football in young
soccer players. Asian journal of sports medicine, 3(3),
139-144.
Cunha, G., Lorenzi, T., Sapata, K., Lopes, A.L., Gaya,
A.C., Oliveira, Á. (2011). Effect of biological
maturation on maximal oxygen uptake and ventilatory
thresholds in soccer players: an allometric
approach. Journal of sports sciences, 29, 1029-1039.
Foster, C., L. L. Hector, R. Welsh, M. SchrageR, M. A.
Green, Snyder, A.C. (1995). Effects of specific versus
cross-training on running performance. European
Journal of Applied Physiology and Occupational
Physiology. 70: 367–372.
Foster, C., Florhaug, J.A., Franklin, J., Gottschall, L.,
Hrovatin, L.A., Parker, S., Doleshal, P., Dodge, C.
(2001). A new approach to monitoring exercise
testing. Journal of Strength & Conditioning Research,
15,109–115.
Goodwinn ML et al. (2007). Blood lactate measurements
and analysis during exercise: a guide for clinicians /
Journal of Diabetes Science and Technology, 1, 558-
569.
Impellizzeri, F.M., 2004. Use of RPE-based training load
in Soccer. Medicine & Science in Sports & Exercise,
36, 1042-1047.
Jastrzębski, Z., Barnat, W., Konieczna, A., Rompa, P.,
Radzimiński, Ł. (2011). Changes of physical capacity
and soccer-related skills in young soccer players
within a one-year training period. Baltic Journal of
Health and Physical Activity, 3(4), 248-261.
Joo, C.H., Seo, D.I. (2016). Analysis of physical fitness
and technical skills of youth soccer players according
to playing position. Journal of Exercise
Rehabilitation, 12, 548-552.
Júnior, J.B.S., da Silva Carvalho, R.G., Ferreira, J.C., da
Silva, N.W.P., Szmuchrowski, L.A. (2010).
Correlação entre os índices do teste de corrida com o
teste de Wingate. Arquivos em Movimento, 4(1), 12-
22.
Krustrup, P., Mohr, M., Ellingsgaard, H. E. L. G. A.,
Bangsbo, J. (2005). Physical demands during an elite
female soccer game: importance of training
status. Medicine and Science in Sports and
Exercise, 37, 1242.
Mohr M, Krustrup P, Bangsbo J. (2003). Match
performance of high-standard soccer players with
special reference to development of fatigue. Journal of
Sports Sciences, 21:519-28.
Tabata, I., Nishimura, K., Kouzaki, M., Hirai, Y., Ogita,
F., Miyachi, M. and Yamamoto, K., 1996. “Effects of
moderate-intensity endurance and high-intensity
intermittent training on anaerobic capacity and
VO
2max
”. Medicine & Science in Sports & Exercise,
28, 1327–1330.
Tarbeeva, N., 2011. “Method of Tabata interval training as
a way of speed strength endurance control in cross
country skiing”. In journal Uchenye zapiski
universiteta imeni P.F. Lesgafta.. 76(6), 156-159.
Impellizzeri, F.M., Rampinini, E., Coutts, A.J., Sassi,
A.L.D.O., Marcora, S. M., 2004. Use of RPE-based
training load in soccer. Medicine and science in sports
and exercise, 36, 1042-1047.
The International Football Association Board: Laws of the
Game. Zurich, FIFA, 2016.
Vilikus Z. (2012). Functional Diagnostics. College of
Physical Education and Sport, Palestra, 12-15.
Zakharova, A., Berdnikova, A., Tarbeeva, A.,
Matvienko, V. (2015). High intensity interval testing
for fitness control of young Football players. In
journal Uchenye zapiski universiteta imeni P.F.
Lesgafta.. 124(6), 70-75.
Zakharova A.V., Berdnikova A.N. (2016). Monitoring of
Power Abilities in Young Football Players. Human.
Sports Medicine, 16(4), 64-74.
Zakharova A., Tarbeeva N., Tarbeeva A., Miasnikova T.
(2015). Healthsaving technologies for young cross
country skiers. Cardiovascular system testing for sport
training program design. icSPORTS 2015:
Proceedings of the 3rd International Congress on
Sports Sciences Research and Technology Support;
139-144.
