
Early NPL Warning for SME Credit Risk: An Experimental Study
Sacide Kalayci and Secil Arslan
R&D and Special Projects Department, Yapi Kredi Technology, Istanbul, Turkey
Keywords:
Credit Risk, Small and Medium-sized Enterprise, Early NPL Warning, Random Forest.
Abstract:
In credit risk, besides assessing risk of credit applications, it has been very critical to take a proactive decision
by foreseeing the risk of non-performing loan (NPL). In Turkey, recent reports demonstrate that among dif-
ferent credit categories such as consumer, corporate, small and medium-sized enterprises (SME) loans, SMEs
reflect the highest NPL ratios. This paper focuses on SME credit behavioural scoring to develop an early NPL
warning system after the credit is released. Utilizing application scoring features together with behavioural
scoring features, an experimental study of classifying SME customers as non-performing or performing is tar-
geted during lifetime of the credit. The proposed system aims to support a warning 6 months ahead to detect
NPL state. Random Forest (RF) algorithm is implemented for NPL state classification of active SME cred-
its. Accuracy results of RF algorithm is compared with different machine learning algorithms like Logistic
Regression, Support Vector Machine and Decision Trees. It has been observed that accuracy of RF model is
increased when different SME credit product features are added to the model. An accuracy ratio of 82.25% is
achieved with RF which over performs all other alternative algorithms.
1 INTRODUCTION
Since credit volume in real markets has shown great
increase, credit risk analysis (CRA) has become in-
creasingly important for financial institutions and ad-
vanced methods that are built using statistical ap-
proaches have already started to take place of tra-
ditional methods (Huang et al., 2007; Zhou et al.,
2010; Derelio
˘
glu and G
¨
urgen, 2011). Credit risk
analysis aims to eliminate future losses by assessing
credits based on potential risk and can be classified
into two categories: application scoring, behavioural
scoring. According to definitions in (Thomas et al.,
2001), application scoring consists of two snapshots
of consumer state at two different dates–the first of
their application form information and the second of
their creditworthiness which is commonly determined
as ”good” or ”bad” so it is a static event. On the
other hand, behavioural scoring is a way of updat-
ing consumer risk based on repayment performance
of consumer or other performance criteria described
by lender. Thus in behavioural scoring, first snap-
shot is replaced with a time interval but second snap-
shot still remains the same. However, in behavioural
analysis, while some of conducted studies concern
with only likelihood of default, others also concern
with when default is occurred. In recent years, pre-
dicting default date or period in which customers de-
fault gains more importance since forecasting ’when’
gives insight about default rates over time (Noh et al.,
2005). Actually, it has been already used in profit
scoring modeling (Thomas et al., 2001) which aims to
find customers who will provide better profit to finan-
cial institutions due to the fact that lenders will have
greater benefit if a customer pays for longer period
without default.
1.1 Credit States in Turkey
In Turkey, Banking Regulation and Supervision
Agency (BRSA) which checks and balances banks
according to banking law publishes annual, quar-
terly reports to watch financial data of banking sec-
tor and structural developments in banking. One of
those reports highlights recent changes in credit im-
provements, market share of credit types and non-
performing loan (NPL) ratios of credits with respect
to debt owner categories.
In recent years, the worst performing credits are
credits lent to SME companies. This situation has
several reasons like currency depreciation, supply-
chain effect of non-performing loans and changes in
macro-economic conditions. Detecting the risk of
open SME credits to fall in NPL as early as possi-
ble has become crucial for banks. As a result, an ex-
perimental study which mainly focuses on early NPL
Kalayci S. and Arslan S.
Early NPL Warning for SME Credit Risk: An Experimental Study.
DOI: 10.5220/0006496601900197
In Proceedings of the 9th International Joint Conference on Knowledge Discovery, Knowledge Engineering and Knowledge Management (KDIR 2017), pages 190-197
ISBN: 978-989-758-271-4
Copyright
c
2017 by SCITEPRESS – Science and Technology Publications, Lda. All rights reserved

(a)
(b)
(c)
Figure 1: (a) Credit distribution (b) SME credit improve-
ment. (c) NPL ratios.
detection of SME credit is initiated.
In Turkey the ratio of SME credits approaches
25% of total credit distribution which is equal to the
ratio of consumer loans and credit cards as presented
in Figure 1a. Besides this high ratio of SME credits,
year over year trend of total credit capacity in SMEs
has been reflecting an increasing trend as shown in
Figure 1b. Although credit share of SMEs is increas-
ing, the ratio of SME credits in NPL state is also in-
creasing and demonstrating the highest risk compared
to all other credit categories as presented in Figure 1c.
5% of all SME credits are reported to be in NPL in
contrast to 4% and 2% ratios for consumer loans and
corporate credits respectively.
SMEs are likely to obtain bank loans from mul-
tiple banks at the same time thus banks should take
precautions as immediate as possible when customers
fall in financial distress. Therefore, for a lender, an
accurate model for SMEs risk is essential to prevent
losses or have greater benefit. As mentioned before,
most of the proposed studies can be categorized into
two based on the used information types or their aims
for the SME credit risk analysis. In application scor-
ing, utilized information types dominantly consist of
demographical, risk and financial information while
for pure behavioural scoring, only repayment perfor-
mance is employed. However, using different infor-
mation types together and forecasting credit status for
a specific time interval might give the lender advan-
tages of more accurate model for risk analysis (Sar-
lija et al., 2009) which can be used for taking neces-
sary steps. With this motivation, we propose an ex-
perimental study by forecasting customer status in a
period–determined as six months–to maximize profit
by restructuring. Therefore, instead of utilizing only
features used in pure behavioural scoring which con-
sist of repayment performance of customers (Thomas
et al., 2001), features used in two different systems–
application scoring, behavioural scoring–are utilized
for this study. System is designed to be run each
month with new behaviour data along with previously
used behaviour data, forecast for next six-month pe-
riod. According to the outcome, changes to statuses
(NPL or PL) of proposals can be adapted. As the
first step in this experimental study, it is aimed to ex-
plore effects of different machine learning algorithms
to obtain a stable model. Moreover, instead of ex-
tending behaviour data obtained by shifting the ob-
servation point, effects of new information types are
investigated. To test performance for period of six
months–from April 2016 to October 2016–, observa-
tion point is settled on 2016 April and subsequently
the model for SME credit risk analysis is trained using
Random Forest (RF) (Breiman, 2001). Also we ex-
plore effects of feature types on SMEs risk analysis by
adding new data associated with SME products to the
model incrementally. After the good accuracy rates
are achieved, we address the issue of knowledge dis-
covery by using feature selection method. Moreover,
in order to evaluate performance of RF on the pre-
diction accuracy, we also compared its performance
with Logistic Regression (LR) (Cox, 1958), Deci-
sion Trees (DT) and Support Vector Machine (SVM)
(Cortes and Vapnik, 1995). Also, to compare ob-
tained results and performance of RF with previously
conducted research within the scope of the bank for
SME Credit Risk Analysis (Derelio
˘
glu and G
¨
urgen,
2011), Multilayer Perceptron (MLP) is also imple-
mented. Comparative experiments illustrate that RF
provides the best prediction performance.
In Section 2, we summarize the proposed studies
by categorizing them into two classes. Section 3 looks
at SME and also looks at the RF approach for problem
solution and summarizes the system design in detail.
Section 4 discusses experimental results and compari-
son of machine learning algorithms based on accuracy
performance along with most important features used
in building the model. Finally Section 5 concludes
the paper, and in section 6, future works will be men-
tioned.

2 RELATED WORK
Although many researches on quantifying and com-
puting risk have predominantly focused on large cor-
poration’s risk or consumer loans, there are very few
studies for SME credit risk analysis (Derelio
˘
glu and
G
¨
urgen, 2011). Unlike the corporate’s risk, SME risk
depends not only on financial information but also
SME’s characteristic properties (Wang, 2012). There-
fore, developed models for large corporations or con-
sumer loans might not be proper for SMEs risk. Also,
most of the proposed studies attempt to forecast cus-
tomer status in the future, not in a specific time. As
mentioned before, information about status of a credit
at a specific period might give a lot of advantages to
the lender. Therefore, this study is conducted in the
light of all different types of credit risk analysis like
application scoring and behavioural scoring.
2.1 Application Scoring
Generally in application scoring, it is aimed to make
decision whether to grant credit by forecasting cus-
tomer defaults by using customer information gath-
ered during application phase. While there are a lot of
studies for application scoring which have been con-
ducted for large corporations (Gaganis et al., 2007;
Galindo and Tamayo, 2000; Harris, 2015), risk fac-
tors for SMEs have been explored in a few studies.
Kim and So (Kim and Sohn, 2010) utilized finan-
cial ratios and economic indicators along with tech-
nology evaluation factors using SVM to grant tech-
nology credit to SMEs. They achieved better results
(66.16% classification accuracy) by using SVM than
results obtained using Back-Propagation Neural Net-
works(BPNs) and LR. Wang (Wang, 2012) chose to
combine credit features of owner and credit capacity
features by using LR. Obtained results showed that
although credit capacity features are more meaning-
ful for credit default analysis, personal information
of the owner–especially age– is also important. Alt-
man & Sabato (Altman and Sabato, 2005) developed
a default prediction model on US SMEs dataset by
using LR and LR performs better than Multivariate
Discriminant Analysis.
2.2 Behavioural Scoring
Unlike application scoring, in behavioural scoring,
repayment performance which is gathered during a
period is utilized to forecast whether customers are
likely to default. To the best of our knowledge, be-
havioural scoring has not been conducted for SME
risk assessment yet. Thus, we benefit from studies
conducted for corporation and consumer loans. Re-
searchers in behavioural analysis conduct different
studies and develop different models (Sarlija et al.,
2009). While some of conducted researches focus on
predicting whether customers go into default, others
focus on predicting when customers will default or
predicting whether customer will default in a specific
period. In this experimental study, since we aimed to
forecast status of active SME credits in a period, we
concentrated on studies for predicting time to default.
Thomas (Thomas, 2000) discusses statistical and op-
erational research techniques used for behavioural
scoring. The system of (Thomas et al., 2001) utilizes
Markov Chain stochastic processes to model delin-
quency status of consumer and behavioural scores of
consumers. In (Sarlija et al., 2009), performances of
NN and survival analysis on predicting time to default
are compared on data which is collected from January
1 to December 31 and observation point is settled on
June. So, it is aimed to forecast customer status in
the period of 6 months after the observation point.
For NN, 6 different models are trained for samples go
into default on different months and they explored that
while survival analysis yielded better performance in
the first month of survival than NN. In all other five
months, NN performed better accuracy than survival
analysis. Thomas et all. (Banasik et al., 1999) used
LR and survival analysis in behavioural analysis on
consumer loan dataset and they found hazard mod-
els are competitive with LR for forecasting customers
who will default in the first year. Noh et al. (Noh
et al., 2005) found that LR and NN are superior to
survival analysis in predicting good customers, how-
ever for bad customers, survival analysis yielded bet-
ter performance.
3 MODEL DEVELOPMENT
3.1 Data Preparation
In this section, general properties of SME proposals,
generation of dataset and some handicaps that are en-
countered in data generation will be discussed in de-
tail.
In Turkey, the bank determines a limit which is
available for a while for an SME and according to this
limit, a proposal which may consist of up to 77 dif-
ferent products such as business card, cheque-book,
corporate loan is offered and the total limit is shared
among these products based on consumer’s needs.
In the proposal, each product can have unique pat-
terns such as repayment frequency, interest rate etc.
and during lifetime of the proposal, consumers can

use any previously determined product whenever they
want. If the customer–in this case a SME–misses
three consecutive month of payments of one of the
used products, status of the customer is determined as
NPL (Non-performing loan) otherwise is determined
as PL (Performing loan).
The real-life dataset is provided by the bank con-
sists of SME proposals from January 1, 2015 to Oc-
tober 1, 2016. For the first step of this experimental
study, an observation point is settled on 2016 April
and time interval until the observation point is called
performance period and characteristics of the perfor-
mance in this period are utilized for developing the
model. Status of the proposal during the period of
six months–from April 1, 2016 to October 1, 2016–
which is called outcome period is used to determine
whether a customer becomes NPL or not. Represen-
tation of the periods are presented in Figure 2. For de-
veloping model, proposals, which are offered before
the observation point and are still open after the ob-
servation point, are selected. While it is required for
NPL proposals that close date should be in the out-
come period for PL proposals, proposals can be still
open during the outcome period. The only condition
for PL is that the proposal should be offered before
the observation point and customer should not fall in
NPL status during the outcome period. However, a
customer which is classified as PL can become NPL
after the outcome period as shown in Figure 2c. This
results in observations that have similar features but
different classes (PL and NPL) in the dataset. False
positives and negatives that may arise from this situ-
ation are considered, and such samples are not elim-
inated from the dataset, as the predictions in the cur-
rent outcome period are considered more important in
the project than predicting further. The system is de-
signed to be run each month, make predictions about
the next six-month period and the algorithm would
adapt next month accordingly.
Features utilized for developing SME risk analy-
sis model can be categorized into six different types
of information: demographical, application data, fi-
nancial statements, guarantees, repayment behaviour
and credit bureau data as shown in Figure 3. All in-
formation types will be explained with examples.
SMEs are more sensitive to changes in economic
conditions (Kim and Sohn, 2010), total observed time
should not be too long since economic environment
may have changed. Therefore, in this experimental
study, since the observation point is set to April 2016,
behaviour characteristic information of customers be-
tween 2014 and 2016 is collected.
Unlike the large corporations, SME depends on
owners’ credit features since its owner is also its
(a)
(b)
(c)
Figure 2: Lifetime of NPL and PL proposals. (− − x) and
(− − |) symbols represent NPL and PL proposals respec-
tively. Green and red arrows are used for included propos-
als, black arrows are used for proposals that are not included
to the dataset since they are closed before the observation
point. (a) Representation of the performance period and the
observation period (b) Lifetime of NPL proposals (c) Life-
time of PL proposals: Red arrow represents sample which
is labeled as PL and falls in NPL status after the outcome
period.
Figure 3: Types of information.
founder. Moreover, better educated and experienced
founders can be good at finding opportunities by an-
alyzing the market better (Wang, 2012). Therefore,
using owners’ personal features or shareholders’ fea-
tures such as age, education level, marital status, etc.
can bring a new perspective for analyzing SME credit
risk. To represent owner’s and shareholder’s demo-
graphical properties, education levels, age, gender,
birth place, net salary, total work year, capital share
features are utilized. Also, to get information about
customer’s risk on other banks, customer reports from
the Credit Bureau of Turkey (KKB) are gathered.
If a customer’s likelihood to become NPL on one
product type increases, it is quite likely the customer
will also fall in NPL on other products. Also, for
SMEs unlike consumer loans, NPL state of one of
the products in its proposal means NPL of the SME
customer. Therefore, it is reasonable to assess cus-
tomers according to their behaviour performance on
all of their used products. There are many (77) dif-
ferent types of products offered to SME customers,
in order to focus on dominantly used products, most
frequently preferred products are chosen in scope of

Table 1: Coverage rates of chosen products.
Product Name Usage Rate
Business Card 20%
Cheque-Book 13%
Corporate Installment Loan 12%
SUM 55%
this experimental study. To evaluate customer perfor-
mance on remaining less frequently used products, in-
stead of using product specific features, features about
delinquency behaviour on all remaining products are
preferred. Chosen products and their coverage rate
among all products are showed on Table 1. For busi-
ness card, features of customer’s status which repre-
sents delinquency rate, doubtful transactions, etc. are
collected as well as card features such as card limit,
cash limit, maximum withdrawn cash amount. For
cheque-book, total risk amount and cheque-book sta-
tuses of whether it is granted before expiration fea-
tures are utilized. For corporate installment loan,
delinquency behaviour of installments is included in
feature set.
Similar to predicting risk of large corporations,
using financial data of the company also highlights
risk of SME (Wang, 2012). Therefore, balance-sheet,
which presents a company’s financial position at a
point in time, is used to gain insight about SME’s
financial status. However, in Turkey, SMEs do not
have to provide balance-sheet for credit application if
its total revenue is less than 250.000TL. Unsurpris-
ingly, most of SMEs’ total revenue are not greater
than the limit, and they do not volunteer to provide
extra information. This situation causes missing val-
ues. However, instead of eliminating these observa-
tions, utilizing all available information is preferred.
Zero-padding method which fills missing values with
zero is utilized for this kind of missing values.
Finally similar to credit scoring applications, ap-
plication form data which provides knowledge about
customer and firm characteristics is also utilized dur-
ing developing the model. For firm properties, firm’s
sector, total capital, foundation date and also provided
guarantees etc. are gathered.
After choosing proposals according to determined
conditions above, class imbalance problem arises
since proportion of NPL proposals to PL ones is very
close to zero. Class imbalance problem frequently oc-
curs in credit scoring which can affect classification
models’ accuracy (Menardi and Torelli, 2013). To
avoid this situation, class imbalance is decreased by
undersampling PL samples by selecting randomly in-
stead of oversampling NPL proposals and equal num-
ber of samples from PL and NPL are selected. In to-
tal, dataset consists of 3904 samples with 366 features
where 1902 samples are NPL and others are PL.
3.2 Proposed Model
After features are determined, some of the features are
not suitable for machine learning algorithms therefore
some features are converted to numeric or categorical
values. For example while birthplace is mapped into
a categorical value, birth-date is converted to numeric
value to represent age. For experiments, RF–one of
the ensemble learning methods–is preferred since en-
semble learning methods are widely used in credit
scoring modeling and experimental results reveal that
ensemble methods can considerably improve the per-
formance (Zhou et al., 2010; Hsieh and Hung, 2010;
Wang et al., 2011). Then, data is split into train (80%)
and test set(20%) randomly where class distribution
is same and algorithms are trained and tested on these
datasets.
For further tests, feature size is increased by
adding new features to investigate effects of customer
behaviour on different products and for each stage,
model accuracy is calculated by employing RF. Base
dataset with 300 features contains all features ex-
cept customer repayment performance. 12 features
which represent delinquency information for corpo-
rate installment loan are added to the dataset and
new dataset with 312 features is obtained. Then,
while 14 features are added for cheque-book, 25 new
features associated with business cards are added to
the dataset. Finally, 15 features are utilized for all
other products’ delinquencies and feature size be-
comes 366.
After good accuracies are obtained, feature selec-
tion method is applied to discover essential features.
And also feature selection gives insight into which
types of features play an important role for SMEs
credit risk analysis.
Other machine learning algorithms (SVM, DT,
LR) are applied to compare performance of RF. For
SVM, normalization method which is commonly used
with SVM is applied to scale feature vector to [-
1, +1] during data processing. Finally, MLP which
was previously used in the bank for application scor-
ing (Derelio
˘
glu and G
¨
urgen, 2011) is implemented
to compare results. It is not possible to compare re-
sults with previously conducted researches on open
datasets since SMEs’ characteristics are directly as-
sociated with country’s economic situations.
3.2.1 Metrics
In scope of this project, accuracy(acc) and confusion
matrix are preferred for performance comparison of

machine learning algorithms and result exhibition re-
spectively. Acc, which is between 0 and 1 is obtained
by calculating proportion total number of correct pre-
dictions to total number of predictions. In confusion
matrix, cells mean following meanings: True Nega-
tive(TN) is case in which PL customer is predicted
correctly. False Positive(FP) is case in which PL cus-
tomer is misclassified. False Negative(FN) is case in
which NPL customers are classified as PL. True Posi-
tive(TP) is case in which NPL customers are classified
as NPL.
4 EXPERIMENTAL RESULTS
To investigate effects of features of product types and
also algorithms, many experiments are conducted.
Firstly, to explore effects of features, the dataset is en-
hanced incrementally and experiments are conducted
by utilizing RF. And then, to compare algorithms for
credit risk analysis, different algorithms are imple-
mented and obtained results and experiment steps will
be discussed in detail in the following section.
4.0.1 Investigating the Predictive Power of
Features of Different Products
In order to certify predictive power of customer be-
haviour on different products, feature size is increased
by adding new behaviour data on different products.
This lets us to query whether behavioural analysis is
powerful for analyzing credit risk. As mentioned be-
fore, base dataset consists of 300 features except re-
payment behaviour. To obtain base results, the dataset
is divided into training and test sets. Subsequently,
RF algorithm is employed. The resulting algorithm
is tested 20 times and obtained max, min, mean and
variance of results are shown in Table 2. For further
analysis, confusion matrix of one of the test results is
presented in Table 3.
Table 2: Base results.
Mean STD MAX MIN
Base Features 74.65% 1.99% 76.55% 69.83%
As mentioned before, new feature types are added
one by one to dataset and experiments are conducted
by using RF. After features of repayment performance
on a product are added, samples are shuffled and
tested 20 times. Each feature set of new product type
is added to the previously constructed dataset. Ob-
tained results are shown in Table 4. As it can be seen
in Table 4 easily, enriching the dataset by adding cus-
tomer behaviour data enables us to analyze consumer
Table 3: Confusion matrix of base features.
PREDICTION
PL NPL
GROUND PL 74.9% 25.1%
TRURH NPL 23.8% 76.2%
Table 4: Effects of customer behaviour information on dif-
ferent products.
Product Type Mean STD MAX MIN
Base Features 74.65% 1.99% 77.03% 69.83%
Installment Loan +0.10% -0.09% +0.75% +1.38%
Cheque-Book +1.37% -0.41% +0.78% +0.72%
Business Card +1.68% -0.16% +3.46% +3.89%
Other Products +2.15% -0.41% +0.38% +2.18%
risk better. Adding customer behaviour data not only
increases accuracy but also makes model stable by de-
creasing standard deviation. To analyze the effects of
features on different classes, confusion matrices ob-
tained by using all features and base features are pre-
sented in Table 5. As Figure 5 indicates, using cus-
tomer behaviour data has positive effect on accuracy
of both PL and NPL classes. Although the results are
calculated by averaging accuracies obtained by test-
ing 20 times on differently shuffled dataset, it is a
good approach to compare the effects of feature types
obtained by testing on training and test sets which
consist of same samples. Hence, the feature types are
compared on the same dataset, and obtained results
are presented in Figure 4. As Figure 4 illustrates, the
results are in line with previous results. Obtained re-
sults are discussed with credit experts to check valid-
ity of the results, and it is agreed upon that prediction
accuracy of the system is enough for the first step of
the production deployment.
To be aware of which features play a major role for
risk analysis, features are scored using RF and in light
of these scores, 15 features with the highest score are
determined. The selected features are shown at Table
6. On closer inspection, in the list of the best 15 fea-
tures, most of them are behaviour features and this in-
dicates that repayment features play a significant role
in predicting SMEs which will fall in NPL in period
of six months.
Table 5: All features.
ALL FEATURES BASE FEATURES
82.9% 17.1% 74.9% 25.1%
18.4% 81.6% 23.8% 76.2%
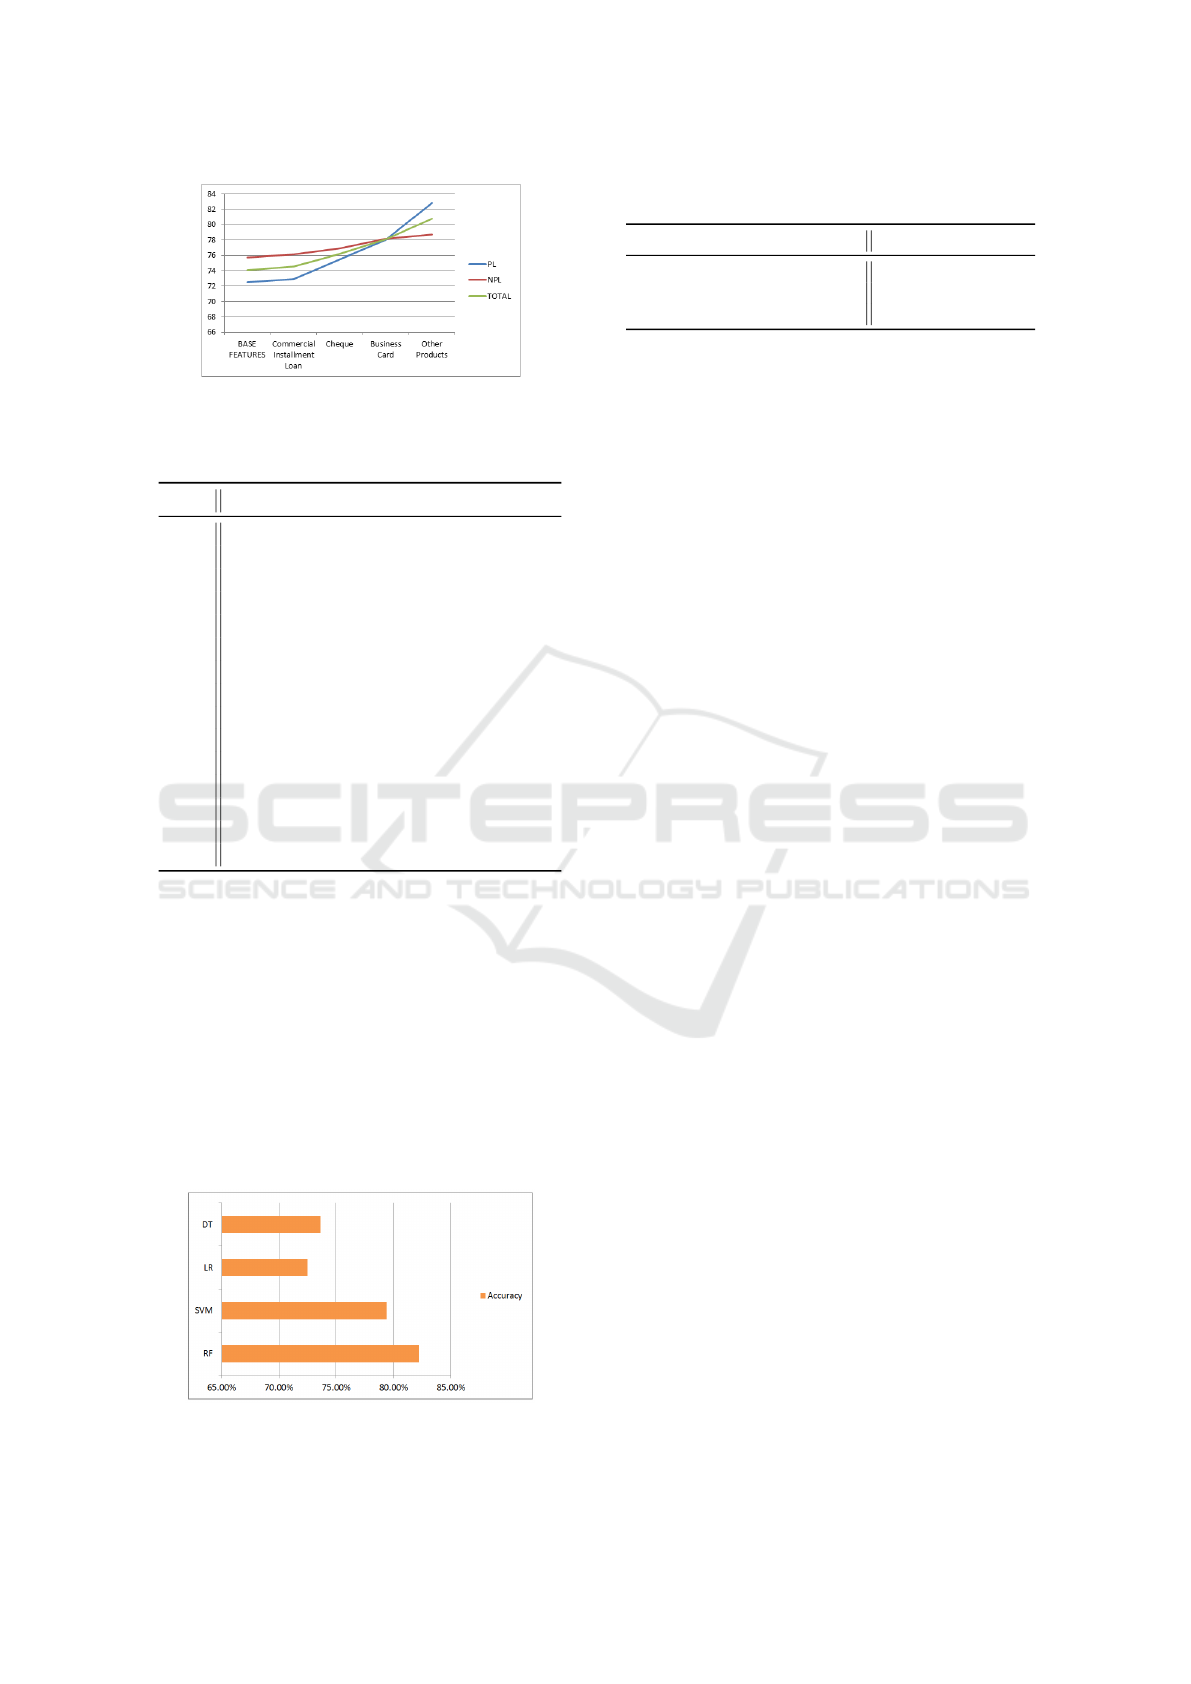
Figure 4: Effects of different information types on same
dataset.
Table 6: Types of most important 15 features.
Index Feature Types
1 Repayment Behaviour on Other Products
2 Repayment Behaviour on Other Products
3 Customer Demographic Information
4 Repayment Behaviour on Other Products
5 Application Form
6 Repayment Behaviour on Business Card
7 Repayment Behaviour on Business Card
8 Repayment Behaviour on Business Card
9 Credit Bureau of Turkey (KKB)
10 Application Form
11 Repayment Behaviour on Other Products
12 Repayment Behaviour on Cheque-Book
13 Application Form
14 Repayment Behaviour on Business Card
15 Repayment Behaviour on Business Card
4.0.2 Investigating the Power of Different
Machine Learning Algorithms
Many machine learning algorithms were utilized for
customer risk analysis which aims to decide whether
customer will become NPL in the future, to the best
of our knowledge, there is not so many studies for
forecasting customer status in next six-month period.
Therefore, other machine learning algorithms which
are LR, DT and SVM are also implemented to com-
pare performance of algorithms. All algorithms are
trained and tested on the same dataset which consists
Figure 5: Performance comparison of machine learning al-
gorithms.
Table 7: Comparison of Two Studies.
Study Maximum Accuracy
(Derelio
˘
glu and G
¨
urgen, 2011) 76.17%
Our result with MLP 80.05%
Our result with RF 82.25%
of all feature types. Obtained results are shown in
Figure 5. RF yielded the best performance and it is
followed by SVM, DT and LR in order.
Finally, MLP is implemented which was previ-
ously used in scope of the bank for SMEs credit
risk analysis. (Derelio
˘
glu and G
¨
urgen, 2011) utilized
MLP with one hidden layer on dataset which consists
of 512 SME samples with 27 features to forecast cus-
tomer default. Comparison of results of two different
studies and algorithms on our dataset are shown on
Table 7. As Table 7 illustrated, our results are bet-
ter than the previously conducted research, however
it cannot prove that our approach is more suitable for
credit risk analysis since samples and features in the
datasets are different. The experiment is only con-
ducted since it is more sensible to compare the results
with previously conducted study in scope of the bank
than with other studies on open datasets because of
datasets having more similar characteristics.
5 CONCLUSION
We introduced a novel approach to SMEs credit risk
by forecasting customer status in the next six-month
period instead of in the future. To the best of our
knowledge, predicting customer default status in a
period, which generally conducted by utilizing sur-
vival analysis, has not been aimed for SME credit
risk to date by employing machine learning algo-
rithms. We also utilize information of repayment per-
formance along with demographic information, appli-
cation form data, credit bureau data and so on. To ex-
plore performance of customer behaviour on different
products, features for each product type are appended
to the base dataset incrementally, and the results show
that repayment performance on more commonly pre-
ferred products gives more information about SMEs
credit risk. Then, to compare information types based
on effectiveness on credit risk analysis, feature se-
lection algorithm is used and the results show that
the most of the selected features is related to cus-
tomer behaviour. Finally, all feature sets are fed into
the machine learning algorithms and experimental re-
sults show that RF provides the best prediction perfor-
mance and it is followed by SVM, DT and LR in or-
der. To compare obtained results with previously con-

ducted study in the bank, MLP is implemented and
we obtained better accuracy by using RF. Obtained
results indicate that customer repayment behaviour
on other products along with other information types
need to be investigated further for fully understand the
SMEs risk factors.
6 FUTURE WORK
As experimental results indicated, adding behaviour
data on frequently preferred products improves per-
formance over using other information types alone.
Therefore, as a future work, it is aimed to enhance
product based features by adding new product types
which will be determined according to their usage
rate. Moreover, after information types which play an
important role for SMEs risk analysis are determined,
it is planned to observe customer behaviour for an in-
terval by shifting the observation point and accord-
ing to outputs, customer status will be updated. It is
expected that, forecasting customers who will fall in
NPL on next month is likely to be easier than forecast-
ing customers who will default after 6 months. There-
fore, enriching performance data adding behaviour
on next months will provide better analysis of SMEs
credit risk. It is planned that parameter tuning pro-
cess for each machine learning algorithm to be imple-
mented at production deployment stage, since up-to-
date data in high quantities will only be available on
the deployment database.
REFERENCES
Altman, E. I. and Sabato, G. (2005). Modeling credit risk
for smes: evidence from the us market.
Banasik, J., Crook, J. N., and Thomas, L. C. (1999). Not if
but when will borrowers default. Journal of the Oper-
ational Research Society, 50(12):1185–1190.
Breiman, L. (2001). Random forests. Mach. Learn.,
45(1):5–32.
Cortes, C. and Vapnik, V. (1995). Support-vector networks.
Mach. Learn., 20(3):273–297.
Cox, D. R. (1958). Two further applications of a model for
binary regression. Biometrika, 45(3/4):562–565.
Derelio
˘
glu, G. and G
¨
urgen, F. (2011). Knowledge discov-
ery using neural approach for smes credit risk analysis
problem in turkey. Expert Systems with Applications,
38(8):9313–9318.
Gaganis, C., Pasiouras, F., Spathis, C., and Zopounidis, C.
(2007). A comparison of nearest neighbours, discrim-
inant and logit models for auditing decisions. Intel-
ligent Systems in Accounting, Finance and Manage-
ment, 15(1-2):23–40.
Galindo, J. and Tamayo, P. (2000). Credit risk assessment
using statistical and machine learning: basic method-
ology and risk modeling applications. Computational
Economics, 15(1):107–143.
Harris, T. (2015). Credit scoring using the clustered sup-
port vector machine. Expert Systems with Applica-
tions, 42(2):741–750.
Hsieh, N.-C. and Hung, L.-P. (2010). A data driven en-
semble classifier for credit scoring analysis. Expert
systems with Applications, 37(1):534–545.
Huang, C.-L., Chen, M.-C., and Wang, C.-J. (2007). Credit
scoring with a data mining approach based on support
vector machines. Expert systems with applications,
33(4):847–856.
Kim, H. S. and Sohn, S. Y. (2010). Support vector ma-
chines for default prediction of smes based on tech-
nology credit. European Journal of Operational Re-
search, 201(3):838–846.
Menardi, G. and Torelli, N. (2013). The effect of train-
ing set selection when predicting defaulting small and
medium-sized enterprises with unbalanced data. The
Journal of Credit Risk, 9(4):47.
Noh, H. J., Roh, T. H., and Han, I. (2005). Prognostic per-
sonal credit risk model considering censored informa-
tion. Expert Systems with Applications, 28(4):753–
762.
Sarlija, N., Bensic, M., and Zekic-Susac, M. (2009). Com-
parison procedure of predicting the time to default in
behavioural scoring. Expert Systems with Applica-
tions, 36(5):8778–8788.
Thomas, L. C. (2000). A survey of credit and be-
havioural scoring: forecasting financial risk of lend-
ing to consumers. International journal of forecast-
ing, 16(2):149–172.
Thomas, L. C., Ho, J., and Scherer, W. T. (2001). Time
will tell: behavioural scoring and the dynamics of con-
sumer credit assessment. IMA Journal of Management
Mathematics, 12(1):89–103.
Wang, G., Hao, J., Ma, J., and Jiang, H. (2011). A compar-
ative assessment of ensemble learning for credit scor-
ing. Expert systems with applications, 38(1):223–230.
Wang, W. (2012). How the small and medium-sized en-
terprises owners credit features affect the enterprises-
credit default behavior? E3 Journal of Business Man-
agement and Economics., 3(2):090–095.
Zhou, L., Lai, K. K., and Yu, L. (2010). Least squares sup-
port vector machines ensemble models for credit scor-
ing. Expert Systems with Applications, 37(1):127–
133.
