
A Pilot Study to Examine the Activity of Primary Plantar Flexor Muscles
using an Electric Motorized Treadmill in Comparison to Overground
Walking
Katja Orlowski
1
, Dennis Wagner
1
, Annett l’Orteye
2
, Heike Ringk
3
,
Verena Kohl
3
and Thomas Schrader
1
1
Department of Computer Science and Media, Brandenburg University of Applied Sciences,
Magdeburger Str. 50, Brandenburg, Havel, Germany
2
St
¨
adtisches Klinikum Brandenburg, Medical School, Brandenburg, Havel, Germany
3
Helios Fachklinikum Brandenburg Hohenst
¨
ucken, Brandenburg, Havel, Germany
Keywords:
Overground Walking, Treadmill Walking, Plantar Flexor Muscles, Walking Velocity.
Abstract:
The gait during overground (OG) and treadmill (TM) walking was already investigated by different scientific
groups. Differences in the muscle activation and in the kinetics were found. The aim of the present exami-
nation was to find conditions for a comparable or higher activation of the plantar flexor muscles during TM
walking in order to give recommendations for training and rehabilitation. A pilot study with different condi-
tions (e.g. with and without inclination) was done. Furthermore, the aspect of different walking velocities in
OG and TM walking was investigated. The self selected speed was reduced during TM walking (1.1 km/h).
Regarding the muscle activation, it is recognizable that the primary plantar flexor muscles react similarly. The
activation is reduced during TM walking. Based on the inclination of 1.5 %, a little larger activity during
TM walking is observed for the muscles M. gastrocnemius medialis and lateralis. Our results confirm that
there are differences between OG and TM walking in the activation of the primary plantar flexor muscles.
The results indicate that there is an effect of different, adjustable conditions (speed and inclination). Further
examinations are planned to find detailed information about the different conditions and their impact on the
muscle activation.
1 INTRODUCTION
Treadmills are used in the fields of sport and rehabili-
tation due to the required space for walking/running
large distances. That is why a treadmill is often used
for the repetitive exercise of walking in rehabilitation
routines or for training aspects in order to pass
longer distance with a defined speed. The applied
treadmills are mostly electric motorized treadmills.
The person, who is walking on the treadmill, is to
some extent moved by the motor which is integrated
in the treadmill. However, on the market there
are also self-powered treadmills, so called manual
treadmills. Using such a treadmill, the motion during
walking is created by the muscle strength of the
running or walking person. In spite of this offer, in
most institutions, electric motorized treadmills are
available and used for walking.
In patients with cerebral palsy (CP) the plantar flexor
muscles are weakened, and gait deviations exist. CP
occurs in different types, for example, the dropped
foot (Type 1) or the equine foot (Type 2A) (Tugui
and Antonescu, 2013). The gait of patients with an
equine foot has a spasticity in the primary plantar
flexors, the muscles M. gastrocnemius medialis and
lateralis and M. soleus. Furthermore, a spasticity
in the M. tibialis posterior is present. Due to that
spasticity, the plantarflexion cannot be executed in an
adequate way. Following the gait of these patients is
characterized by walking on the tiptoes because the
gait cycle (stride) is not initiated by the heel strike.
The different phases and subphases of the gait of CP
patients are impaired and do not proceed as described
for the physiological gait (Perry and Burnfield, 2010;
Whittle, 2007). The aim of therapeutic interventions
is to strengthen these plantar flexor muscles and
harmonize the gait in order to prevent secondary
diseases. For that reason, a treadmill is used in a
physiotherapeutic intervention to improve the gait of
CP patients by repetitive walking.
Orlowski K., Wagner D., l’Orteye A., Ringk H., Kohl V. and Schrader T.
A Pilot Study to Examine the Activity of Primary Plantar Flexor Muscles using an Electric Motorized Treadmill in Comparison to Overground Walking.
DOI: 10.5220/0006498600330038
In Proceedings of the 5th International Congress on Sport Sciences Research and Technology Support (icSPORTS 2017), pages 33-38
ISBN: 978-989-758-269-1
Copyright
c
2017 by SCITEPRESS – Science and Technology Publications, Lda. All rights reserved

Oliveira et al. (2016) investigated the muscle
activation during overground (OG) and treadmill
(TM) walking. Their results confirm that there are
differences in the muscle activation in both scenarios
(Oliveira et al., 2016). The M. soleus showed a larger
activation in terms of a higher peak and a larger
integral during overground walking. In contrast to
the activation of the M. soleus, the M. gastrocnemius
medialis is more activated in the treadmill setting.
The M. gastrocnemius lateralis reacted neither as the
M. soleus nor as the M. gastrocnemius medialis. This
muscle has a larger peak for the treadmill setting, but
a larger integral for the overground setting. Van der
Krogt et al. (2015) found differences in the kinetics
of children with CP in OG and TM walking (van der
Krogt et al., 2015).
During sport training sessions treadmills are used
for warmups, cooldowns, running independetly from
the weather conditions or for fitness aspects. Indeed,
strengthing the muscles of the lower limbs is not
the primary focus of the athletes. Nevertheless, the
question of muscle activation during walking on the
treadmill with different conditions (e.g. velocity
and inclination) is also interesting to sportsmen and
coaches. That’s why the current pilot study focuses
on the difference between overground and treamill
walking with the main focus on muscle activity of
primary plantar flexor muscles. In addition, the
difference of walking velocity during OG and TM
walking is considered.
Due to these two main topics two hypotheses are
investigated. The first belongs to the muscle activity
during TM walking in comparison to OG walking. It
is assumed that the muscles are less activated during
TM walking than during OG walking due to the
motorization of the TM. The second hypothesis refers
to the comfortable walking speed in both walking
scenarios. It is assumed that during TM walking the
person chooses a lower comfortable walking speed
than in OG walking.
Regardless of the aspects that have to be considered
by using treadmills in therapeutic settings, there
are different, important issues for athletes. Conse-
quently, an examination with healthy subjects was
performed to prove the assumption that the plantar
flexor muscles are less activated during TM walking.
Furthermore, the aim of the conducted examination
was to find conditions for a comparable or even
higher activation of the muscles during treadmill
walking.
2 METHODS AND MATERIALS
Different tests were done to prepare the pilot study
and to find out which TM settings (speed and incli-
nations) are recommendable. The literature describes
a reduced velocity on the TM for runners (Arsenault
et al., 1986; Nymark et al., 2005; Kong et al., 2012;
Marsh et al., 2006). During own tests, this fact was
also noticed for the walking on a TM. Due to the mo-
torization, the comfortable, self-selected speed dur-
ing TM walking is perceived differently. For that rea-
son, an additional investigation was done with 21 sub-
jects (14 f, 7 m, age: 28.9 (± 9.1) years) to quantify
the speed difference of both settings. First, the self-
selected speed for each subject was determined by the
OG setting based on four 20m walking trials. The
mean velocity was calculated. Subsequently, the com-
fortable speed during TM walking was determined in
two trials starting once with a continuous increase of
speed from a slow velocity (0.5 km/h) and once with a
continuous decrease of speed from a fast velocity (7.0
km/h). The order was applied in a randomized way.
The gait of 23 young and healthy subjects (8 male, 15
female, age: 25.6 (± 5.4) years, height: 170 (± 10)
cm, weight: 69.0 (± 13.0) kg) was examined. The
activation of the muscles M. soleus (SO), M. gastroc-
nemius medialis (GM) and lateralis (GL), the primary
plantar flexor muscles, was registered using EMG-
sensors with an 8-channel measuring device of biosig-
nalplux (Plux Wireless Biosignals S.A., Lisbon, Por-
tugal). In order to guarantee a stride-based analysis of
the muscle activation, the gait was additionally cap-
tured using two 3D-accelerometers. These sensors
were fixed on each heel in order to detect the heel
strike as the initial event of the gait cycle.
In the OG setting the subjects passed six trials of a
40 m straightforward distance. They were asked to
choose their comfortable walking speed during OG
walking which was registered for each trial. Based
on the noticed walking speed of the six OG trials the
mean value was determined. Following the OG set-
ting, each subject passed two walking trials on the
TM, one without inclination (TM1) and another with
an inclination of 1.5 % (TM2) following the recom-
mendations of the literature (Jones and Doust, 1996;
Heck et al., 1985; Vanhelst et al., 2009). Each of the
TM trials has nearly the same length as all OG trials
together to guarantee the almost the same amount of
gait cycle in both settings are registered. Furthermore,
a 1 km/h reduced speed was chosen for the TM tri-
als based on the literature (Kong et al., 2012; Marsh
et al., 2006) and own examinations (see results be-
low). A randomization of the testing order could not
be performed due to the adjustment of the TM speed
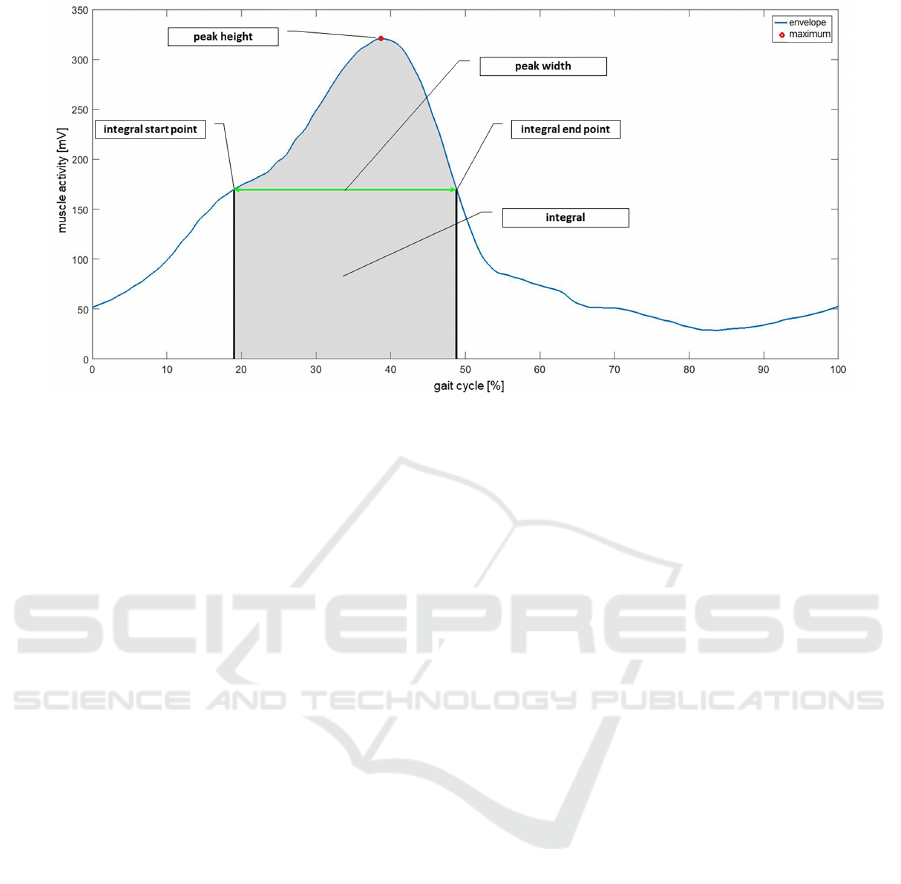
Figure 1: The mean EMG curve and marked the four calculated parameters: peak height (x and y), peak width and the integral.
which results from the OG setting.
Data Processing
Based on the detection of the gait cycle the stride-
based activity of the muscles can be determined,
and the mean EMG signal can be calculated after an
appropriate filtering, rectification of the signal and
the calculation of the envelope curve by using the
root mean square (RMS) (Pfeifer et al., 2003). A
finite impulse response (FIR) bandpass filter 1000
th
order with a frequency bandwidth of 20 - 300 Hz
was used for filtering the raw EMG signals (Criswell,
2011; Miller et al., 2012; Mitchell et al., 2015).
Data Analysis
Four parameters were calculated for each set-
ting (OG, TM1 and TM2) as visualized in figure 1.
The peak height as the maximum of the average EMG
signal in terms of the temporal occurrence (in percent
of the gait cycle) and the amplitude (peak height in
mV). In addition to the peak height, the peak width
and the integral under the curve (EMG signal) was
calculated. For calculating the peak width and the
integral, two points have to be detected in the mean
EMG curve. These two points, the integral start and
end point, are located on the EMG curve at 50 % of
the peak height (detected maximum of the EMG), see
figure 1.
These parameters were analyzed descriptively and
regarding significant differences. For the descriptive
analysis, the mean value of the OG and TM muscle
activity from all trials and all subjects, the mean
difference between OG and TM (OG vs. TM1,
OG vs. TM2) as well as the percentual quotient
between OG and TM walking (TM1 or TM2) was
calculated. Concerning the parameter peak height, a
value smaller than 100 % indicates a lower activation
of the plantar flexor muscles during TM walking.
The whole analysis (preprocessing, heel strike
detection, calculation of mean EMG curve and
parameters, statistical analysis) was done in MAT-
LAB (TheMathworks Inc., Natick, MA, USA).
The calculated parameters were tested for normal
distribution by using the Kolmogorow-Smirnov test.
Paired students t-tests were used for parameters with
normal distribution (Atkinson and Nevill, 1998).
The level of significance was set to α = 0.05 for the
above-mentioned statistical tests.
3 RESULTS
The results of the preliminary walking speed inves-
tigations are presented in detail with a bar chart in
figure 2 as well as using a boxplot for summarizing
the data of all subjects (figure 3). The mean speed for
each subject in each setting is depicted in the bar chart
(see figure 2). Furthermore, the diagram included the
difference of the mean speed (OG and TM) as a red
graph. Variations around 1 km/h are recognizable.
The overall mean is 1.1 km/h with a standard devia-
tion of 0.6 km/h. The differences in walking speed of
both scenarios are clearly visible in the boxplot (see
figure 3). The presented median values of the OG and
TM walking show significant difference. Noticeable
is the shape of the boxplots which varies clearly.
The examination of the muscle activity during OG
and TM walking dedicates the four parameters: maxi-
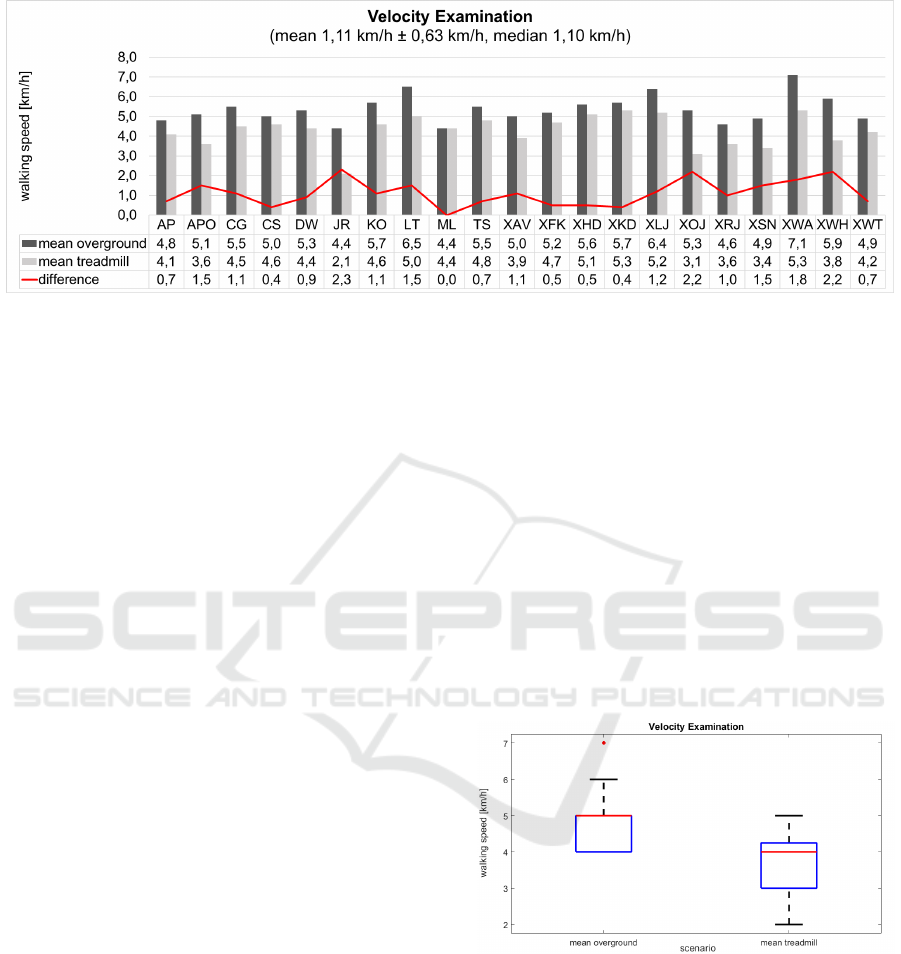
Figure 2: The registered mean velocity for both settings (overground in dark grey and treadmill in light gray) and each of the
21 subjects is given as bar chart. The difference between both settings is presented as red curve. In addition, the values are
given below the chart and the mean and median velocity is stated.
mum peak (height, the amplitude in mV and temporal
occurrence in percent), the peak width and the integral
(the area under the curve). The determined values are
presented in the following tables 1 - 3. Comparing all
the values for the three examined muscles, it is recog-
nizable that the primary plantar flexor muscles react
similarly and a reduced activation during TM walk-
ing exist.
The TM gait without inclination causes a lower activ-
ity of all three muscles in comparison to the OG walk-
ing. The calculated difference for the parameter peak
height (amplitude in mV) with negative values as well
as the quotient with values smaller than 100 % con-
firm that fact quantitatively (GM: 83.9 %, GL: 75.5 %,
SO: 68.9 %). Based on the used inclination of 1.5 %,
a little larger activity during TM walking (TM2) is
observed for the muscles GM and GL (GM: 91.3 %,
GL: 79.6 %), but a similar or even larger activation
could not be achieved with the chosen inclination.
The determined parameter peak width is always
smaller for the OG walking resulting in negative dif-
ference and percentual values above 100 % (see ta-
ble 1 - 3). The chosen inclination shows an effect to
the parameter peak width. The value determined for
the TM2 scenario is smaller than that calculated for
the TM1 scenario (GM: 113.6 % vs. 105.4 %, GL:
145.8 % vs. 125.6 %, SO: 148.4 % vs. 129.3 %).
Considering the parameter integral under the curve
(under the peak) the difference is always negative, and
the quotient is smaller than 100 %, but no uniform
behavior can be registered. The muscles GL and SO
show a reduced activation during the TM2 scenario
(with the 1.5 % inclination) compared to TM1 setting
(without inclination) (GL: 99.9 % vs. 95.7 %; SO:
96.4 % vs. 86.4 %), while the integral of the muscle
GM increases (GM: 94.0 % vs. 96.3 %).
All the parameters and the found differences are fur-
ther investigated using t-test regarding significant dif-
ferences. As marked in the tables below the differ-
ences are significant. The calculated correlation co-
efficient also confirms this significant difference with
values smaller than 0.5 showing no good agreement.
Additionally, the temporal occurrence of the maxi-
mum peak was determined and considered in the in-
vestigation. This parameter shows no significant dif-
ference between the compared settings (p > 0.05)
with moderate to high correlation coefficient (r =
[0.66, 0.92]) for the small differences between the
mean of OG and TM setting ranging from -0.77 to
0.45 % (see mean difference of the parameter peak
occurence in tables 1 - 3).
Figure 3: Boxplots of the walking speed during the two
walking scenarios (overground and treadmill) with a higher
median walking speed for the overground setting.
4 DISCUSSION AND
CONCLUSION
The velocity examination shows that the motorization
of the treadmill affects the perception of self selected
comfortable walking speed. On average, the walking
speed on the TM is reduced by approximate 1 km/h

Table 1: Parameters of the OG walking compared to the TM walking (TM1 and TM2) of the muscle M. gastrocnemius
medialis (GM). * stands for p<0.01 and ** for p<0.05.
GM Parameter mean OG mean TM mean difference mean quotient (%)
OG vs. TM1 Peak occurence (%) 38.00 37.30 -0.70 98.21
peak height (mV) 4722.93 3963.36 -759.57* 83.92
peak width (%) 23.18 26.33 3.15* 113.59
integral (UA) 84305.29 79261.56 -5043.73** 94.02
OG vs. TM2 Peak occurence (%) 38.00 37.88 -0.12 99.63
peak height (mV) 4722.93 4312.86 -410.07* 91.32
peak width (%) 23.18 24.42 1.24 105.36
integral (UA) 84305.29 81169.29 -3136.00** 96.28
Table 2: Parameters of the OG walking compared to the TM walking (TM1 and TM2) of the muscle M. gastrocnemius lateralis
(GL). * stands for p<0.01.
GL Parameter mean OG mean TM mean difference mean quotient (%)
OG vs. TM1 Peak occurence (%) 40.52 40.52 0.00 99.96
peak height (mV) 3470.75 2621.18 -849.57* 75.52
peak width (%) 20.14 29.36 9.22* 145.80
integral (UA) 54551.43 54472.49 -78.93 99.86
OG vs. TM2 Peak occurence (%) 40.52 40.97 0.45 101.08
peak height (mV) 3470.75 2763.14 -707.61* 79.61
peak width (%) 20.14 25.29 5.16* 125.60
integral (UA) 54551.43 52228.61 -2322.81 95.74
Table 3: Parameters of the OG walking compared to the TM walking (TM1 and TM2) of the muscle M. soleus (SO). * stands
for p<0.01.
SO Parameter mean OG mean TM mean difference mean quotient (%)
OG vs. TM1 Peak occurence (%) 41.61 41.56 -0.09 99.76
peak height (mV) 2575.85 1773.51 -802.34* 68.85
peak width (%) 20.22 30.00 9.78* 148.39
integral (UA) 39982.37 38522.78 -1459.59 96.35
OG vs. TM2 Peak occurence (%) 41.61 41.74 0.13 100.32
peak height (mV) 2575.85 1720.35 -855.50* 66.79
peak width (%) 20.22 26.13 5.91* 129.25
integral (UA) 39982.37 34550.92 -5431.45* 86.42
compared to the walking velocity in the OG setting.
The literature shows similar results, but partly not in
these dimensions. In walking scenario, Arsenault et
al. (Arsenault et al., 1986) and Marsh et al. (Marsh
et al., 2006) found a difference in speed of 0.3 km/h
or 1.4 km/h, respectively. Oliveira et al. (Oliveira
et al., 2016) and Kong et al. (Kong et al., 2012) inves-
tigated running scenarios and registered differences in
the self-selected and comfortable running velocity of
0.4 km/h or 4.2 km/h.
Considering the muscle activation during walking, the
results of our investigations confirm that there are dif-
ferences between OG and TM walking. The consid-
ered hypothesis that the primary plantar flexor mus-
cles are less activated during TM walking than in OG
walking can be verified with the present results con-
sidering the parameter peak height. Referring the pa-
rameter peak occurence no difference in the temporal
appearance of the maximum activation of the plantar
flexor muscles could be found in the investigated sam-
ple. At the moment, the effect represented by the pos-
itive difference between the settings (OG vs. TM1,
OG vs. TM2) of the parameter peak width resulting
in a percentual quotient larger than 100 % cannot be
interpreted. Compared to the OG walking the activa-
tion curve shows a broader but flatter course for the
TM walking. That means that the muscle is earlier
and longer activated during the gait cycle. The reason
for that phenomenon is currently unknown.
The statements published by Oliveira et al. can only
be partially confirmed (Oliveira et al., 2016). The au-
thors found a higher activation of the SO and a lower
activation of the GM and GL during OG walking.
Compared to our approach Oliveira et al. (Oliveira

et al., 2016) examined the muscle activation while
overground and treadmill running. In contrast, our
findings show a higher activation for all primary plan-
tar flexor muscles during OG walking.
The determined parameters of the muscle activation
indicate that there is an effect of different, adjustable
conditions (speed and inclination). Using the recom-
mended inclination of 1.5 %, a little higher activation
of the primary plantar flexor muscles is recognizable.
With the exception of SO showing a decrease, an in-
crease in muscle activation of 4 to 7 % was observed.
However, the temporal occurrence of the maximum
activation of the muscles is not influenced by these
conditions.
In future, examinations are planned to find detailed
information about the different conditions and their
impact on the muscle activation in order to find rec-
ommendations for therapeutic interventions or train-
ing programs. For achieving the goal, these facts are
important to know.
Furthermore, investigations with CP patiens should
be conducted in order to find the impact of the con-
ditions to the gait and the muscle activation of these
patients. Depending on the CP-type the setting and
the detection of gait initiation have to be changed.
REFERENCES
Arsenault, A. B., Winter, D. A., and Marteniuk, R. G.
(1986). Treadmill versus walkway locomotion in hu-
mans: an emg study. Ergonomics, 29(5):665–676.
Atkinson, G. and Nevill, A. (1998). Statistical methods for
assessing measurement error (reliability) in variables
relevant to sports medicine. Sports Med, 26:217–238.
Criswell, E. (2011). Cram’s introduction to surface elec-
tromyography. Jones and Bartlett, Sudbury, MA.
Heck, H., Mader, A., Hess, G., Mucke, S., Muller, R., and
Hoflmann, W. (1985). Justification of the 4-mmol/l
lactate threshold. International Journal of Sports
Medicine, 6:117 – 130.
Jones, A. M. and Doust, J. H. (1996). A 1outdoor running.
Journal of Sports Sciences, 14(4):321 – 327.
Kong, P. W., Koh, T. M., Tan, W. C., and Wang, Y. S. (2012).
Unmatched perception of speed when running over-
ground and on a treadmill. Gait & Posture, 36(1):46 –
48.
Marsh, A. P., Katula, J. A., Pacchia, C. F., Johnson, L. C.,
Koury, K. L., and Rejeski, W. J. (2006). Effect of
treadmill and overground walking on function and at-
titudes in older adults. Medicine and science in sports
and exercise, 38(6):1157–1164.
Miller, R. H., Umberger, B. R., Hamill, J., and E., C. G.
(2012). Evaluation of the minimum energy hypothesis
and other potential optimality criteria for human run-
ning. Proceedings of the Royal Society, (279):1498–
1505.
Mitchell, M., Yarossi, M., Pierce, D., and Garbarini, E. a. G.
(2015). Reliability of surface emg as an assessment
tool for trunk activity and potential to determine neu-
rorecovery in sci. Spinal Cord, 53(3):368–374.
Nymark, J. R., Balmer, S. J., Melis, E. H., Lemaire, E. D.,
and Millar, S. (2005). Electromyographic and kine-
matic nondisabled gait differences at extremely slow
overground and treadmill walking speeds. Journal of
Rehabilitation Research and Development, 42(4):523
– 534.
Oliveira, A. S., Gizzi, L., Ketabi, S., Farina, D., and Ker-
sting, U. G. (2016). Modular control of treadmill vs
overground running. PLOS ONE, 11(4):1–19.
Perry, J. and Burnfield, J. M. (2010). Gait analysis : normal
and pathological function. SLACK.
Pfeifer, K., Vogt, L., and Banzer, W. (2003). Kinesiologis-
che elektromyographie (emg). Deutsche Zeitschrift fr
Sportmedizin, (11):331 – 332.
Tugui, R. G. and Antonescu, D. (2013). Cerebral palsy gait,
clinical importance. Maedica a Journal of Clinical
Medicine, (8):388 – 393.
van der Krogt, M. M., Sloot, L. H., Buizer, A. I., and Har-
laar, J. (2015). Kinetic comparison of walking on a
treadmill versus over ground in children with cerebral
palsy. Journal of Biomechanics, 48(13):3577 – 3583.
Vanhelst, J., Zunquin, G., Theunynck, D., Mikulovic, J.,
Bui-Xuan, G., and Bghin, L. (2009). Equivalence of
accelerometer data for walking and running: Tread-
mill versus on land. Journal of Sports Sciences,
27(7):669–675.
Whittle, M. W. (2007). Gait analysis : an introduction.
Butterworth-Heinemann, Edinburgh New York.
