
Advances in Curling Game Information Analysis by Considering
Starting Position
Hiromu Otani
1
, Fumito Masui
1
, Hitoshi Yanagi
2,3
and Michal Ptaszynski
1
1
Graduate School of Kitami Institute of Technology, 165, Kouen-cho, Kitami, Japan
2
Common Course, Kitami Institute of Technology, 165, Kouen-cho, Kitami, Japan
3
High Performance Committee, Japan Curling Association, 1-1-1, Jin-nan, Shibuya-ku, Tokyo, Japan
Keywords:
Curling Informatics, Digital Scorebook, Tactics and Strategy, Game Information, Game Score, Shot Accuracy,
Starting Position, Correlation, Test for the Equality of Several Correlation Coefficients.
Abstract:
Japanese curling teams have been recently preparing for Pyeongchang Winter Olympics in 2018. In curling,
there are three factors influencing game performance: physical factor, human factor, and strategic/tactical
factor. The strategic/tactical factor is considered as the most important at top level. To support the strate-
gic/tactical factor, we proposed the concept of Curling Informatics. As the first step of Curling Informatics we
developed a digital scorebook iCE for digital collection of game information, storing it in a database and per-
forming further analysis to improve player performance. In this article, we further contribute to this project by
analyzing game information of world national top level teams. We have previously confirmed that correlation
between shot accuracy and game score could differ with the team level or position. We also found out that
selected tactics and psychological pressure on opponent team has impact on game result. However, previous
analyses disregarded the order of teams in play, which could result in confusion of strategic tendencies or play
characteristics. In this paper, we carried out analysis of correlations of shot scores considering whether the
teams started as the first or the second. We did this to specify the process of how the team strategy/tactics
influences game results.
1 INTRODUCTION
Japanese curling teams have greatly improved their
performance in recent years. For example, Japan na-
tional curling team won second place at the Women’s
World Championship 2016 in Saskatchewan, Canada,
thus winning a medal for the first time. In addition,
both men and women players have been achieving ex-
cellent results, which allowed them to qualify for the
Pyeongchang Winter Olympics in 2018. In the back-
ground of this success, there are various strengthen-
ing programs developed for Japanese curling (Yanagi
and Miyakoshi, 2011; Takahashi, 2011; Masui et al.,
2016).
However, it is still necessary to continue working
on strengthening such support in order to make Japan
capable of obtaining a medal at the Pyeongchang
Winter Olympics, which will take place next year.
For example, Japan played against Switzerland three
times including round robin (type of a tournament in
which every team competes against every other team
in turns). This suggests that Japan should have al-
ready captured the tactics of Swiss team which should
help in winning a gold medal or at least improve
the team’s ranking during the Pyeongchang Winter
Olympics in 2018.
An Information Science approach can be men-
tioned as an example of a method for improving the
performance of a team. In the past few years a number
of cases to support sports with ICT (Information and
Communication Technology) have been reported (Fu-
jimura and Sugihara, 2004; Kagawa, 2006), including
curling (Masui et al., 2016). As an example of that,
our group proposed a new field called Curling Infor-
matics (Masui et al., 2016).
As Figure 1 shows, the research field of Curling
Informatics deals with strategic and tactical factors of
top curling teams and improves the strategic and tac-
tical skills of curling players. It also focuses on re-
alizing several support environments, such as record-
ing and referring to game information, tactical naviga-
tion, and assistance for reflection and tactical training.
Specifically, general plan developed within this field
aims at implementing the methods to (1) collect, (2)
Otani H., Masui F., Yanagi H. and Ptaszynski M.
Advances in Curling Game Information Analysis by Considering Starting Position.
DOI: 10.5220/0006498800890095
In Proceedings of the 5th International Congress on Sport Sciences Research and Technology Support (icSPORTS 2017), pages 89-95
ISBN: 978-989-758-269-1
Copyright
c
2017 by SCITEPRESS – Science and Technology Publications, Lda. All rights reserved

Figure 1: The concept of Curling Informatics (Masui et al., 2016).
analyze, (3) visualize and (4) share game information.
In the first step, Masui et al. developed a digi-
tal scorebook iCE which runs on a tablet computer to
collect and analyze game information and they con-
firmed validity of the system (Masui et al., 2016). As
one of the applications of iCE, it is possible to check
the shot accuracy of each team or player based on col-
lected information sequentially and visually.
In the next step, we have analyzed the data col-
lected with the iCE application focusing on the re-
lation between shot accuracy and game score. Masui
analyzed iCE data and confirmed that there is a strong
correlation between the difference in shot accuracies
and the difference in game scores and that correla-
tion between shot accuracy and game score differ with
level of team or player (Masui et al., 2016).
In addition, we (Otani et al., 2016) analyzed game
information of the Sochi Winter Olympics in 2014
and confirmed that correlation of the world national
top level was lower than the Japanese top level and
that the selected strategies/tactics and psychological
pressure on the opponent team had an impact on game
result .
However, because this analysis did not consider
the order of teams in play (whether the team started
as first, or second), it could contain confused infor-
mation about tendencies in strategies or play charac-
teristics.
In this paper, we advanced the analysis of the rela-
tion of shot accuracy with game score by considering
the starting positions (later called: Play First and Play
Second).
The outline of the article is as follows. Firstly,
we introduce the relevant related research in Section
2. Secondly, we describe the notions of team strategy
and shot accuracy in Section 3. Next, we provide an
overview of applied game information, and the ana-
lytical method. The results are explained in Section 5
and discussed in Section 6. In Section 7 we conclude
the paper.
2 RELATED RESEARCH
Factors influencing team’s performance in curling
include: the physical factor (ice condition), the
human factor (condition of curling player), and
the strategic/tactical factor (knowledge and tac-
tics/strategies). Bradley (Bradley, 2009) points out
the strategic/tactical factor as the most important at
top level.
As for the human factor, investigations about mo-
tion dynamics of curling stone by Shegelski et al. and
Denny et al. (Shegelski, 2000; Denny, 2002) are some
of the most known research. In recent years, Maeno
(Maeno, 2014) also reported a new motion dynam-
ics model for sliding the stone on ice. Regarding
the human factor, various research on how to train
the players and improve their condition and power
balancing, were proposed. Behm (Behm, 2009) pro-
posed an effective training method to improve the req-
uisite motion for curling. Yanagi et al. (Yanagi and
Miyakoshi, 2011) verified effective training for col-
lege level players by an experimental approach with
a college curling team. They also developed a new
sweeping brush which conveys the power of player’s

motion efficiently based on the analysis of player’s
sweeping motions from a viewpoint of biomechanics.
In addition, Tanaka introduced ICT (Information
and Communication Technology) for human factor
analysis (Tanaka et al., 2006). They attempted to
carry out an analysis of motion to deliver the stone by
utilizing a virtual model of curling environment and
players.
About the strategic/tactical factor, Igarashi et al.
proposed an application to inverse the problem for
curling by policy-gradient methods in Non-Markov
decision processes (Igarashi et al., 2007), Ura et
al. reported on calculation technique for analysis
of strategies/tactics based on game tree (Ura et al.,
2008). Also, Sung et al. analyzed game informa-
tion focusing on first rock and last rock per each end
and points out that team strategies/tactics differed in
teams which had last rock per end and other teams
(Sung, 2013).
Masui et al. suggested that there is a strong cor-
relation between the difference in shot accuracies and
the difference in the game scores (Masui et al., 2016).
In addition, they observed that Japanese national class
is stronger than Japanese junior national class, and
that the performance of Japanese national class is
rarely influenced by missed shots. It means that the
game result could be predicted before the game ends
if we knew the difference in the playing teams’ shot
accuracy. Furthermore, the correlation in world class
becomes weaker than Japanese national class because
of smaller differences in shot accuracies. It could
also be possible that the correlation is negatively in-
fluenced by outliers. It can be expected that we could
expose the process of how tactics or strategies affect
game result or difference in game scores by analyzing
the games of outliers.
Otani et al. analyzed correlation of 93 games in
Sochi Winter Olympics 2014 to verify the above as-
sumption (Otani et al., 2016). As a result, they con-
firmed that there is a strong correlation between the
difference in shot accuracies and the difference in
game scores. Although correlation of the world na-
tional top level was lower than the Japanese top level.
Additionally, they analyzed game of outliers by fo-
cusing on transition of teams’ shot accuracies for ev-
ery end of each game. As a result, they found out that
the winning team gave priority to the risk minimiz-
ing tactics and led to missed shots performed by the
losing team. Therefore, the selected tactics and pres-
sure on the opponent had an impact on game result in
which the team with superior shot accuracy lost due
to wrong strategical decisions
In curling, the team that plays as a second in turn
has a strong advantage. In other words, the plan taken
by each team differ depending on starting position.
Therefore, to extract strategic tendencies and specific
play styles, distinguish Play first from Play second po-
sitions in the analysis of game information.
3 TEAM STRATEGIES/TACTICS
AND SHOT ACCURACY
Curling is a winter sport in which two teams compete
to obtain points by throwing 16 stones at the center of
a circular area called a house in an ice-based square
area called a sheet.
One team consists of four players. Each player
throws two stones (called shot) in rotation, and the
score is calculated by each rotation, till all 16 stones
are thrown. At this time, the team that has a stone at
the nearest position to the center of the house gets the
number of points equal to the number of stones on the
inside of the opponent’s stones in the house.
One rotation is called an end. One game consists
of eight or ten ends, but the game is extended if the
score is tied in the final end (Howard, 2009; Coleman,
2014).
Curling is often called “chess on ice” because it
is a sport in which tactics plays an important role. It
requires a player to form complex strategies in search
for effective moves with consideration of the ice con-
dition, stone position in the house, etc.
Shots in curling are roughly divided into two
types: draw shot and takeout shot. In draw shots the
stone stops in the house. Takeout shots force opponent
stones out of the house. The thrown shot is given from
0 to 4 points by a team coach or a substitute player. In
the special case, such as takeout shot that hits more
opposite stones than advised by the skip, 5 points can
be given. These points are called “shot-score”, and
shot accuracy (SA) is calculated using shot-score ac-
cording to equation (1). SA has been one of the most
important measurements to estimate player’s skill and
condition.
SA = 25 ×
total of shot-scores
number of shots
(%) (1)
The team which has a higher SA is in general capa-
ble to throw more accurate shots. Therefore, it gives
advantage to the team in the game. The team which
has higher SA is more likely to succeed when per-
forming the shot in critical situations. And the team
which has lower SA would raise the probability for
scoring by opposite team.
In general, the team that plays as second has an
advantage in curling because they can perform the
last shot at an end. Accordingly, the strategies/tactics
taken by each team differ depending on whether their
playing position is Play first or Play second. In some
cases, the strategies/tactics taken by the opposite team
are advantageous. In other cases, it is necessary to
take the opposite stone out of the house to set advan-
tageous stone position, and put the stone in the house
to get a higher score.
The iCE application compiles SA databases from
the sets of shot scores, to analyze the scores from a
variety of viewpoints. To grasp the characteristics
and tendencies of each team, we analyzed in detail
information in iCE’s database containing shot scores.
The analysis result could lead to find the difference of
strategy between Play first team and Play second team
in an objective way.
We formulated a hypothesis that “the relation be-
tween SA and final game score (FGS) are different in
Play first and Play second”, and try to verify the hy-
pothesis in the following parts of the paper based on
the game information database.
4 GAME ANALYSIS
CONSIDERING PLAY FIRST
AND PLAY SECOND
To verify the hypothesis mentioned in Section 3, we
compared the relation between difference in SA and
difference in FGS (DFGS) for game information in
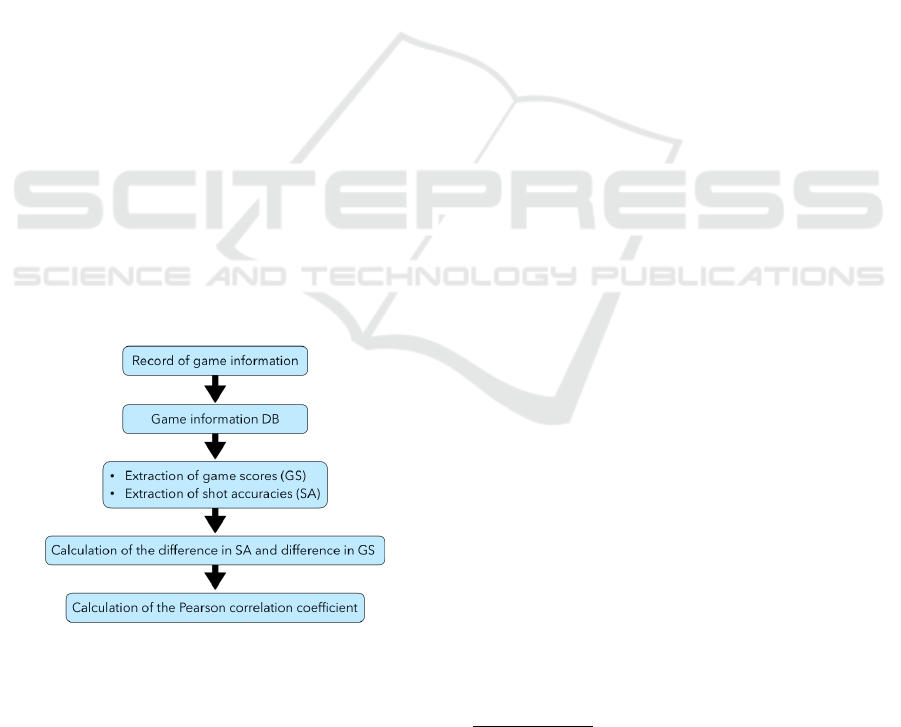
Play first and Play second. Figure 2 shows the analy-
sis procedure.
Figure 2: Analysis procedure.
Specifically, we extracted the DFGS and shot ac-
curacy for each collected game. We define the mean
value of SA regarding all ends as Total Shot Accuracy
(T SA), the mean value of SA regarding end for Play
first teams as Play first Shot Accuracy (1stSA) , the
mean value of SA regarding an end for Play second
teams as Play second Shot Accuracy (2ndSA).
Furthermore, we examined the correlation be-
tween DFGS and difference in SA
1
.
As the target data we used the game informa-
tion of 93 games (45 games for men, 48 games
for women) covering around 15,000 shots in Winter
Olympic Games 2014 as game data of world national
top level. We used the data of World Curling Federa-
tion as a reference
2
.
5 RESULT OF ANALYSIS
5.1 Comparison of 1stSA and 2ndSA
Here we describe the result of comparative analysis
of 1stSA and 2ndSA data. Firstly, we carried out the
Shapiro-Wilk test which is one of the tests of nor-
mality to confirm normalization for data aggregate of
DTSA, D1stSA, D2ndSA, DFGS in target data.
As a result, we confirmed that all data aggregate
follows a normal distribution. It means the data can
be considered as aggregate extracted at random.
Based on the above, we carried out the T-test
which is one of parametric methods directed at data
aggregate of D1stSA and D2ndSA to investigate if
the differences between the two data aggregates are
statistically significant.
We considered that D1stSA and D2ndSA are re-
lated data because these data were distinguished from
the same team’s SA. Therefore, we carried out the
paired T-test.
The results were confirmed two that the data ag-
gregates did not have statistical significance.
5.2 Relation between SA and GS
Here we describe the relation between SA and GS
separately for Play first and Play second cases. Figure
3 shows a diagram representing a correlation between
DTSA and DFGS and a regression line. In Figure 3,
the X axis shows DTSA for each game and the Y axis
represents the DFGS.
Pearson’s correlation coefficient between the two
differences for total data was 0.670. It means that the
two differences in Figure 3 have positive correlation.
Similarly, we investigated the correlation between
P1stSA and DFGS, P2ndSA and DFGS. Figure 4
shows a diagram representing a correlation between
1
Hereinafter, this is called Difference in Total Shot
Accuracy (DT SA), Difference in Play first Shot Accu-
racy (D1stSA), Difference in Play second Shot Accuracy
(D2ndSA).
2
https://www.olympic.org/sochi-2014/curling
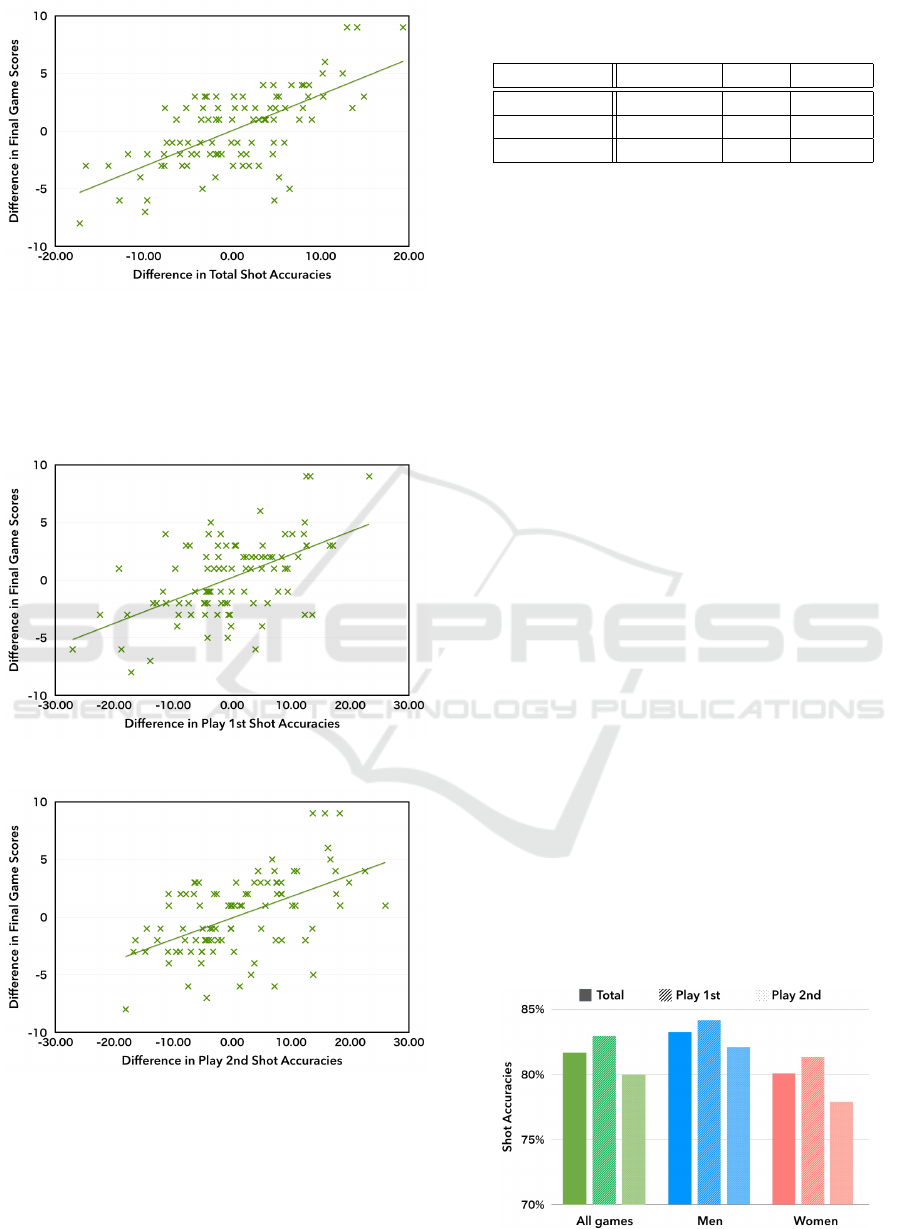
Figure 3: Correlation between DTSA vs. DFGS.
D1stSA and DFGS and regression line and Figure 5
stands for a correlation between D2ndSA and DFGS.
The correlation for Play first teams was 0.557 and for
Play second teams it was 0.530.
Figure 4: Correlation between D1stSA vs. DFGS.
Figure 5: Correlation between D2ndSA vs. DFGS.
Next, we analyzed the correlation for male and fe-
male players using a similar technique. Table 1 shows
the correlation between between each difference in
SA and DFGS separated by sex.
As shown in Table 1, there was a tendency that the
correlation between DTSA and DFGS was stronger
Table 1: Pearson’s correlation between each difference in
SA and DFGS separated by sex.
All games men women
Total 0.670 0.634 0.707
Play first 0.557 0.564 0.545
Play second 0.530 0.532 0.547
than when a team was in Play first and Play sec-
ond positions. Therefore, we carried out the test for
the hypothesis that several correlations are estimates
of the same correlation (Paul, 1989) to examine the
Pearson’s correlation between each difference in SA
and if DFGS were statistically significant.
As a result of the test, there were no significant
differences between the three correlations (DTSA and
DFGS, D1stSA and DFGS, and between D2ndSA and
DFGS).
Similar results were obtained from game informa-
tion for men and women, there were no significant
differences in all cases.
These results mean that the relation between
DTSA and DFGS, D1stSA and DFGS, D2ndSA and
DFGS were correlated to the same degree in 93 games
from the applied data and the same was true of 45
games for men and 48 games for women.
6 DISCUSSION
In this section, we describe the discussion on analy-
sis results. Primarily, there were no significant differ-
ences between correlations when teams were in Play
first and Play second positions. Therefore, it dis-
missed the previously proposed hypothesis that “the
relation between SA and GS are different in Play first
and Play second”. Below we present a detailed dis-
cussion to explain this situation.
We focused on SA in target data. Figure 6 shows
SA in analysis subject. In Figure 6, the X axis shows
SA and the Y axis represents the TSA, 1stSA, 2ndSA.
Figure 6: SA divided by sex and playing position.
As Figure 6 shows, there was a tendency that
1stSA were higher than 2ndSA through the whole
match. For men, the 1stSA was 84.26%, the 2ndSA
was 82.17% and difference between Play first and
Play second was 2.09 point. In the SA for women,
the 1stSA was 81.84%, the 2ndSA was 78% and dif-
ference between Play first and Play second was 3.84
point. These results mean there is a difference of per-
forming 1 or 2 shots per a game.
In addition, SA exceed 80% in all items, except
2ndSA for women. As a reason for 2ndSA for women
being lower than others, men players can better adjust
the rapidity and curl width of a stone by sweeping
3
than women. This indicates that men could be more
adjustable than women.
It suggests that there is a difference depending on
the starting position and it may be related to shot op-
tion and its degree of difficulty.
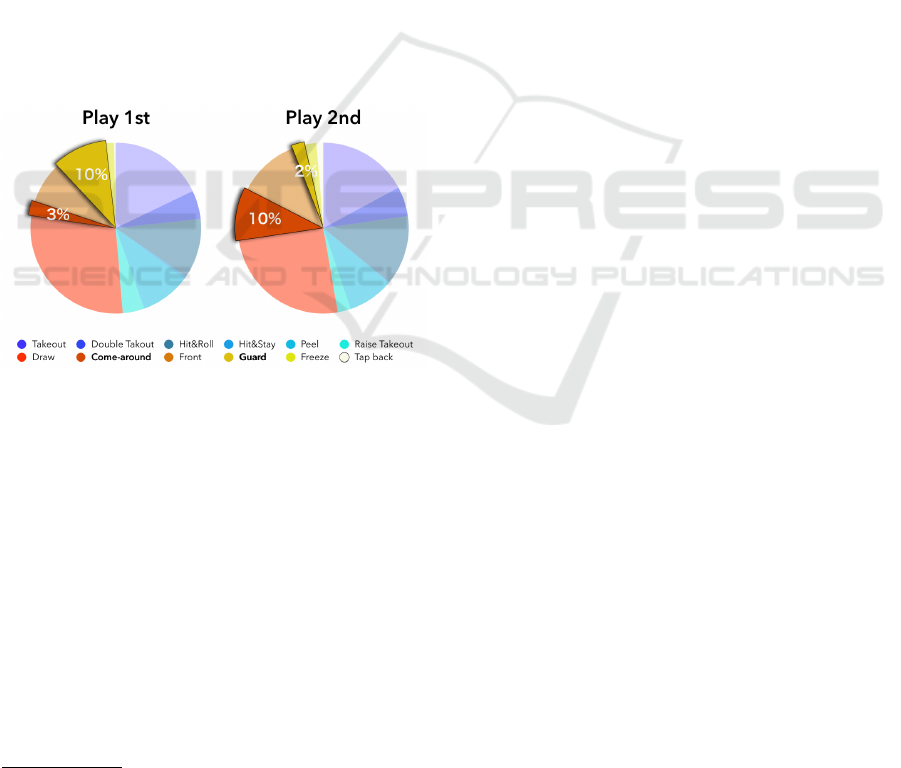
Next, we investigated the data by focusing on how
many of which types of shots were thrown. Figure 7
shows the Ratio of each types of shot in Play first and
Play second positions.
Figure 7: Ratio of shots by types in Play first and Play sec-
ond positions.
The ratios of each type of shot were different be-
tween Play first and Play second. In particular, the
ratio of Guard shot which is one o the draw shots for
Play first were performed more often than in Play sec-
ond. In the Guard shot the stone stops in the area out-
side the house to block opponent stones from entering
the house.
On the other hand, in Play second, the ratio of
the Come - around shot which goes around the guard
stone and stops in the house was higher than in Play
first.
It can be guessed that the shot requested and its de-
gree of difficulty differ depending on starting position
3
If a shot is weak or turns aside from the desired course,
other players sweep the ice surface ahead of the moving
stone to adjust the course.
because the player has to perform a shot considering
the state of one’s own team or the match situation.
This supports our hypothesis that the strate-
gies/tactics taken by each team differed in Play first
and Play second starting positions.
From the above, we can propose the following rea-
sons for the lack of significant differences between
the relation of shot accuracies and game scores when
teams were in Play first and Play second positions.
Firstly, game information for world national top level
has sufficiently high SA. Secondly, the SA was not
parametric which characterizes starting position (Play
first or Play second).
In the near future, it is necessary to compare the
analysis toward game information other than World
national top level. Additionally, it is necessary to ex-
tend the analysis on other effective parameters (e.g.
throwing number by type of shot) other than SA.
7 CONCLUSION
In this paper, we performed an analysis of game in-
formation by considering Play first and Play second
positions from a number of curling game matches.
We applied the test for the equality of several cor-
relation coefficients directed at each difference in shot
accuracies and game scores revealed that, there were
no significant differences in all cases.
The result confirmed that there were no significant
differences between shot accuracies and game scores
when teams were in Play first and Play second posi-
tions because players kept a high performance in ei-
ther case, and retained a stable shot accuracy through-
out all ends of the game.
Furthermore, we discussed why it was not possi-
ble to confirm a significant difference and indicated a
need for other influential parameters than shot accu-
racy.
In the near future, we plan to record game infor-
mation of world national top level and analyze it fo-
cusing on parameters other than shot accuracy (e.g.
throwing number by type of shot) in detail. In ad-
dition, we will aim to propose techniques for strate-
gies/tactics analysis considering strategic characteris-
tics.
ACKNOWLEDGEMENTS
This work was supported by JSPS KAKENHI (grant
number: 15H02797).

REFERENCES
Behm, D, G. (2009). Periodized training program of
the canadian olympic curling team. Journal of Na-
tional Strength and Conditioning Association JAPAN,
Vol.16, No.3, pp.40-47.
Bradley, L, J. (2009). The sports science of curling. A Prac-
tical Review, Journal of Sports Science and Medicine
vol.8, pp.495-500.
Coleman, G. (2014). Introduction to curling strategy (en-
glish edition). Amazon Services International.
Denny, M. (2002). Curling rock dynamics: Towards a real-
istic model. Canadian Journal of Physics, Vol.80, pp.
1005-1014.
Fujimura, A. and Sugihara, K. (2004). Quantitative eval-
uation of sport teamwork using generalized voronoi
diagrams. IEICE Transactions D J87-D2:818-828.
Howard, R. (2009). Curl to win: Expert advice to improve
your game. HarperCollins Publishers Ltd.
Igarashi, H., Ishihara, S., and Kimura, M. (2007). A study
of policy-gradient methods in non-markov decision
processes : Curling game application. IEICE Tech-
nical Report, NC2006-148, pp.179-184 (in Japanese).
Kagawa, M. (2006). Effect of multimedia information on
web pages in physical training class of university.
Journal of Japan Society for Educational Technology
29 37-40.
Maeno, N. (2014). Dynamics and curl ratio of a curling
stone. Sports Engineering Vol.17, pp. 33-41.
Masui, F., Hirata, K., Otani, H., Yanagi, H., and Ptaszynski,
M. (2016). Informatics to support tactics and strate-
gies in curling. Int J of Automation Technology10(2).
Otani, H., Masui, F., Hirata, K., Yanagi, H., and Ptaszyn-
ski, M. (2016). Analysis of curling team strategy and
tactics using curling informatics. 4th International
Congress on Sport Sciences Research and Technology
Support.
Paul, S, R. (1989). Test for the equality of several correla-
tion coefficients*. The Canadian Journal of Statistics,
Vol.17, No.2, pp.217-227.
Shegelski, M. (2000). The motion of a curling rock: Analyt-
ical approach. Canadian Journal of Physics, Vol.78,
pp. 857-864.
Sung, G, P. (2013). Curling analysis based on the possession
of the last stone per end. 6th Asia-Pacific Congress
on Sports Technology, Procedia Engineering, Vol.60,
pp.391-396.
Takahashi, S. (2011). Support the japan womens curling
national team by a trainer. Journal of Training Science
for Exercise and Sport 23(1):7-12 (in Japanese).
Tanaka, Y., Tsubota, H., Takeda, Y., and Tsuji, T.
(2006). Analysis of human hand movements using
a virtual curling system. Proceedings of Confer-
ence on Robotics and Mechatronics, 1A1-3F-E1 (in
Japanese).
Ura, M., Endo, S., Miyazaki, S., and Yasuda, T. (2008).
Curling game simulation and strategies evaluation.
Proceedings of the Virtual Reality Society of Japan,
Annual Conference, Vol.13, 2B3-5 (in Japanese).
Yanagi, H. and Miyakoshi, K. (2011). Training science on
college curling team. Journal of Training Science for
Exercise and Sport 23(1):13-19.
