
Using DataMining to Predict Diseases in Vineyards and Olive Groves
Luís Alves
1
, Rodrigo Rocha Silva
2,3
and Jorge Bernardino
1,3
1
ISEC, Polytechnic of Coimbra, Rua Pedro Nunes, Coimbra, Portugal
2
FATEC Mogi das Cruzes, São Paulo State Technological College, Brazil
3
CISUC – Centre for Informatics and Systems of the University of Coimbra, Coimbra, Portugal
Keywords: Classification, Data Mining, Weka, Random Forest, IBk, NaiveBayes, SMO.
Abstract: Currently, the advancements in computer technology allows progress of the agricultural sector. Producers
and service providers are exploring the value of information and its importance in increasing the
productivity and profitability of a farm. This paper intends to evaluate various classification algorithms of
data mining to predict various diseases in vineyards and olive groves. We propose using machine learning to
predict diseases based on symptoms and weather data. The accuracy of classification algorithms like
Random Forest, IBK, Naïve Bayes and SMO have been compared using Weka Software. Using our
proposal, it is expected to reduce the incidence of diseases by more than 75%.
1 INTRODUCTION
Nowadays, the quantity of digital information
related to agricultural sector is dispersed in many
applications. Grapevine downy mildew (Plasmopara
Viticola) and powdery mildew (Uncinula necator)
are two of the most important diseases that infect
Vineyards worldwide. Olive peacock spot
(Spilocaea oleaginear) and olive anthracnose
(Gloeosporium Olivarum) are two of the most
important diseases that infect Olive Groves
worldwide. These diseases cause large losses in
production that result in very small profits and large
economic losses. Given the economic importance of
these diseases, the occurrence of these can be
prevented and reduced through the correct use of
digital information.
This paper presents a new proposal for predicting
future risk of Grapevine downy mildew
(Plasmopara Viticola) and olive anthracnose
(Gloeosporium Olivarum) diseases occurring on the
basis of climatic, environmental and another
favourable variables (Gessler, Pertot and Perazzolli,
2011) (Cacciola et al., 2012). The meteorological
data used are temperature, humidity and
precipitation. This data will be collected from the
Dark Sky API (Dark Sky API, 2017). The remaining
data correspond to the symptoms of the disease that
will be entered by the user.
We propose test different data mining classifying
algorithms to predict diseases based on symptoms
and weather data for plan a systems architecture.
Currently, many open-source data mining tools
and software are available for use. These tools and
software provide a set of methods and algorithms
that help doing a better analysis of data. These tools
help in cluster analysis, data visualization, decision
trees, and predictive analytics. In this work, we
choose the open source data mining tool Weka.
WEKA is a machine learning workbench that
supports many activities of machine learning
practitioners. WEKA contains implementations of
algorithms for classification, clustering, and
association rule mining, along with graphical user
interfaces and visualization utilities for data
exploration and algorithm evaluation. We have
conducted a comparison study between algorithms
provided by Weka, corresponding to different
classification categories.
The main contribution of this paper is a new
approach for predicting some transmissible diseases
in vines and olive groves that will assist the producer
and help reduce unnecessary costs (e.g. in fungicide
applications).
The remainder of this paper is organized as
follows. Section 2 describes related work. Section 3
describes the experimental tests to predict diseases.
Section 4 discuss the results. Finally, Section 5
concludes the paper and presents future work.
Alves L., Silva R. and Bernardino J.
Using DataMining to Predict Diseases in Vineyards and Olive Groves.
DOI: 10.5220/0006519002820287
In Proceedings of the 9th International Joint Conference on Knowledge Discovery, Knowledge Engineering and Knowledge Management (KEOD 2017), pages 282-287
ISBN: 978-989-758-272-1
Copyright
c
2017 by SCITEPRESS – Science and Technology Publications, Lda. All rights reserved

2 RELATED WORK
The use of data mining classifying algorithms has
been utilized by many authors to assess and analyse
the risk factors statistically related to diseases in
order to compare the performance of the
implemented classifiers.
Yethiraj (2012) studies a application of data
mining techniques in the field of agriculture.
Yethiraj concludes that there is a growing number of
applications of data mining techniques in agriculture
and a growing amount of data that are currently
available from many resources.
Ramesh and Vardhan (2013) use data mining
techniques and applications in agricultural field to
predicting yield production based on available data.
Ganesh, Cindrella and Christy (2015) gives a
survey of some data mining techniques and the
techniques used in agricultural field. Their study
concludes that the agricultural mining technique
become highly active research area in data mining
research and that the data mining techniques are
used in agricultural field to increase the income of
the farmer, reduce the transport cost and to predict
the climate change using previously stored dataset.
Gandhi and Vishwavidyalaya (2011) explores
the application of data mining techniques in the field
of agriculture and allied sciences. They concludes
that the multidisciplinary approach of integrating
computer science with agriculture will help in
forecasting/managing agricultural crops effectively.
Raorane and Kulkarni (2012) aimed to assess the
data mining techniques used to extract knowledge
from a most of data and apply them to the various
variables consisting in the database to establish if
meaningful relationships can be found. They
concludes that efficient technique can be developed
and analyzed using the appropriare dara to solve
complex agricultural problems using data mining
techniques.
Naik and Samant (2016) used Liver Patient
DataSet for testing the Classification algorithm in
order to classify the people with and without Liver
dissorder.
The main difference of these works with our is
that we test different data mining classifying
algorithms to predict Grapevine downy mildew
(Plasmopara Viticola) and olive anthracnose
(Gloeosporium Olivarum) diseases occurring on the
basis of climatic, environmental and other
favourable variables.
3 EXPERIMENTAL
EVALUATION
In the experimental evaluation, we intend to find the
best classification result in order to validate
prediction diseases for only two diseases. We choose
Grapevine downy mildew (Plasmopara Viticola)
and olive anthracnose (Gloeosporium Olivarum)
diseases to make the experimental evaluation
because we consider that they are the two most
important diseases that infect Vineyards and Olive
Groves worldwide based on opinion of farmers.
The dataset is given in the ARFF (Attribute
Relation File Format) format which is compatible
with WEKA (Manzoor et al., 2015).
In order to perform these experiments, we create
two datasets (DataSets, 2017) :
DataSet 1: This dataset is a generated dataset
with 4200 instances and correspond to
Plasmopara Viticola disease. This dataset
contains 1900 instances with probability of
disease and 2300 without.
DataSet 2 : This dataset is a generated dataset
with 2800 instances and correspond to
Gloeosporium Olivarum. This dataset
contains 330 instances with probability of
disease and 2470 without.
Each of these datasets has attributes that
correspond to the most important symptoms and
weather data favourable to development of diseases.
The DataSet 1 has the following attributes:
tmp: This matches the temperature. The
temperature is important for the development
of this disease when it has values higher than
11ºC.
hmdt: This matches the humidity. The humidity
is important for the development of this
disease when it has values higher than 92%.
rn: This matches the precipitation. The
precipitation is important for the development
of this disease because the fungus requires
free water in the tissues for a minimum of 2
hours for infection.
TPS: This matches top page of the leaf with
spot. This attribute is one of the main
symptoms of this disease.
CP: This matches curving peduncle symptom.
WSS: This matches white spots on the lower
page of the sheet symptom.
SB: This matches stains on the branches
symptom.
diss: This matches possibility of the disease
occurring based on the previous attributes.
The DataSet 2
has the following attributes:

tmp: This matches the temperature. The
temperature is important for the development
of this disease when it has values between
20ºC and 25ºC.
hmdt: This matches the humidity. The humidity
is important for the development of this
disease when it has values higher than 92%.
rn: This matches the precipitation. The
precipitation is responsible for the spread of
the disease.
RSF: This matches rounded spots on fruits.
This is one of the main symptoms of this
disease.
WF: This matches wrinkled fruits symptom.
diss: This matches possibility of the disease
occurring based on the previous attributes.
The 10-fold cross validation test mode was used,
which means that 90% of the data is used for
training and 10% for testing in each fold test.
3.1 Evaluation of Classification
Algorithm using Weka
In this paper, we choose Weka because is very
sophisticated tool and used in many different
applications including visualization and algorithms
for data analysis and predictive modelling.
We have conducted a comparison study between
algorithms provided by Weka, corresponding to
different classification categories: Decision trees,
was chosen the Random Forest, for the lazy
classifiers, the K – Nearest Neighbors was chosen,
whose implementation in Weka is named IBk, for
the bayes classifiers, the Naïve Bayes was chosen
and, for function classifiers, Sequential Minimal
Optimization (SMO) was chosen.
We evaluate the performance of the classification
algorithm using Confusion Matrix. Confusion
Matrix can be represented by a table, that
summarizes the classification performance of a
classifier with respect to some test data (Shultz and
Fahlman, 2017). The confusion matrix is:
True positives (TP): In this case we predicted
“disease” and do have the disease.
True negatives (TN): In this case we no
predicted the disease and not have the disease.
False positives (FP): In this case we predicted
disease but don’t actually have the disease.
False negatives (FN): In this case we predicted
no disease but actually do have the disease.
We calculate value of precision and recall.
Precision is the number of True Positives divided by
the number of True Positives and False Positives.
Basically, it is the number of positive predictions
divided by the total number of positive class values
predicted. Recall is the number of True Positives
divided by the number of True Positives and the
number of False Negatives. Basically, it is the
number of positive predictions divided by the
number of positive class values in the test data.
The computation of precision and recall values is
as follows:
precision = TP / (TP + FP) (1)
recall = TP / (TP + FN) (2)
There are two possible predicted classes:
“disease” and “no disease”. In first dataset the
classifier made a total of 4200 predictions. In second
dataset the classifier has a total of 2800 predictions.
3.1.1 Random Forest
When applying the Random Forest algorithm to
DataSet 1, in these 4200 cases, the classifier
predicted “disease” 1900 times, and “no disease”
2300 times. In reality, 1900 instances in the sample
have the disease and 2300 do not. So, precision=1
and recall=1 for “disease”. Which means that for
precision, when “disease” was predicted, 100% of
the time the system was in fact correct. For recall it
means that when “disease” have been predicted,
100% of cases were correctly predicted.
For “no disease”, precision=1 and recall=1 which
means that for precision, out of the times “no
disease” was predicted, 100% of the time the system
was in fact correct. For recall it means that out of all
times “no disease” should have been predicted,
100% of cases were correctly predicted.
The results of application Random Forest algorithm
to DataSet 1 are shown in Table 1.
Table 1: Confusion Matrix of application Random Forest
algorithm to Plasmopara viticola.
True 1
(disease)
True 2
(no disease)
Class
Precision
Pred. 1
(disease)
1900 0 100%
Pred. 2
(no disease)
0 2300 100%
Recall 100% 100%
When applying the Random Forest algorithm to
DataSet 2, in these 2800 cases, the classifier
predicted “disease” 330 times, and “no disease”
2470 times. In reality, 329 instances in the sample
have the disease and 2471 do not. So,
precision=0.991 and recall=0.994 for “disease”.
Which means that for precision, out of the times
“disease” was predicted, 99.1% of the time the

system was in fact correct. For recall it means that
out of all times “disease” should have been
predicted, 99.4% of cases were correctly predicted.
For “no disease”, precision=0.999 and
recall=0.999 which means that for precision, when
“no disease” was predicted, 99.9% of the time the
system was in fact correct. For recall it means that
out of all times “no disease” should have been
predicted, 99.9% of cases were correctly predicted.
The results of application Random Forest
algorithm to DataSet 2 are shown in Table 2.
Table 2: Confusion Matrix of application Random Forest
algorithm to Gloeosporium olivarum.
True 1
(disease)
True 2
(no disease)
Class
Precision
Pred. 1
(disease)
327 3 99.1%
Pred. 2
(no disease)
2 2468 99.9%
Recall 99.4% 99.9%
3.1.2 Naïve Bayes
When applying the Naïve Bayes algorithm to
DataSet 1, in these 4200 cases, the classifier
predicted “disease” 1900 times, and “no disease”
2300 times. In reality, 2100 instances in the sample
have the disease and 2100 do not. So, precision=1
and recall=0.905 for “disease”. Which means that
for precision, out of the times “disease” was
predicted, 100% of the time the system was in fact
correct. For recall it means that out of all times
“disease” should have been predicted, 90.5% of
cases were correctly predicted.
For “no disease”, precision=0.913 and recall=1
which means that for precision, out of the times “no
disease” was predicted, 91.3% of the time the
system was in fact correct. For recall it means that
out of all times “no disease” should have been
predicted, 100% of cases were correctly predicted.
The results of application Naïve Bayes algorithm
to DataSet 1 are shown in Table 3.
Table 3: Confusion Matrix of application Naïve Bayes
algorithm to Plasmopara viticola.
True 1
(disease)
True 2
(no disease)
Class
Precision
Pred. 1
(disease)
1900 0 100%
Pred. 2
(no disease)
200 2100 91.3%
Recall 90.5% 100%
When applying the Naïve Bayes algorithm to
DataSet 2, in these 2800 cases, the classifier
predicted “disease” 330 times, and “no disease”
2470 times. In reality, 350 instances in the sample
have the disease and 2450 do not. So, precision=1
and recall=0.942 for “disease”. Which means that
for precision, out of the times “disease” was
predicted, 100% of the time the system was in fact
correct. For recall it means that out of all times
“disease” should have been predicted, 94.2% of
cases were correctly predicted.
For “no disease”, precision=0.992 and recall=1
which means that for precision, out of the times “no
disease” was predicted, 99.2% of the time the
system was in fact correct. For recall it means that
out of all times “no disease” should have been
predicted, 100% of cases were correctly predicted.
The results of application Naïve Bayes algorithm
to DataSet 2 are shown in Table 4.
Table 4: Confusion Matrix of application Naïve Bayes
algorithm to Gloeosporium olivarum.
True 1
(disease)
True 2
(no disease)
Class
Precision
Pred. 1
(disease)
330 0 100%
Pred. 2
(no disease)
20 2450 99.2%
Recall 94.2% 100%
3.1.3 IBk
When applying the IBk algorithm to DataSet 1, in
these 4200 cases, the classifier predicted “disease”
1900 times, and “no disease” 2300 times. In reality,
600 instances in the sample have the disease and
3600 do not. So, precision=0.998 and recall=0.999
for “disease”. Which means that for precision, out of
the times “disease” was predicted, 99.8% of the time
the system was in fact correct. For recall it means
that out of all times “disease” should have been
predicted, 99.9% of cases were correctly predicted.
For “no disease”, precision=0.999 and
recall=0.998 which means that for precision, out of
the times “no disease” was predicted, 99.9% of the
time the system was in fact correct. For recall it
means that out of all times “no disease” should have
been predicted, 99.8% of cases were correctly
predicted.
The results of application IBK algorithm to
DataSet 1 are shown in Table 5. When applying the
IBk algorithm to DataSet 2, in these 2800 cases, the
classifier predicted “disease” 330 times, and “no
disease” 2470 times. In reality, 0 instances in the
sample have the disease and 2800 do not. So,
precision=0 and recall=0 for “disease”. Which
means that for precision, out of the times “disease”

was predicted, 0% of the time the system was in fact
correct. For recall it means that out of all times
“disease” should have been predicted, 0% of cases
were correctly predicted.
Table 5: Confusion Matrix of application IBk algorithm to
Plasmopara viticola.
True 1
(disease)
True 2
(no disease)
Class
Precision
Pred. 1
(disease)
1896 4 99.8%
Pred. 2
(no disease)
2 2298 99.9%
Recall 99.9% 99.8%
For “no disease”, precision=1 and recall=0.882
which means that for precision, out of the times “no
disease” was predicted, 100% of the time the system
was in fact correct. For recall it means that out of all
times “no disease” should have been predicted,
88.2% of cases were correctly predicted.
The results of application IBK algorithm to
DataSet 2 are shown in Table 6.
Table 6: Confusion Matrix of application IBk algorithm to
Gloeosporium olivarum.
True 1
(disease)
True 2
(no disease)
Class
Precision
Pred. 1
(disease)
0 330 0%
Pred. 2
(no disease)
0 2470 100%
Recall 0% 88.2%
3.1.4 SMO
When applying the SMO algorithm to DataSet 1, in
these 4200 cases, the classifier predicted “disease”
1900 times, and “no disease” 2300 times. In reality,
600 instances in the sample have the disease and
3600 do not. So, precision=1 and recall=1 for
“disease”. Which means that for precision, out of the
times “disease” was predicted, 100% of the time the
system was in fact correct. For recall it means that
out of all times “disease” should have been
predicted, 100% of cases were correctly predicted.
For “no disease”, precision=1 and recall=1 which
means that for precision, out of the times “no
disease” was predicted, 100% of the time the system
was in fact correct. For recall it means that out of all
times “no disease” should have been predicted,
100% of cases were correctly predicted.
The results of application SMO algorithm to
DataSet 1 are shown in Table 5. When applying the
SMO algorithm to DataSet 2, in these 2800 cases,
the classifier predicted “disease” 330 times, and “no
disease” 2470 times. In reality, 0 instances in the
sample have the disease and 2800 do not. So,
precision=0 and recall=0 for “disease”. Which
means that for precision, out of the times “disease”
was predicted, 0% of the time the system was in fact
correct. For recall it means that out of all times
“disease” should have been predicted, 0% of cases
were correctly predicted.
Table 7: Confusion Matrix of application SMO algorithm
to Plasmopara viticola.
True 1
(disease)
True 2
(no disease)
Class
Precision
Pred. 1
(disease)
1900 0 100%
Pred. 2
(no disease)
0 2300 100%
Recall 100% 100%
For “no disease”, precision=1 and recall=0.882
which means that for precision, out of the times “no
disease” was predicted, 100% of the time the system
was in fact correct. For recall it means that out of all
times “no disease” should have been predicted,
88.2% of cases were correctly predicted.
The results of application SMO algorithm to
DataSet 2 are shown in Table 6.
Table 8: Confusion Matrix of application SMO algorithm
to Gloeosporium olivarum.
True 1
(disease)
True 2
(no disease)
Class
Precision
Pred. 1
(disease)
315 15 95.5%
Pred. 2
(no disease)
0 2470 100%
Recall 100% 99.4%
4 DISCUSSIONS OF RESULTS
In this paper, we used Grapevine downy mildew
(Plasmopara Viticola) and olive Anthracnose
(Gloeosporium Olivarum) DataSet. The first has
4200 samples with 7 independent variables and one
class variable. The second has 2800 samples with 5
independent variables and one class variable.
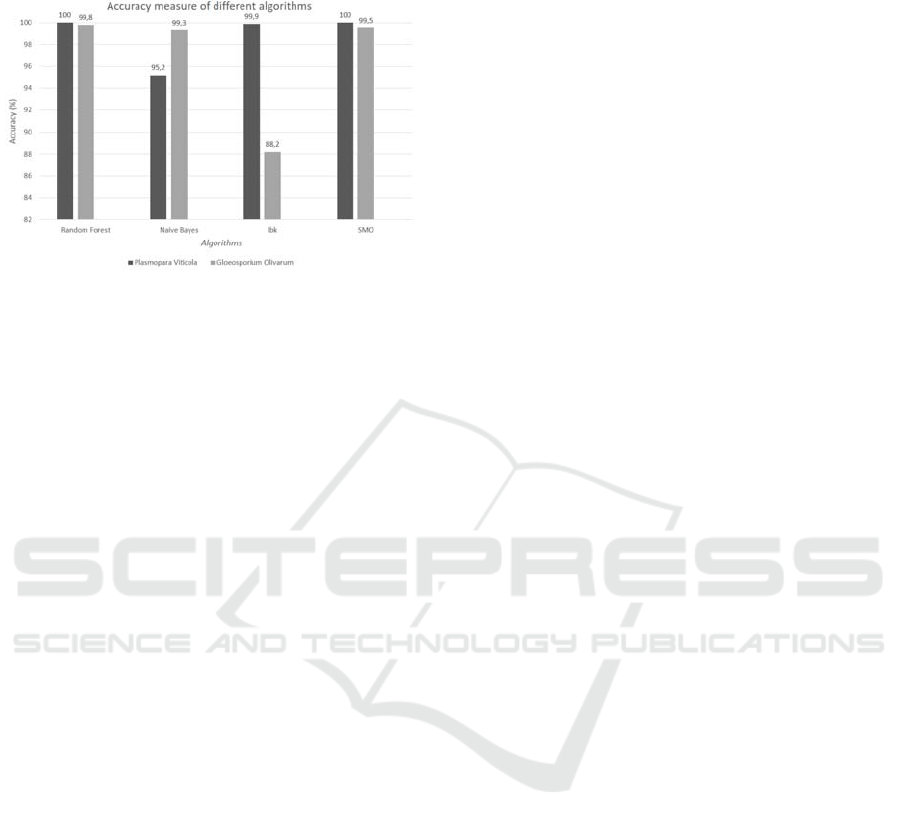
The performance of this classification algorithms
on the basis of Accuracy was compared in Table 7
and Figure 2. Calculation of Accuracy value:
Accuracy = (TP+TN) / (TP+FP+TN+FN) (1)
The accuracy approximates how effective the
algorithm is by showing the probability of the true
value of the class label. Basically, assesses the
overall algorithm. More the accuracy better are the
results.
Figure 1: Accuracy measure of different algorithms.
Random Forest algorithm and SMO algorithm
perform better than IBk and Naïve Bayes algorithm
because precision and recall values are better.
Concluding it is clear that Weka estimates a
lowest accuracy for IBK and Naïve Bayes and better
to Random Forest and SMO.
5 CONCLUSIONS AND FUTURE
WORK
Applying data mining in the agriculture field is an
incredibly challenging mission due to the way of
thinking on agriculture profession. It characterizes
widespread process that demands thorough
understanding of needs of the agriculture
organizations. Knowledge gained with the use of
techniques of data mining can be used to make
successful decisions that will improve success of
agriculture sector.
We evaluate and investigate four selected
classification algorithms using Weka software. The
best algorithm using in the tests with DataSet 1 is
Random Forest with an accuracy of 100%. The best
algorithm using in the tests with DataSet 2 is also
Random Forest. These results suggest that among
the machine learning algorithm tested, Random
Forest classifier has the best results.
As future work, we propose an architecture using
machine learning to provide more accurate
information according to the user interest. This
architecture can be supported by information
systems and mobile devices for help the farmer in
cultivation fields. We have planned to conduct
experiments on large real time agriculture
productions datasets to predict the diseases. Real
data from Vineyards, Olive Groves and other
cultures needs to be collected and tested in more
data mining tools and classification algorithms to
compare the accuracy of the classification
algorithms using different software.
REFERENCES
Cacciola, S. O. et al. (2012) ‘Olive anthracnose’, Journal
of Plant Pathology, 94(1), pp. 29–44.
DataSet, 2017, Plasmopara Viticola and Gloeosporium
Olivarum, DataSets available from:
https://www.dropbox.com/sh/rvh7ljfsq3r6zs9/AAAF_
DVBAAJT_fnhjoL7PG4Fa?dl=0.
Gandhi, M. and Vishwavidyalaya, G. (2011) ‘Data mining
Techniques for Predicting Crop Productivity – A
review article’, 4333, pp. 98–100.
Ganesh, S. H., Cindrella, B. D. P. and Christy, C. A. J.
(2015) ‘a Review on Classification Techniques Over
Agricultural Data’, Journal of Computer Science and
Information Technology, 4(5), pp. 491–495.
Gessler, C., Pertot, I. and Perazzolli, M. (2011)
‘Plasmopara viticola: A review of knowledge on
downy mildew of grapevine and effective disease
management’, Phytopathologia Mediterranea, 50(1),
pp. 3–44. doi: 10.14601/Phytopathol_Mediterr-9360.
Manzoor, U. et al. (2015) ‘Ontology-Based Clinical
Decision Support System for Predicting High-Risk
Pregnant Woman’, Int. Journal of Advanced Computer
Science and Applications (IJACSA), 6(12), pp. 203–
208.
Naik, A. and Samant, L. (2016) ‘Correlation Review of
Classification Algorithm Using Data Mining Tool:
WEKA, Rapidminer, Tanagra, Orange and Knime’,
Procedia Computer Science., pp. 662–668.
Ramesh, D. and Vardhan, B. V. (2013) ‘Data Mining
Techniques and Applications to Agricultural Yield
Data’, International Journal of Advanced Research in
Computer and Communication Engineering, 2(9), pp.
3477–3480.
Raorane, A. A. and Kulkarni, R. V (2012) ‘Data Mining :
An effective tool for yield estimation in the
agricultural sector’, IJETTCS, 1(2).
Shultz, T. R. and Fahlman, S. E. (2017) Encyclopedia of
Machine Learning and Data Mining. Springer US.
TheDarkSkyCompany, LLC, 2012, Dark Sky API,
available from: https://darksky.net/dev/ , 2017.
Yethiraj, N. G. (2012) ‘Applying Data Mining Techniques
in the field of Agriculture and Allied Sciences’, Int. J.
of Business Intelligents, 1(2), pp. 72–76.
