Social Environments Modeling From Kinect Data in Robotics
Applications
Catarina Lima and Jo
˜
ao Silva Sequeira
Instituto Superior T
´
ecnico / Institute for Systems and Robotics, University of Lisbon, Lisbon, Portugal
Keywords:
Social Robots, Human-Robot Interaction, Environment Modeling, Kinect, Robot Behavior.
Abstract:
This paper addresses the modeling of social environments from range information obtained from a Kinect
sensor. The modeling is restricted to events representing the existence of movement in front of the sensor. A
deterministic model based on a power law and probabilistic models based in Weibull and Lognormal distri-
butions are considered. Real experiments in a hospital ward are presented together with a discussion on the
relevance of these models to improve the acceptance of social robots in non lab social environments.
1 INTRODUCTION
The importance of social interactions involving hu-
mans and robots is on the rise. Researchers want
to build not only functional robots but also social-
functional robots which can help and interact with
humans. Designing behaviors for social robots is
a task that integrates knowledge form multiple sci-
entific areas where knowledge about environment is
paramount. This paper presents preliminary ideas on
the modeling of social environment that are suitable
to control purposes.
Social-intelligent robots should have four compo-
nents: “act in ... complicated domains; communicate
with humans using a language-like modality; reason
about its actions at some level so that it has something
to discuss, and, learn and adapt ... on the basis of hu-
man feedback”, (Lopes and Connell, 2001).
The first component is already implemented on
the MOnarCH robot in the sense that it is able to co-
exist with people at a hospital ward and perform some
tasks such as move around and occasionally say some
sentences. The second and third components require
perception for which this work provides a basic com-
ponent. The goal is to build a motion awareness sys-
tem for the robot providing spatial perception of the
immediate surroundings and improving the level of
interaction with people in the ward.
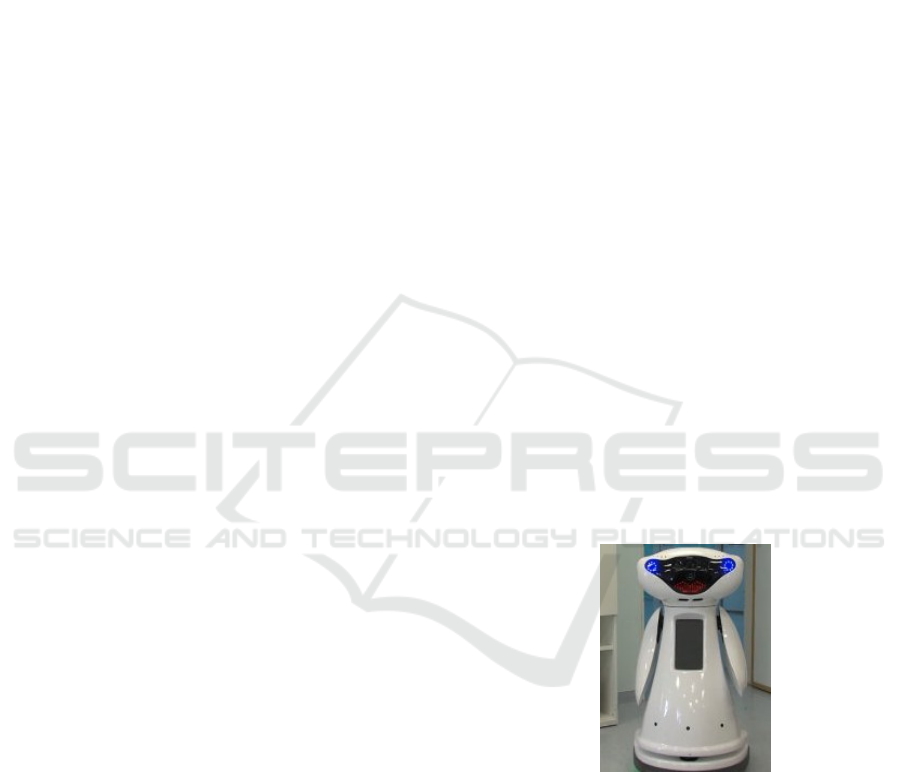
Figure 1 shows the MOnarCH robot used in this
work. It was built to integrate social environments,
namely the Pediatrics ward of a hospital. The robot
interacts with children (the inpatients), and adults (the
relatives and staff). As recognized, for instance, in
(Holzinger et al., 2008) non-lab environments pose
hard challenges in what concerns the acceptance of
social robots due to the, usually high, number of fac-
tors involved. This means that perception informa-
tion, namely from the neighbourhood of the robot is
paramount. A Kinect sensor mounted on the head is
used to provide range information from which mod-
els of the dynamics of the environment are created.
Its actions will depend on these dynamics.
Figure 1: The MOnarCH robot.
The paper is divided as follows. Section 3 de-
scribes the motion awareness system and section 4
tests some aspects of the Kinect performance. An
overview of the robot behavior implemented is ex-
plained in section 4.3. Conclusions and future work
are discussed in section 5.
2 RELATED WORK
Sensors as Microsoft Kinect and Asus Xtion have
been tested in robots to extract RGB-D images and
Lima C. and Silva Sequeira J.
Social Environments Modeling From Kinect Data in Robotics Applications.
DOI: 10.5220/0006525901900197
In Proceedings of the International Conference on Computer-Human Interaction Research and Applications (CHIRA 2017), pages 190-197
ISBN: 978-989-758-267-7
Copyright
c
2017 by SCITEPRESS – Science and Technology Publications, Lda. All rights reserved
build 3D point-cloud representations of the environ-
ments, (Oliver et al., 2012). Both sensors proved to
be suitable for mobile robotic navigation despite some
limitations: narrowed field of view, small ranges,
and measurements accuracy, (Eriksson and Ragner-
ius, 2012).
The Kinect has been shown to be useful in differ-
ent areas such as robotics, performing arts, education,
retail services and security, (Lun and Zhao, 2015),
in 3D reconstructions of environments, (Zhang et al.,
2015), and objects, (Varanasi and Devu, 2016), hu-
man movement recognition, (Cippitelli et al., 2016;
Luo et al., 2014), and navigation with emphasis on
obstacle avoidance, (Correa et al., 2012). A model
based approach to detect humans using a 2D head
contour model and a 3D head surface model is de-
scribed in (Xia et al., 2011). An algorithm for pedes-
trian contours detection, by merging RGB and Depth
images from a Kinect, was developed in (Chen et al.,
2016). A method for tracking individuals is also pro-
posed in (Yang et al., 2016), consisting of a subtrac-
tion method for background frames of depth images.
The goal was to detect people who are on the verge
of falling. An algorithm for human action recogni-
tion exploiting the skeleton provided by a Kinect is
described in (Cippitelli et al., 2016).
Social robots are autonomous machines designed
to interact with humans and show social behaviors
(KPMG, 2016). When creating those behaviors, peo-
ple will tend to project their thoughts and behaviors
on robots (Duffy, 2003), and try to make them be-
have as humans. A relevant question is: how can re-
searchers create models that give robots social skills
to change people’s perception towards the robots? A
few tried to find solutions to this question. What peo-
ple think about the robot’s movement as it follows
behind a person has been studied in (Gockley et al.,
2007). Two approaches are implemented (direction-
following and path-following). Results showed that
the first is more similar to how humans behave. A
robot that stands in line with humans is studied in
(Nakauchi and Simmons, 2000), on the assumption
that for a robot to be social it should recognize and
react to people’s social actions.
3 MOTION AWARENESS
Individuals adjust their movements in response to
their neighbors’ movements and positions, (Herbert-
Read, 2016). This is called Herd Behavior and is char-
acteristic of both animals and humans, e.g., flocking
birds, dolphins, and nest building ants. Stock market
bubbles, crowds and everyday decision-making ex-
emplifies how this concept is present in humans so-
cieties and has been studied by philosophers such as
S. Kierkegaard and F. Nietzsche. Wilfred Trotter pop-
ularized the topic applied to humans, (Trotter, 1916).
Human behavior, namely in social groups, is influ-
enced by each others actions, (Musse and Thalmann,
1997).
These biological features inspired the modeling
of social environments from specific events. Proper
identification of the dynamics of a social environment
is an enabler for strategies of adjustment of behaviors
to the environment and hence maximize acceptance.
The Kinect sensor provides RGB-D images at 30
Hz frame rate and 640 x 480 pixels resolution, suit-
able for indoors robotics applications. The depth
component is used to detect motion as it is more ef-
ficient in the subtraction process between two depth
images (Greff et al., 2012) considered (see ahead).
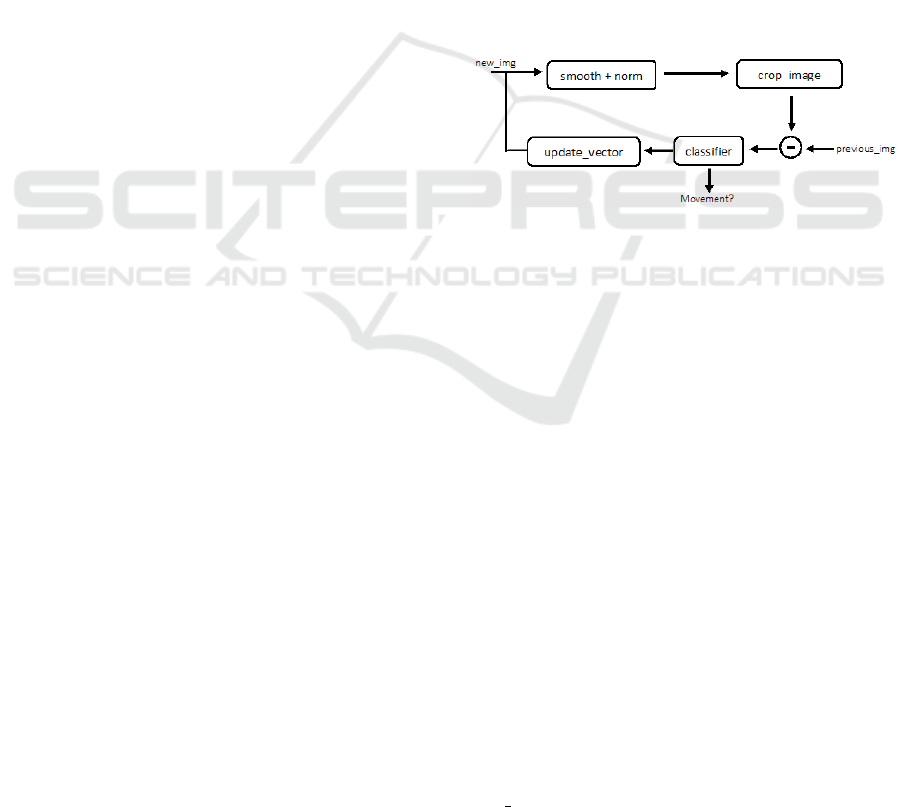
Figure 2 shows the architecture of the motion
awareness classifier developed.
Figure 2: Motion Awareness System.
The system starts by normalizing and smoothing
each new image acquired by the Kinect. Normaliza-
tion is done to fill in the pixels for which it was not
possible for the Kinect to return any value, e.g., as
when facing metallic areas. The smoothing process
was done using the openCV function medianBlur(),
with an linear aperture size of 5.
The images acquired from the Kinect are subject
to noise caused by inadequate calibration, lighting
conditions, and imaging geometry, and properties of
the object surface, (Khoshelham and Elberink, 2012).
This noise can be estimated under benign conditions,
i.e., if the sensor is static and the environment con-
ditions are constant, from the difference between the
depth images obtained in close time intervals. Each
depth image is mathematically represented as a ma-
trix. The amount of noise can be estimated from the
mean of all the depth values in the difference matrix.
In lab conditions an average of 0.1 (normalized units)
was found, which is the baseline value for non-lab tri-
als. A noise free sensor would yield a zero image.
To reduce the computational cost only the bot-
tom part of the image provided by the Kinect is used
(cut image function). Essentially, the goal is to de-
termine if there are people passing by in the neigh-

borhood of the robot. As a person moves away from
the sensor the downside part of the images still con-
tains motion relevant information whereas the upper
part may not contain any useful information (eventu-
ally related with the ceiling, in indoor environments).
At the end of the process the new image has a resolu-
tion size of 640 x 380 pixels, smaller than the original
resolution.
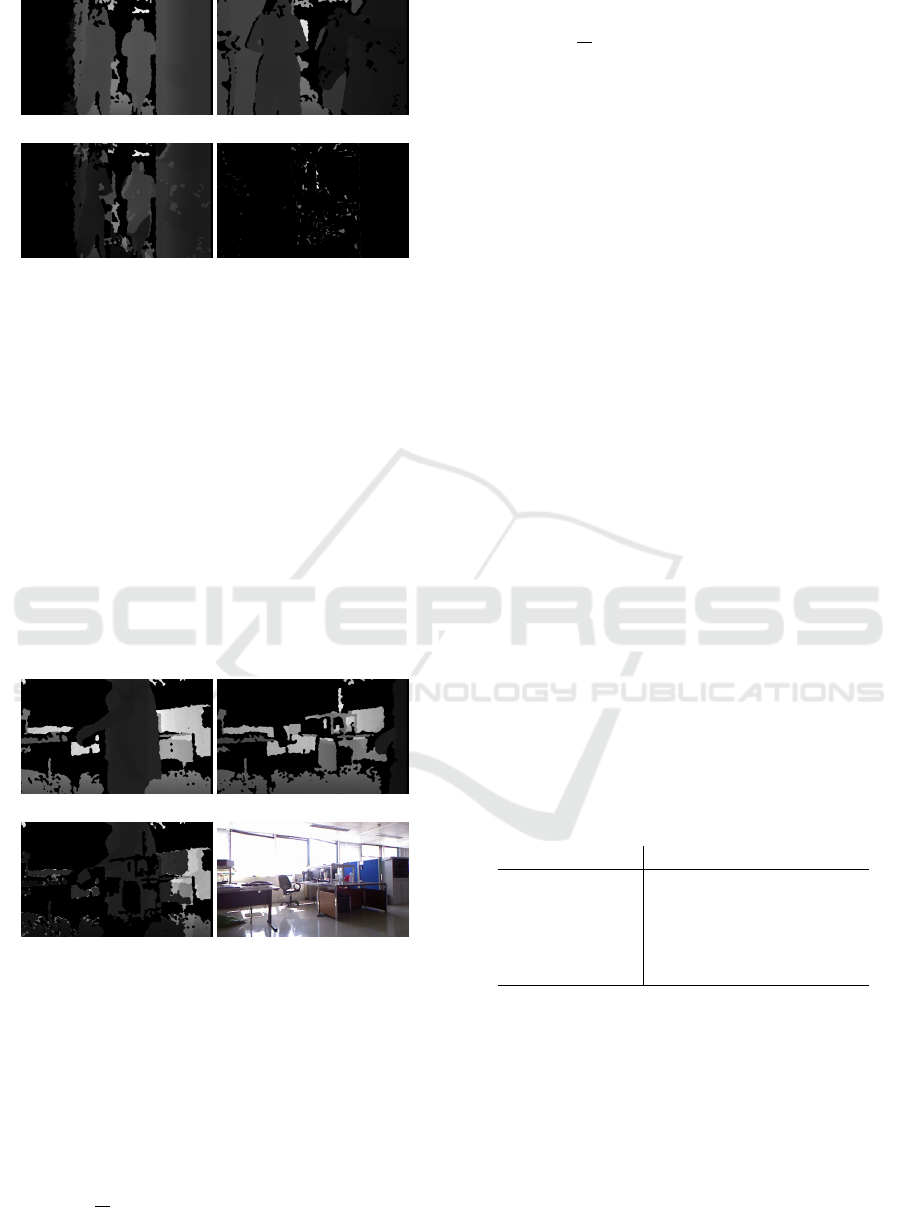
Figure 3) shows an example. In the top image
no one is present. In the middle image someone is
moving in front of the Kinect. The subtraction of the
two images is shown at the bottom with the black
regions representing unchanged areas (not affected
by the movement) and the gray areas representing
changes due to motion that occurred in the environ-
ment.
(a) I
k−1
(b) I
k
(c) I
k
− I
k−1
Figure 3: Example of depth images taken in the lab.
To classify the data obtained from the Kinect the
estimates on the level of changes are compared with
short term information (see Algorithm 1).
Algorithm 1: Classifier algorithm.
N = 5 {Short term memory window size}
k
1
= 1 {Time index, at 2.09 Hz average cycle rate}
k
2
= 1 {Short term memory update rate at 0.6Hz}
T = 2 {Decision threshold}
Require: Initialization procedure
loop
Acquire I
k
{The depth image acquired at instant
k
1
}
d
k
1
= mean(I
k
1
− I
k
1
−1
) {Mean differential
depth}
D
k
1
= [d
k
1
−1
,d
k
1
−2
,...,d
k
1
−N
] {Short term
memory of differential depths}
D
k
1
= mean(D
k
1
)
if Time to update short time memory then
D =
|d
k
1
− j
− D
k
1
|, j = 0 .. .N
{Short term
deviations to the mean}
D
s
= sort(D) {Sorting in ascending order}
D
k
1
+1
= D
s
[1 : N] {Keep the N smallest devi-
ations}
end if
if |d
k
1
− D
k
1
| > T then
Signal movement detected
end if
end loop
Algorithm 1 embeds a short term memory that al-
lows the adaption of the system to changing environ-
ments. Even if no movement is detected the variable
D
k
1
keeps being updated. The speed of adjustment
can be tuned through the short term window size, the
update rate of D
k
1
, and/or the decision threshold.
People walks at an average frequency of 1.9 Hz
(normal pace) and average velocity of 1.35 m/s, (Ji
et al., 2005). This means that a person can easily be
caught in the Kinect field of view more than once as
it moves in front of the sensor as the cycle rate of the
classifier is higher. As the velocity decreases more
times the person is detected and hence the detection
events obtained does not discriminate among persons.
If necessary, this bias can be removed by imposing a
minimum time between events of 1/2.09 s.
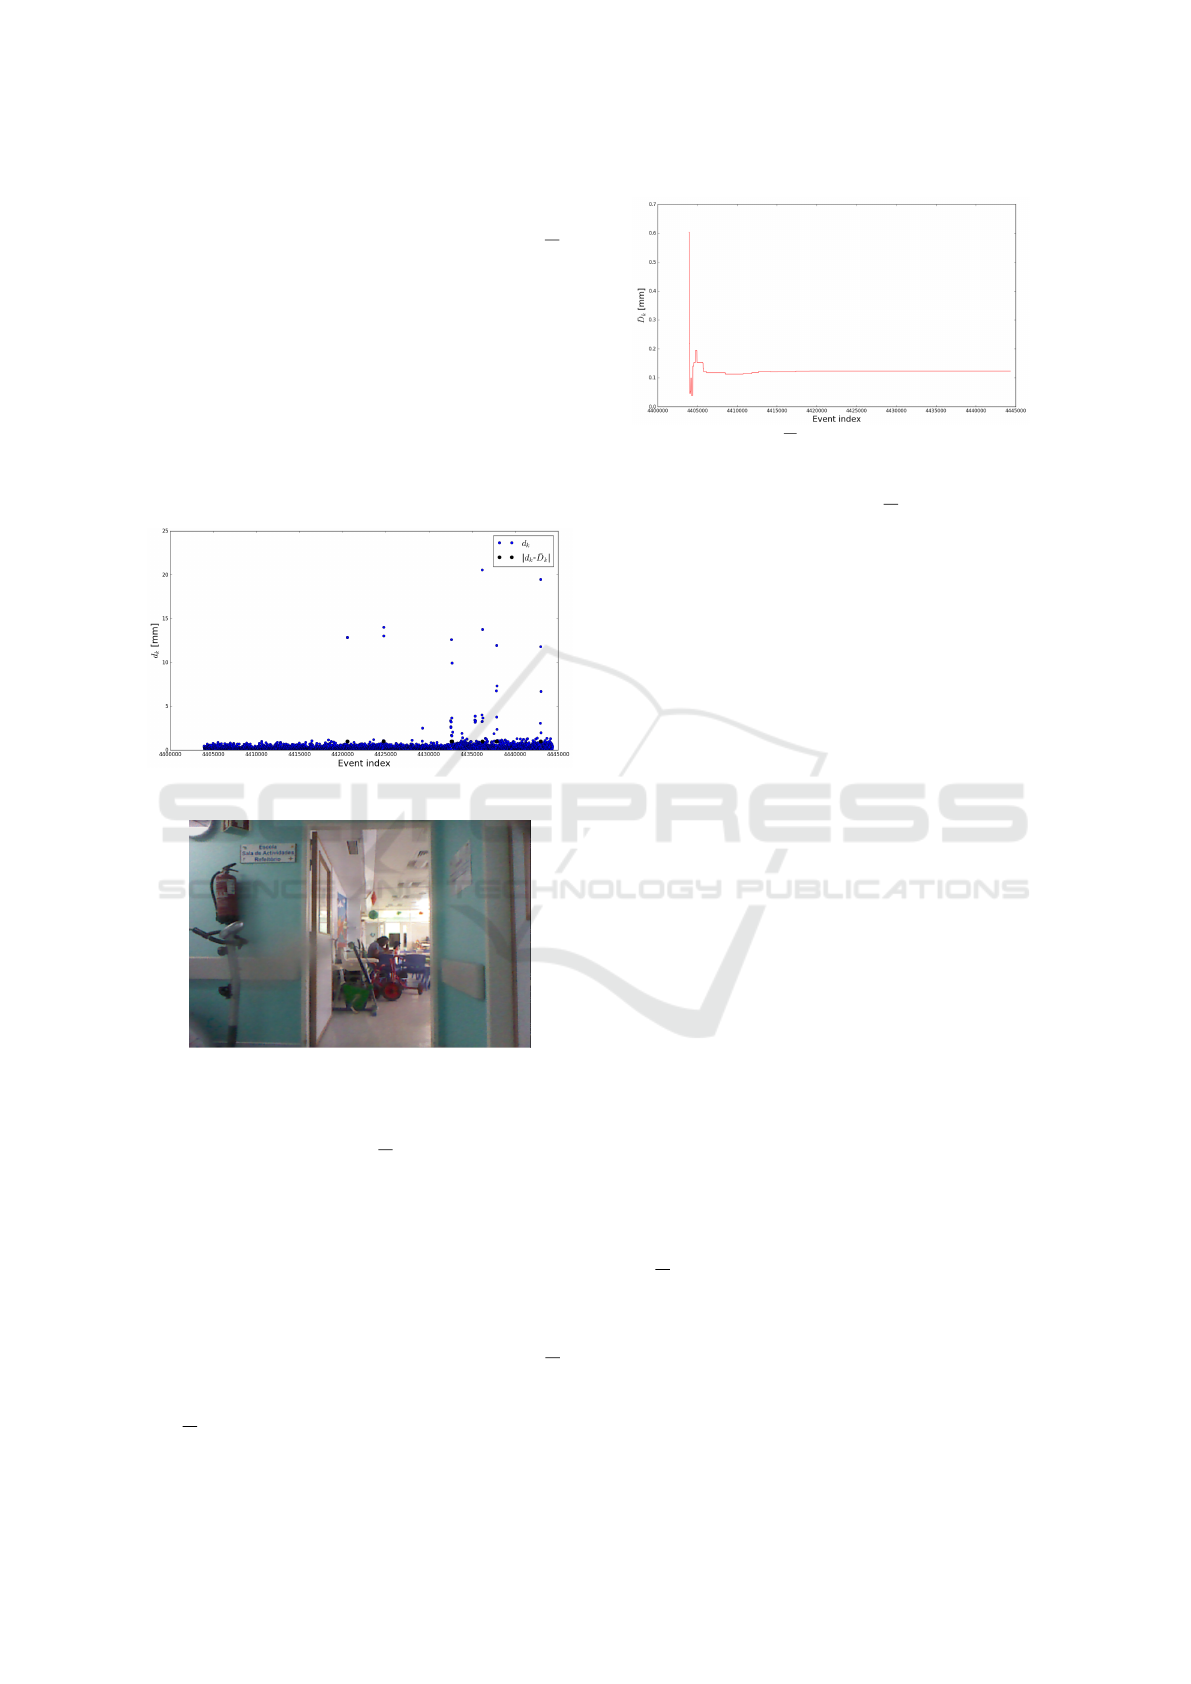
Figure 4 shows d
k
(blue points) and |d
k
− D
k
|
(black points) over time. The black points indicate
instants where the classifier detected someone was
nearby. This sample was obtained at the hospital with
the sensor facing a lobby area (see figure 5). This
location is a crossing point and usually there is peo-
ple passing by. The detection of movement in a lobby
area is a key feature for a social robot making it aware
of the social space and thus enabling interesting inter-
actions with people. Furthermore, people passing by
may also be increasingly aware that the robot knows
(in social terms) its surrounding space.
Figure 4: Classifier variables along time.
Figure 5: Hospital ward view from the sensor perspective.
The d
k
values around 0 represent moments of in-
activity. Peaks correspond to movement detection (in-
cluding false positives). The D
k
tends to 0.2.
The short term memory is initialized to D
0
=
[0,0,0,0,0]. As images are acquired, these values are
adjusted (see algorithm 1).
As aforementioned, the Kinect produces some
noise which can skew the d
k
, hence the black points
may refer to false positives. In this sample a 96% true
positive was achieved, which is sufficient for HRI ap-
plications.
Figure 6 corresponds to the adjustment of the
D
k
.
This variable allows the system to infer if there is
movement on the robot surroundings. At initializa-
tion D
k
= 0.6 because the values previously measured
Figure 6: D
k
temporal evolution.
and stored by the system were close to it. After the
Kinect starts to adjust this value D
k
starts to approx-
imate 0.12, setting the value from which the system
decides if reacts or no.
4 EXPERIMENTS
The experiments in this section illustrate the identifi-
cation of statistical models for the social environment
at the hospital from a perspective of a static bystander
(in the case the robot with a Kinect sensor on board).
4.1 Setting up the System
The purpose of the initial tests is to verify that no ex-
ogenous conditions, e.g., lighting are likely to disturb
the sensing (though they may still influence the data
acquired), and establish a baseline for future work.
4.1.1 Test 1
Figure 7 shows images taken at the hospital where it
can be seen that two people are staying in front of the
robot. The upper row shows the previous and current
images. In the bottom row, the first one shows the dif-
ference between previous image and the current one
whereas the second shows the same image obtained
immediately after the motion (and hence containing
only the detection noise).
The second image on the bottom row shows the
difference if people were not present, i.e., the image
after the subtraction process. The d
k
value of each im-
age on the bottom row, are 4.5 and 0.8, respectively.
The D
k
at this point was 0.45. Applying the thresh-
old on this information one concludes that on the first
situation people were present and on the second one
were not.
(a) I
k−1
(b) I
k
(c) I
k
− I
k−1
(d) I
k
− I
k−1
no movement
Figure 7: Experiment 1 (hospital).
4.1.2 Test 2
The data acquired by the Kinect is not always accu-
rate, with the images showing some noise (see the
comments in section 3). Unlike RGB images, depth
images should be less influenced by lighting condi-
tions. Nevertheless, if the Kinect is outshine by di-
rect light, depth measurements are affected as these
images are created using the infrared laser that uses
infrared patterns for depth estimation. Thus infrared
patterns provide wrong measurements if blinded by
light. This results in undefined pixels on those areas.
If the lighting changes, the undefined pixels might
also change to specific values, or remain undefined.
(a) I
k−1
(b) I
k
(c) I
k
− I
k−1
(d) RGB image
Figure 8: Experiment 2 (lab).
To ensure that the implementation is robust to lighting
changes the robot was placed at a specific location in-
side the lab, facing a window. The RGB image of this
example is shown on the second image in the bottom
row in figure 8.
Figure 8 also shows the previous and current depth
images at a time when someone was passing by, and
the correspondent image difference. When the images
were taken D
k
= 0.103 and d
k
= 8.29. The classifier
concluded that there was someone nearby.
Comparing these values with those of the first test
it can be argued that there are no significant differ-
ences in the D
k
and d
k
values. The locations where
both experiments were performed are different thus
leading to different values. Even if the places were
the same, these values would not be exactly equal be-
cause they are influenced by the distances to the ob-
stacles in front of the robot.
In conclusion, the illumination does not impacts
the decision making of whether the environment is
dynamic or not.
4.2 Identification of the Hospital
Environment
These experiments took place at the Pediatrics ward
of a hospital, with the robot placed in a small lobby
connecting the main corridor and a playroom for the
inpatient children. The robot stayed static during the
full trials period, with the Kinect sensor active be-
tween 8 : 00 and 22 : 00. This period was divided into
a set of 5 smaller periods, of unequal length, empiri-
cally defined (see below).
Figure 9 plots the actual time between events
along a period of 6 days. The raw event index plot
does not classifies the events according to their oc-
currence. Instead it shows them in the occurring se-
quence. Both plots clearly show differences in activ-
ity though in the raw event index plot the regions of
higher and lower activity are better discriminated.
Figure 10 shows a power law fitting to the time in-
dexed data, with the corresponding parameters shown
in Table 1 for the day periods considered.
Table 1: Parameters a, b, c estimated for a power law of the
form a(x + b)
−n
+ c, for n = 2.
Periods (hours) a b c
8-11 1.802e4 1.785 21.05
11-14 1.643e4 3.028 8.464
14-16 1.674e4 1.64 12.5
16-20 2.024e4 1.417 12.63
20-22 1.9664 1.368 28.77
The curves are clearly comparable as their shape
parameters are close to each others among the differ-
ent periods. This supports the claims that (i) a social
environment may be given a power law representa-
tion (for the time between people passing at a specific
place), and (ii) the vast majority of the events exhibits
a small time between them, expressed by the long flat
plateau that follows event index 1000.
Moreover, figure 10 can be interpreted as a 2-state
environment dynamics. If events are identified with
the time between detections, a first state indicates a
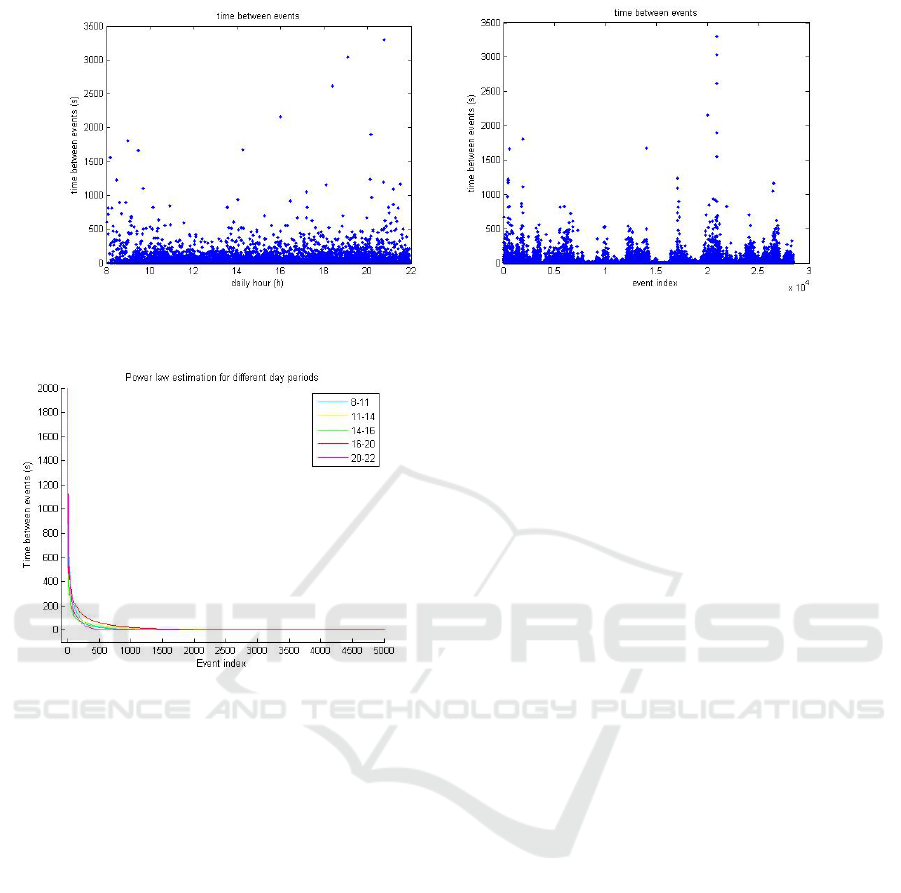
(a) Raw event indexing (b) Time indexing
Figure 9: Time between events (s).
Figure 10: Power law fitting to time indexed data for the
different daylight periods.
relatively small number (compared to the duration of
the experiments) of long duration events. This corre-
sponds to the left hand side of the plots, until around
index 500. A second state indicates a big number
(more frequent) of short duration events, roughly cor-
responding to the region after index 500.
Table 2 shows the parameters for Weibull,
Gamma, and Lognormal distributions estimated over
the aforementioned periods. These distributions were
selected as (i) they cover the positive numerical space,
and (ii) they are parameterized such that comparable
shapes can be obtained by manipulation of their pa-
rameters.
The numerical values suggest some accordance
between Weibull and Lognormal distributions. These
can thus be used to represent the arousal conditions
of the social environment and establish activity levels
compatible with them.
4.3 Towards Robot Behaviors in a
Social Environment
How a robot should behave in a social environment
and what people expect from it is still a trendy topic in
human-robot interaction. A common objective among
humans is to obtain social acceptance. In fact this
is at the core of human personality (see for instance
(Maslow, 1970)). In what concerns social robotics,
this is also a natural objective though it is entirely
admissible that a robot be introduced in a social en-
vironment with disruptive goals (something that also
happens in human environments).
The behaviors of the robot must make people be-
lieve that the robot is aware of the daily dynamics of
the environment and that it can adapt itself and fos-
ter its own social integration, contributing to improve
the global mood and offer alternatives to the people’s
routine.
The statistical models in the previous section sug-
gest that some behaviors be designed using also a sta-
tistical approach. For example, having the robot ex-
hibiting liveliness features is likely to contribute to the
acceptance by the people present in the ward. How-
ever, these must match corresponding features of the
environment, this meaning that some statistical mod-
els are not to be disturbed.
A single behavior is used to assess the perfor-
mance of the classifier, namely implementing a liveli-
ness feature. The robot simply turns the head at reg-
ularly spaced intervals, every 4 minutes on average.
The goal is to assess the changes in the models previ-
ously identified.
For staff the presence of a robot should not in-
terfere with the normal operation of the ward. This
means that small or no disturbances were detected
in the environment models identified. Inpatients and
visitors are more likely to stay in front of the robot,
Table 2: First and second moments, µ,σ
2
, per distribution and period considered.
Periods (hours)
Distribution 8-11 11-14 14-16 16-20 20-22
µ,σ
2
µ,σ
2
µ,σ
2
µ,σ
2
µ,σ
2
Weibull 15.26, 1.35e3 6.81, 157.48 10.12, 436.02 9.01, 380.87 22.56, 3.995e3
Gamma 23.03, 1.68e3 8.92, 182.98 14.31, 547.98 13.70, 537.51 34.63, 4.341e3
Lognormal 11.79, 2.64e3 5.04, 134.46 7.58, 508.61 6.28, 349.54 18.88, 1.634e4
Table 3: First and second moments, µ,σ
2
, per distribution and period considered with liveliness behavior.
Periods (hours)
Distribution 8-11 11-14 14-16 16-20 20-22
µ,σ
2
µ,σ
2
µ,σ
2
µ,σ
2
µ,σ
2
Weibull 9.68, 344.22 4.52, 42.51 8.23, 195.08 5.46, 84.06 9.74, 384.73
Gamma 12.15, 350.14 5.21, 42.44 9.72, 190.05 7.03, 99.67 12.94, 424.92
Lognormal 7.58, 434.94 3.43, 22.65 6.63, 220.76 3.8, 40.2 7.09, 378.96
leading to periods of significant decreases in the time
between events. Moreover, if the head of the robot
moves, the perception of liveliness should increase
and this should be reflected in the models estimated
both (i) because of people responding to the head
movement, and (ii) the movement of the head it-
self that causes the depth image subtraction to have
enough information for the classifier to decide for
movement.
Table 3 shows the parameters estimated for the
same three distributions considered before. These re-
sults were obtained for a single day, without the first
period.
The results suggest that even simple primitive be-
haviors such as having the robot turning the head on a
regular basis have an impact on the models. Whatever
the distribution chosen, there is a decreasing trend in
the mean values, namely in the three afternoon peri-
ods, as expected. The variances in these periods show
a decrease trend and, overall, the results are consistent
with the expectations.
These quantitative results suggest that very simple
interactions may indeed induce changes in the social
environment. Moreover, they provide an objective
measure of acceptance. In fact, the number of events
occurring within a certain interval may be interpreted
as an acceptance indicator. One can have situations
where the higher the number of events the greater the
acceptance; if persons tend to move in front of a robot
more frequently when it moves the head this may in-
dicate acceptance of the motion (people tend naturally
to avoid repeating non-rewarding behaviors).
5 CONCLUSIONS AND FUTURE
WORK
The paper discussed the implementation of a motion
awareness system and its use in the identification of
models for social environments based on time be-
tween events.
The system is based in depth image information
with a short term memory classifier.
Section 4 tested the system against exogenous
conditions, that could affect how images are provided.
The conclusion was that the normal lighting varia-
tions do not influence the system. The results ob-
tained also in this section show that a hospital ward
environment can be modeled by a deterministic power
law and by probability distributions, namely Weibull
and Lognormal. These models are enablers to fur-
ther studies on (i) other classifiers, and (ii) adjustment
strategies for the behaviors of the robot.
Future work extends this discussion to (i) a mov-
ing sensor, as when the robot moves along the ward
(and not only to the rotation of the head), and (ii) spe-
cific classes of events, e.g., events observed in spe-
cific areas of the environment or events observed from
depth and color information.
Also, acceptance has been shown to depend on
the educational background of people. By combining
Kinect based data from a system, such as the one de-
scribed in this paper, with a people identification strat-
egy it will be possible to identify which groups of peo-
ple influence acceptance (recall that in a telemedicine
context (Ziefle et al., 2013) have shown that different
social groups accept technologies differently).

ACKNOWLEDGEMENTS
This work was supported by projects FP7-
ICT-9-2011-601033-MOnarCH and FCT
[UID/EEA/50009/2013].
REFERENCES
Chen, X., Henrickson, K., and Wang, Y. (2016). Kinect-
based pedestrian detection for crowded scenes.
Computer-Aided Civil and Infrastructure Engineer-
ing, 31(3):229–240.
Cippitelli, E., Gasparrini, S., Gambi, E., and Spinsante, S.
(2016). A human activity recognition system using
skeleton data from rgbd sensors. Computational intel-
ligence and neuroscience, 2016:21.
Correa, D. S. O., Sciotti, D. F., Prado, M. G., Sales, D. O.,
Wolf, D. F., and Osorio, F. S. (2012). Mobile robots
navigation in indoor environments using kinect sen-
sor. In Critical Embedded Systems (CBSEC), 2012
Second Brazilian Conference on, pages 36–41. IEEE.
Duffy, B. (2003). Anthropomorphism and the social robot.
Robotics and autonomous systems, 42(3):177–190.
Eriksson, T. and Ragnerius, E. (2012). Autonomous robot
navigation using the utility function method and mi-
crosoft kinect.
Gockley, R., Forlizzi, J., and Simmons, R. (2007). Natural
person-following behavior for social robots. In Pro-
ceedings of the ACM/IEEE international conference
on Human-robot interaction, pages 17–24. ACM.
Greff, K., Brand
˜
ao, A., Krauß, S., Stricker, D., and Clua, E.
(2012). A comparison between background subtrac-
tion algorithms using a consumer depth camera. In
VISAPP (1), pages 431–436.
Herbert-Read, J. (2016). Understanding how animal groups
achieve coordinated movement. Journal of Experi-
mental Biology, 219(19):2971–2983.
Holzinger, A., Schaupp, K., and Eder-Halbedl, W. (2008).
An Investigation on Acceptance of Ubiquitous De-
vices for the Elderly in an Geriatric Hospital En-
vironment: using the Example of Person Track-
ing. In Miesenberger, K., Klaus, J., Zagler, W.,
and Karshmer, A., editors, Computers Helping People
with Special Needs, Lecture Notes in Computer Sci-
ence, LNCS 5105, pages 22–29. Heidelberg, Berlin:
Springer.
Ji, T. et al. (2005). Frequency and velocity of people walk-
ing. Structural Engineer, 84(3):36–40.
Khoshelham, K. and Elberink, S. O. (2012). Accuracy and
resolution of kinect depth data for indoor mapping ap-
plications. Sensors, 12(2):1437–1454.
KPMG (2016). Social Robots. KPMG.
Lopes, L. S. and Connell, J. H. (2001). Semisentient robots:
Routes to integrated intelligence. IEEE Intelligent
Systems, 16(5):10–14.
Lun, R. and Zhao, W. (2015). A survey of applications and
human motion recognition with microsoft kinect. In-
ternational Journal of Pattern Recognition and Artifi-
cial Intelligence, 29(05):1555008.
Luo, J., Wang, W., and Qi, H. (2014). Spatio-temporal fea-
ture extraction and representation for rgb-d human ac-
tion recognition. Pattern Recognition Letters, 50:139–
148.
Maslow, A. (1970). Motivation and Personality. Harper &
Row, N.Y.
Musse, S. and Thalmann, D. (1997). A model of human
crowd behavior: Group inter-relationship and colli-
sion detection analysis. In Computer animation and
simulation, volume 97, pages 39–51. Springer.
Nakauchi, Y. and Simmons, R. (2000). A social robot
that stands in line. In Intelligent Robots and Systems,
2000.(IROS 2000). Proceedings. 2000 IEEE/RSJ In-
ternational Conference on, volume 1, pages 357–364.
IEEE.
Oliver, A., Kang, S., W
¨
unsche, B. C., and MacDonald, B.
(2012). Using the kinect as a navigation sensor for
mobile robotics. In Proceedings of the 27th Confer-
ence on Image and Vision Computing New Zealand,
pages 509–514. ACM.
Trotter, W. (1916). Instincts of the Herd in Peace and War.
Macmillan.
Varanasi, S. and Devu, V. K. (2016). 3d object reconstruc-
tion using xbox kinect v2. 0.
Xia, L., Chen, C.-C., and Aggarwal, J. K. (2011). Human
detection using depth information by kinect. In CVPR
2011 WORKSHOPS, pages 15–22. IEEE.
Yang, L., Ren, Y., and Zhang, W. (2016). 3d depth im-
age analysis for indoor fall detection of elderly people.
Digital Communications and Networks, 2(1):24–34.
Zhang, J., Huang, Q., and Peng, X. (2015). 3d reconstruc-
tion of indoor environment using the kinect sensor. In
Instrumentation and Measurement, Computer, Com-
munication and Control (IMCCC), 2015 Fifth Inter-
national Conference on, pages 538–541. IEEE.
Ziefle, M., Klack, L., Wilkowska, W., and Holzinger, A.
(2013). Acceptance of Telemedical Treatments A
Medical Professional Point of View. In Yamamoto,
S., editor, Human Interface and the Management of
Information. Information and Interaction for Health,
Safety, Mobility and Complex Environments, Lecture
Notes in Computer Science LNCS 8017, pages 325–
334. Berlin Heidelberg: Springer.
