
Environment Recognition based on Images using Bag-of-Words
Taurius Petraitis
1
, Rytis Maskeliūnas
1
, Robertas Damaševičius
1
, Dawid Połap
2
, Marcin Woźniak
2
and Marcin Gabryel
3
1
Department of Multimedia Engineering, Kaunas University of Technology, Kaunas, Lithuania
2
Institute of Mathematics, Faculty of Applied Mathematics, Silesian University of Technology, Gliwice, Poland
3
Institute of Computational Intelligence, Czestochowa University of Technology, Czestochowa, Poland
Keywords: Object Recognition, Scene Recognition, Image Processing, Bag-of-Words, SIFT, SURF.
Abstract: Object and scene recognition solutions have a wide application field from entertainment apps, and medical
tools to security systems. In this paper, scene recognition methods and applications are analysed, and the
Bag of Words (BoW), a local image feature based scene classification model is implemented. In the BoW
model every picture is encoded by a bag of visual features, which shows the quantities of different visual
features of an image, but disregards any spatial information. Five different feature detectors and two feature
descriptors were analyzed and two best approaches were experimentally chosen as being most effective
classifying images into eight outdoor categories: forced feature detection with a grid and description using
SIFT descriptor, and feature detection with SURF and description with U-SURF. Support vector machines
were used for classification. We also have found that for the task of scene recognition not just the distinct
features which are found by common feature detectors are important, but also the features that are
uninteresting for them. Indoor scenes were experimentally classified into five categories and worse results
were achieved. This shows that indoor scene classification is a much harder task and a model which does
not take into account any mid-level scene information like objects of the scene is not sufficient for the task.
A computer application was written in order to demonstrate the algorithm, which allows training new
classifiers with different parameters and using the trained classifiers to predict the classes of new images.
1 INTRODUCTION
According to the World Health Organization
(Pascolini and Mariotti, 2011), in 2010 there were
285 million partially sighted people in the world, of
which 39 mln. were blind. Efforts to solve the
problem of integrating these people into society has
been relevant for long, e.g., the Braille writing
system has spread throughout the world as an
analogue of ordinary alphabets to the blind. With the
advancement of technology and the ever deeper
functioning of the human brain, new possibilities for
the integration of the partially sighted and the blind
into society are emerging.
Computer vision aims to provide the computer
machines with a sophisticated sensation of sight. A
system capable of extracting semantic information
from a digital video signal is also useful in the real
world, such as providing help for the disabled (the
blind), and in applications such as photo album
management. Automatical retrieval of meaningful
information is also an important step in the
development of artificial intelligence, as well as the
foundation for more complex computer vision
systems. Computer-based interpretation of visual
information on a computer can be used to help
people with disabilities (the blind) to understand the
environment, to choose the best travel routes and to
avoid any obstacles while moving. For example an
auxiliary real-time navigation system (Mann et al.,
2011) uses the Microsoft Kinect sensor on the
helmet, calculates the user's distance to the obstacle
and, if necessary, vibes to warn the user about an
obstacle.
The information extracted from images of
environment can be used to extract textual
information (Ezaki et al., 2004). Such information
would particularly help the visually impaired people
to orient themselves in artificial environments such
as shops, etc.
Environment recognition technology, although
widely used in the social sphere, can help people
with disabilities to integrate into society. Correctly
Petraitis T., MaskeliÅ
´
nnas R., DamaÅ ˛aeviÄ ius R., PoÅ
´
Cap D., WoÅžniak M. and Gabryel M.
Environment Recognition based on Images using Bag-of-Words.
DOI: 10.5220/0006585601660176
In Proceedings of the 9th International Joint Conference on Computational Intelligence (IJCCI 2017), pages 166-176
ISBN: 978-989-758-274-5
Copyright
c
2017 by SCITEPRESS – Science and Technology Publications, Lda. All rights reserved

recognizing an environment in the image is an
important task in most computer vision systems
because it provides contextual information. Objects
are easier to detect and recognize when they are
portrayed in their environment. Knowledge of the
context helps to simplify the object detection task by
narrowing the search field, the categories of objects
to be searched, etc. (Oliva and Torralba, 2007).
Human performance by far exceeds the
efficiency of computer systems when performing
environment or object recognition tasks. However,
human visual abilities are degraded in a dark
environment or after a long observation time, and it
is dangerous or impossible to work for a person
under certain conditions of work (Chan et al., 2002).
Computer-based system can detect objects of
interest in the dark by ultrasound or X-rays
penetrating opaque materials and providing
information that can not be seen by naked eye. All of
this extends the limits of human visual capabilities
for environment recognition and perception, but also
complements them with new capabilities.
The aim of this paper is to present a method for
classifying digital images into specific categories
(e.g., forest, city), which may be usable in the
environment recognition system for partially blinded
or blind system. The concept is relevant for Assisted
Living Environments (ALE) (Dobre et al., 2016),
which aim to provide devices and services to enable
independent living of disabled people. We analyze
different object and scene recognition algorithms,
compare methods for image feature extraction and
present the results of experiments.
2 STATE OF THE ART
The environment recognition methods can be
categorized into two groups: global and local
information-based methods.
Global information-based methods analyze each
scene as an individual object and classify the scenes
according to their global characteristics. Each scene
can be described by a small set of properties derived
from the information in the spectral picture. The
global scene can be characterized using the Spatial
Envelope (Oliva and Torralba, 2011) features
(naturalness, openness, roughness, expansion,
ruggedness) that represent the dominant spatial
structure of a scene. First, for each of these
properties, discriminant spectral templates are
generated. Then, by multiplying the corresponding
template from the energy spectrum of the image, a
characteristic value for that image is obtained. The
classification is performed using K-Nearest
Neighbors (KNN) classifier and reaching, on
average, 86% accuracy when classifying images into
8 categories. Relatively high accuracy achieved
shows that in order to classify environment images,
specific information about the objects contained
therein is not needed and global information about
the scene is enough. Dutt et al. (2009) used tree
structure classification. First, the picture is classified
as natural or artificial, then, depending on the
category, further classification is performed until the
end of the tree is reached. The authors argue that the
structure of the tree was intuitive, e.g., the street and
motorway categories are cut off only at the end,
because their characteristics are very similar.
Local information based methods analyze local
properties of each scene, so the analysis of an image
begins from fine details and their local properties
(quantity, position, composition), when deciding to
which category the scene belongs to. Vogel and
Schiele (2004) categorized scenes by means of a
semantic assessment of typology. These categories
reflect the most general categories of scenes that are
used as the starting point for describing each image.
But in reality, most natural scenes can be described
ambiguously, depending on the subjective point of
view. In this case, the accuracy of the classification
is not an objective indicator, since it only shows a
coincidence with subjective annotation of a picture.
That is why the authors in their work suggest
focusing not on the accuracy of scene assignment,
but on their degree of typicality. In each category,
typical and less representative examples of this
category can be found, and the differences in
typicality are the most effective feature in
classification. The assessment of the typology
should directly reflect the similarity of the image to
the prototype image of the category, i.e. less typical
images should have a lower degree of
representativity than typical images of that category.
Representativeness is calculated as the Mahalanobis
distance between image feature vector and the
category prototype vector, normalized to a range
from 0 to 1. Then, the classification is accomplished
by assigning an image to a category with the largest
value of the representativeness. The concept of
representativeness in categorizing is an important
topic in the research of visual psychophysics (Lu
and Dosher, 2013). The method reached 89.3%
classification accuracy using images with manually
marked local properties. Using the first and second
best match, achieved 98% accuracy, which shows
that misclassified scenes semantically are similar to
both categories.

The aforementioned methods have proven their
importance in environmental recognition, but they
require human intervention (Dutt et al., 2009), which
implies possible inaccuracies due to the subjective
approach of people and required additional labour.
On the contrary, in (Fei-Fei and Perona, 2005)
intermediate information is used, which include both
local and global scene features. The so-called
localized regions have a similar semantic meaning or
visual appearance. First of all, local properties are
clustered into regions, and then these are
categorized. This yields a hierarchy based on the
statistical distribution of local properties in regions
and the distribution of regions in categories.
Classification in 13 image categories and using 40
regional topics achieves 64% accuracy.
Csurka et al. (2004) also propose a fully
automated, non-interventional scene classification
model similar to (Fei-Fei and Perona, 2005), but the
classification is performed without the use of
intermediate information. The main steps are: 1)
automatic detection of specific visual image features
and descriptor descriptions, 2) attribution of
descriptions of these attributes to clusters (visual
dictionary), 3) creation of a bag of keypoints for
calculating how many attributes are assigned to each
cluster, and 4) using the special features bag as an
input vector to classifier, assigning the image to the
predicted category.
In order to achieve best results, the descriptors
obtained in the first step should be resistant to image
transformations, lighting variations and occlusion,
and at the same time be able to describe the
information necessary for categorization. The cluster
mentioned in the second step is a pool of similar
distinctive properties. These pools are made up of
vector quantization algorithms from a large set of
features. Clusters have their own centers, which are
used as words of a visual dictionary - new special
features, or visual words, assigned to the center of
the nearest cluster. This illustrates the analogy
between a language dictionary made of words and a
visual feature dictionary that consists of vectors
representing the centers of clusters. The authors
assume that the visual dictionary must be large
enough (at least 1000 visual words) to have all the
important distinctive features attributed to different
clusters, but not too large, so as not to create clusters
of noise from the images. They solve this problem
by creating several such dictionaries, using different
descriptors for each dictionary. Then the best
dictionary is selected by trial. Having a visual
dictionary, scene images can be described by the
histograms of visual words in them. The task of
categorization is reduced to a simple template
matching task. The method allowed to achieve 85%
accuracy for 7 different categories when using the
Support Vector Machine (SVM) classifier.
Gabryel and Damaševičius (2017) presented a
modified Bag-of-Words (BoW) algorithm. The
modification involves using two different types of
image features – the descriptor of a keypoint and the
colour histogram, which can be obtained from the
surroundings of a keypoint. Using this additional
image feature significantly improves image
classification results by using the BoW algorithm. In
(Gabryel and Capizzi, 2017), the method was
extended with an evolutionary algorithm, which
analyses the visual words’ dictionary and modifies
histogram values before storing them in a database.
Nature-inspired optimization algorithms have
been used for preprocessing of images and
extraction of keypoints, which can be used further
for image segmentation and scene recognition.
Examples are Artificial Bee Colony (Wozniak et al.,
2015), Ant Colony (Polap et al., 2015), Firefly
Algorithm (Napoli et al., 2014), and Cuckoo Search
Algorithm (Wozniak and Polap, 2014).
Further, we review four image feature detection
methods: Scale Invasive Feature Transform (SIFT),
Speed-Up Robust Features (SURF), Features from
Accelerated Segment Test (FAST) and Maximally
Stable Extremal Regions (MSER).
SIFT (Lowe, 2004) detects special features
regardless of the scale and orientation of the image,
and allows you to reliably detect the same special
features even in slightly distorted images, adding
noise or changing the lighting and / or viewing
point. SIFT detects potentially specific features, and
measures the stability of these properties and
determines their magnitude by eliminating unstable
properties. Then, according to the local gradient
direction, for each specific feature, one or more
orientations are calculated and assigned. With this
information, image data properties can be
normalized to scale, position and orientation - so the
properties become scalable with respect to these
transformations. The method also includes a
descriptor, which detects the special properties
described by the 128-dimensional vectors. The
gradient values and orientations are initially
calculated for the position of the surrounding object,
using the Gaussian filter for the entire image. Then
the descriptor's coordinates and gradient orientations
are rotated before they are detected in the direction
of the special properties. So the descriptor maintains
a normalized orientation of the special characteristic.
SURF (Bay et al., 2006) uses second-order
Gaussian derivative approximations with a box
filter, thus losing some accuracy, but significantly
shortening the calculation time. Detecting properties
at different image scales, in contrast to SIFT, does
not need to use a Gaussian filter, but it is enough to
change the size of the box used, again avoiding
expensive time calculations. SURF descriptors only
use the 64-dimensional vector, which is easier to
generate and compare, but saves less information
that may be useful in itself.
FAST is a method for corner detection (Rosten
and Drummond, 2006). The main feature of this
detector is the speed. The FAST method is available
in real-time (using only 7% of the time for single-
frame processing) to detect corners in a PAL format
video. The algorithm is characterized by speed, but
is not resistant to large noise quantities in pictures,
and results depend on the choice of threshold value.
MSER (Matas et al., 2004) detects specific
regions of an image, which form a set of
interconnected image points that make up the
contour after the thresholding of the image. The
intensity of all points within these regions is either
lighter or darker than the points on the contour. Such
regions are invariant to scaling, lighting, orientation
and viewing point transforms.
3 METHOD
For environment recognition we apply a method
known by several names in the literature: Bag-of-
Words (Gabryel and Capizzi, 2017), Bag of Features
(Lazebnik et al., 2006), Bag of Keypoints (Csurka et
al., 2004).
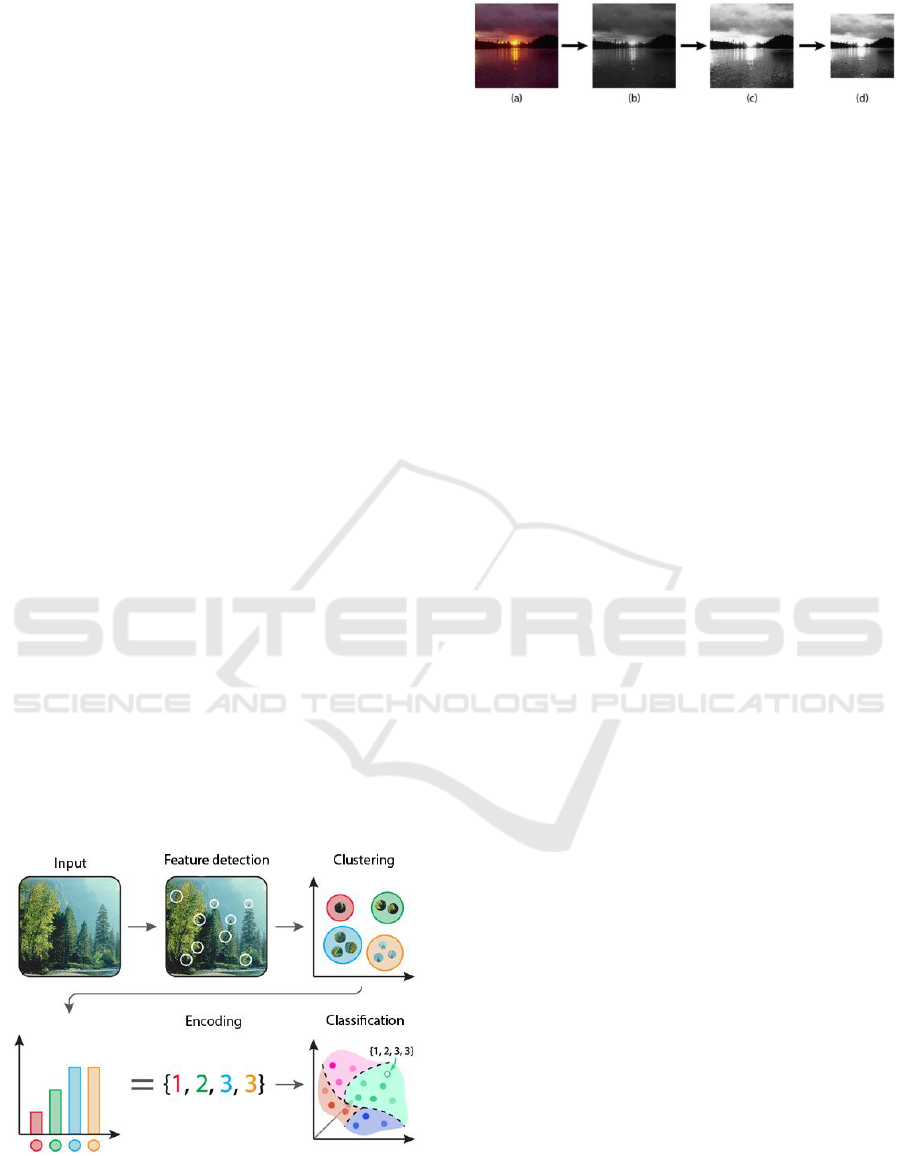
Figure 1: Outline of Bag-of-Words model.
Figure 2: Image preprocessing. (a) – input image (from
dataset (Oliva and Torralba, 2001)), (b) – grayscale image,
(c) – grayscale image with normalized histogram, (d) –
scaled image.
This model is fairly widely used and has proven its
effectiveness in solving image classification tasks
(Vogel and Schiele, 2004; Fei-Fei and Perona,
2005). The model covers almost an entire process of
recognition, but different methods can be used for
each task of the model (Figure 1).
Before applying the method, the images are
preprocessed (see Figure 2): an image is converted
to grayscale, then histogram normalization is applied
and the size of an image is reduced so that image
value does not exceed the predefined value
The first stage of the method is the detection of
features in the picture. In this step, small patches of
the image are likely to be significant for
classification. The properties found are described in
such a way that they can be compared with each
other. Thus, each attribute is assigned to the most
similar "visual word" from the previously generated
dictionary. Dictionary of visual words is derived
from the clusters of similar features. Then the image
is encoded by a vector representing the frequency of
each word in an image. The vector is used as an
input of classifier. We use and analyze four feature
detection methods: SIFT, SURF, FAST, and MSER.
The SIFT descriptor describes each specific
property using a 128-dimensional vector, which is
composed of histograms of regionsaround image
keyponts in 8 different orientations. Depending on
the distance to the keypoint, weight is assigned to
each calculated orientation. The weights are
calculated using the Gaussian function with a mean
deviation parameter equal to half of the scale of
features. The resulting vector is normalized to a
unity vector, and a threshold function is applied to
this vector with a value of and the vector is
normalized again.
The SURF descriptor describes the properties of
a 64-dimensional vector as follows. First, the
dominant orientation of keypoints is calculated.
Then, to describe the region around the keypoint, a
square region is extracted, centered on the keypoint
and oriented along the dominant orientation. The
region is split into smaller 4x4 square sub-regions,
and for each one, the Haar waweforms are extracted.
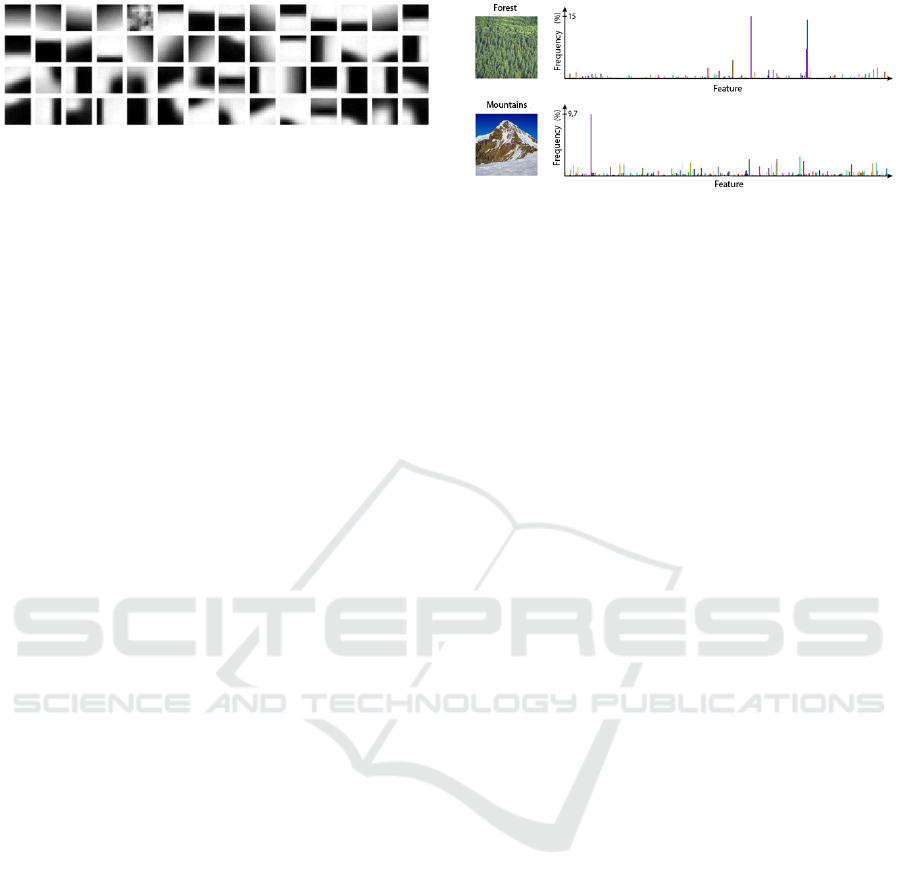
Figure 3: Example: a subset of a dictionary of visual
words.
A variation of the SURF descriptor is U-SURF. In
this variation, the step of calculating the dominant
orientation of features is skipped, thus optimizing
the algorithm's performance, but losing resistance to
orientation transforms.
Dictionary of words is created from a large
collection of images by automatically detecting their
special properties and clustering them. We use the k-
means method for clustering. To improve the
algorithm's performance and results, we use an
improved k-means initiation method (Arthur and
Vassilvitskii, 2007), which, by choosing starting
centers, evaluates the distance of each selected
center from the data points and the points of the
existing centers. Different number of visual words
can be derived. We use 350 words (selected
heuristically). As the k-means algorithm does not
always converge or converges only after a very large
number of iterations, we set the maximum number
of iterations as 20000. Clustering is repeated twice
and clusters with the smallest variation are selected.
An example of visual words is given in Figure 3.
For mapping of keypoints to clusters, Fast
Approximate Nearest Neighbor Search Based
Matcher (Muja and Lowe, 2009) is used. Histograms
are obtained by how much and what features an
image has (Figure 4). Each histogram is normalized
so that the sum of its all column values is equal to 1.
For classification we use Support Vector
Machine (SVM) (Vapnik 1998) as a classifier. SVM
aims to find the optimal possible hyperplane, which
separates two classes in a multidimensional space.
The optimality is estimated from the distance from
the hyperplane to the data of both classes. Since not
all data can be separated linearly, the kernel trick is
used. The data is projected into a higher dimensional
space, where, perhaps, it is possible to separate
them. We use the χ2 kernel. The gamma parameter
of this kernel, determined by the trial-and-error
method, is 0.50625. For training, the number of
iteration is bounded to 70000. Since SVM is a
binary classification method, classifying data into
more than two classes requires classifiers and the
results of classification are voted. According to the
voting results, the winner is determined.
Figure 4: Calculation of histograms.
4 EXPERIMENTS
4.1 Hardware and Software
For the implementation of the methods and
experiments, we used a portable computer with an
Intel Core i7-3630M processor operating at 3.4 Ghz.
The C ++ programming language and the OpenCV
3.1 open source library (https://github.com/
Itseez/opencv) were used to implement this project.
In this version, some of the required methods are not
available, but they are available in the optional
opencv_contrib module (https://github.com/Itseez/
opencv_contrib). The CMake 3.5.0-rc3 software and
Microsoft Visual Studio 2015 compiler were used to
compile the OpenCV library and extra module
output files into binary files in the Windows 10 OS
environment.
4.2 Dataset
We use the dataset from (Oliva and Torralba, 2001).
The dataset consists of 8 categories of environmental
imagery: coast, forest, highway, city, mountain,
open country, street, high buildings. Each category
contains more than 250 annotated images each with
256 × 256 pixels resolution. Since the number of
images in each category is different, only the first
250 pictures of each category are used for the study:
200 for training and 50 for testing. Figure 5 provides
an example of images in each category.
To extend the study, we extended the original
dataset with indoor environment image categories
from (Lazebnik et al., 2006), which added two new
categories to a set of categories used in (Fei-Fei and
Perona, 2005). The new dataset has 15 indoor and
outdoor categories: coast, forest, highway, inside
city, mountain, open country, street, high buildings,
bedroom, industrial, kitchen, living room, office,
shop and suburban.
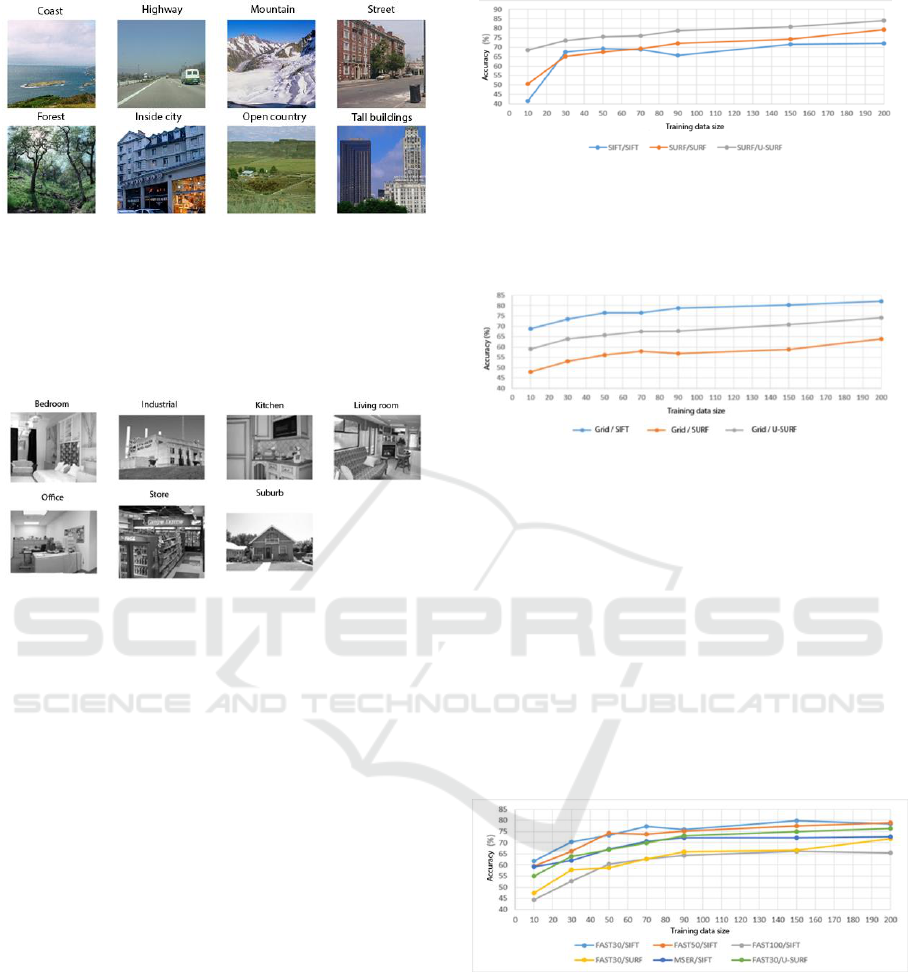
Figure 5: Examples of image categories (Oliva and
Torralba, 2001).
In Figure 6, an example of pictures from additional
categories are shown. There are 200-300 images in
this set of categories, so the first 200 of each
category are used for the tests.
Figure 6: Examples of images in additional 7 categories.
4.3 Results
First, we compare different feature detectors and
descriptors by analyzing various combinations of
them. Experiments use pictures from 8 outdoor
categories. The size of pictures is reduced to 240 ×
240 pixels. Accuracy is calculated by dividing the
number of correctly categorized images from the
amount of images used for testing. We compare
three combinations: SIFT/SIFT, SURF/ SURF and
SURF/U-SURF. The first word denotes a descriptor,
the second is a detector. The results are presented in
Figure 7. Using the SURF detector and the U-SURF
descriptors, the best accuracy (84%) obtained on
average that is 8.43% higher than the SURF / SURF
combinations. This is probably because Bag of
Words model itself is sufficiently resistant to
changes in the orientation of features, so no
additional calculation of orientation is required.
The effectiveness of the descriptors tested using
the grid as a detector has been further analyzed. The
grid step is 12, and the feature size is 6. The results
are presented in Figure 8. The SIFT descriptor (82%
accuracy) gives the best results when detecting the
properties of the grid. The U-SURF descriptor again
Figure 7: Comparison of SIFT and SURF methods.
turned out to be better than the classic SURF, so it
can be said that the orientation information used in
the model is not required in the descriptor.
Figure 8: Classification results using grid-based feature
detection.
Finally, we compare the FAST and MSER detectors.
An important FAST detector parameter - threshold
value - is indicated by the number of the name, e.g.,
FAST30. Figure 9 depict their results using different
descriptors. As in previous experiments, SURF and
U-SURF descriptors appear to be worse than SIFT
when they detect the specific properties detected
outside their detector. The best accuracy (79.75%)
was obtained using a FAST detector with a threshold
value of 30 and a SIFT descriptor. The MSER
detector for detecting regions was not effective in
detectors of extraordinary qualities.
Figure 9: Comparison of detectors: FAST and MSER.
We also have compared the performance in terms of
mean time required for encoding one image (that
includes detecting image features by describing the
descriptor and then describing the image by
histogram). The results are shown in Figure 10.
Using the SURF detector with the U-SURF
descriptor, the image is encoded on average 33%
faster than the SIFT / SIFT combination. Both
combinations yield similar results, so the
combination of SURF / U-SURF is more cost
effective in terms of time. FAST30 / SIFT was the
slowest, which is because of the fact that with a
threshold value equal to 30 FAST algorithms detect
a very large number of features.
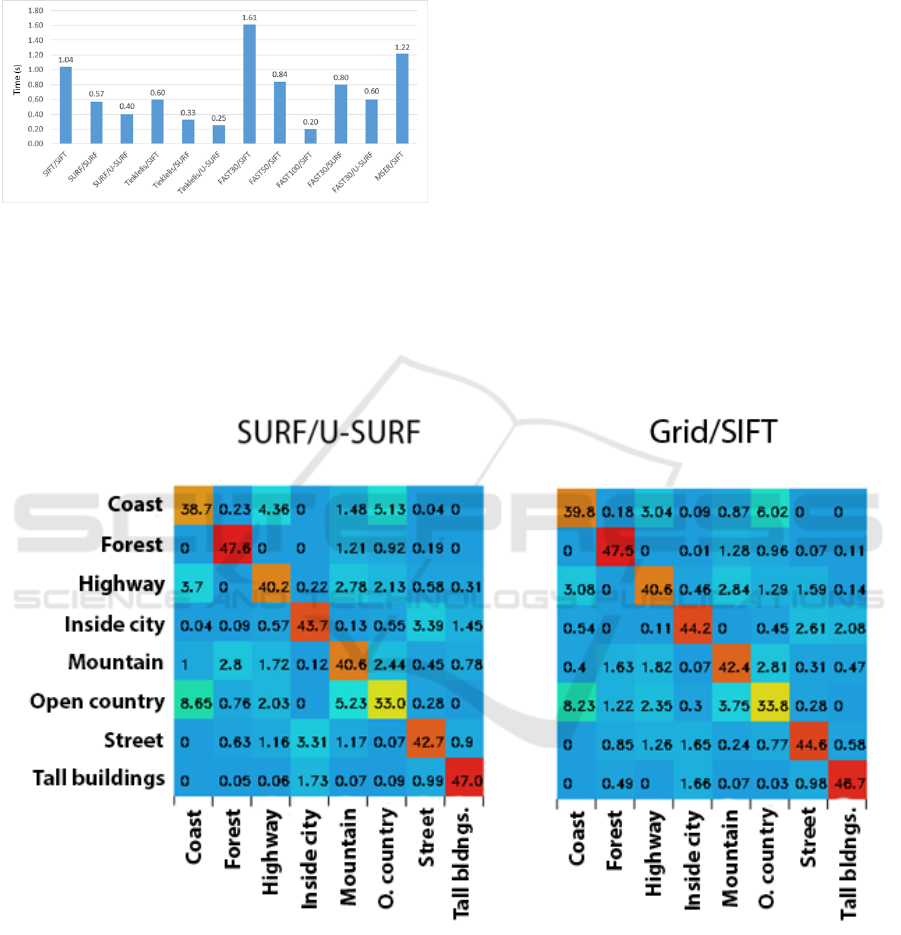
Figure 10: Mean time of image encoding.
As training for classification used the same 200
dataset images, and testing used the remaining 50
dataset images from each category, the accuracy of
the obtained accuracy is not high. In order to obtain
more accurate and reliable results, the classifier was
trained 100 times with the two best (SURF / U-
SURF and Grid / SIFT) combinations, randomly
selecting 200 images for training and 50 for each
category. The combination of SURF / U-SURF has
an average accuracy of 83.51 ± 1.67% and a Grid /
SIFT combination of 84.99 ± 1.45% accuracy. In
Figure 11, the confusion matrices for outdoor
environment categories are presented. The vertical
axis consists of the real class, and the horizontal axis
is the predicted class. Correctly categorized pictures
are diagonal. The averages of the predictions from
100 tests were ranked, in which 50 images of each
class were classified. Both confusion matrices are
very similar and have the general features: the
pictures of the forest, high buildings are classified
most accurately, open nature pictures are often
mixed with coastal and mountain views. It should be
taken into account that the dataset used is not perfect
and may contain some ambiguous images. Also,
some categories are essentially semantically similar,
e.g., street imagery sometimes appears in urban
imagery.
Figure 11: Confusion matrices for outdoor environment categories.
These experiments show that the Bag of Visual
Words model has the most effective combination of
the SURF / U-SURF and Grid / SIFT detectors and
descriptors, with both achieving over 83% accuracy.
The SURF descriptor produced good results only
when used with the SURF detector, and the SIFT
descriptor was most effective in describing the
specific features detected by the grid technique. The
FAST detector with a low threshold value parameter
turned out to detect many distinctive features, and
although it yielded a good result, it took a relatively
long time. The MSER detector has proved to be
inefficient in detecting special features.
For classification of indoor scenes, we used a
second (extended) dataset containing 15 categories
of images. Five categories of them are indoor
scenes. Since the data in this set contains different
sizes of images, they were reduced in proportion to
the size of the experiment by not exceeding 200 ×
200 pixels.
The combinations of Grid / SIFT and SURF / U-
SURF were used to detect and describe the
distinctive features. Using the grid method, its steps
and features are also reduced proportionally to 10
and 5. Because there are fewer images in the
category of this dataset, 200 are used for each
category: 150 for training and 50 for testing.
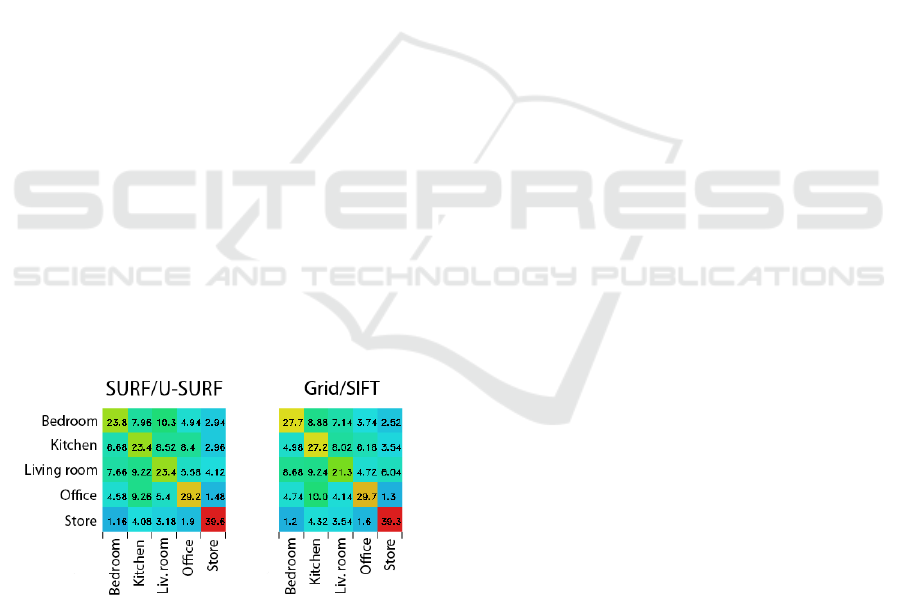
First, the classification accuracy has been tested
to recognize five indoor scenes. The test was
performed 50 times with randomly selected training
and testing images and an average accuracy of 55.85
± 2.81% with SURF / U-SURF and an accuracy of
58.16 ± 2.22% using Grid / SIFT combination was
achieved. The results are presented as confusion
matrices in Figure 12. From the results we can see
that using the Grid / SIFT combination, there is a
better separation between bedroom and kitchen
images, but basically all indoor images are mixed
together. The best of these categories are the store
images. It is noteworthy that the visual images of the
bedroom, the kitchen and the living room are quite
similar, to the person they are separated by the
objects they contain. The store's images are the best
separated, probably because the store environment is
not visually similar to home rooms, as it has many
similar and repetitive objects, little furniture, and a
small amount of open space.
Figure 12: Confusion matrices for indoor environment
scenes.
Finally, classification of all 15 categories of
environment scenes has been performed. The test
was performed 50 times randomly for the selection
of 150 training and 50 test images, using a Grid /
SIFT combination with the same parameters and
obtaining an average accuracy of 67.49 ± 1.50%.
The confusion matrix is presented in Figure 13.
We can see that indoor scenes are not often mixed
with outdoor scenes - most of them are mixed
together. Two new scenes are included: the
industrial environment and the suburbs. Pictures of
the industrial environment include outdoor and
indoor scenes. The pictures of suburban scenes have
been classified quite accurately, and the industrial
environment has often been mixed with most other
categories, especially with store scenes - on average,
7.86 out of 50 pictures of the industrial environment
have been categorized as stores. As can be seen from
Figure 14, industrial scenes are not visually very
similar to other scenes, so they are poorly classified,
probably due to the lack of data used for training,
given that the pictures in this category are both
outdoor and indoor scenes.
The classification of indoor scenes in detecting
special features proved to be a much more difficult
task than the classification of outdoor (exterior)
scenes. This is partly because the indoor scenes are
created artificially, in different scene categories are
similar in their visual features.
5 CONCLUSIONS
We have analysed the use of the Bag of Words
(BoW) model for digital recognition of the
environment scenes. The BoW model is often used
to classify environmental images based on their local
features, therefore, different variants of methods
used for its constituent stages have been analysed.
A demonstration application was developed to
analyse the operation of the algorithm, which allows
us to train the classifier (we used Support Vector
Machine (SVM) with the χ2 kernel) with new
images or to select an already trained classifier and
identify the environment category of a new image.
In our experiments, 200 images of each category
were used for the training of classifiers, and it was
observed that the increase in the amount of training
data reduces the classification errors, but the
precision threshold was not reached because the data
set used is too small. The speed and efficiency of the
algorithm also depend on the methods for detecting
and describing the distinctive image features used,
so the methods for detecting the SIFT, SURF, FAST
and MSER features have been investigated, along
with the SIFT and SURF characterization methods.
We also have analysed feature detection using an
artificial grid, without reference to any local image
information. By experimentally optimizing grid
parameters - step and property sizes - this feature
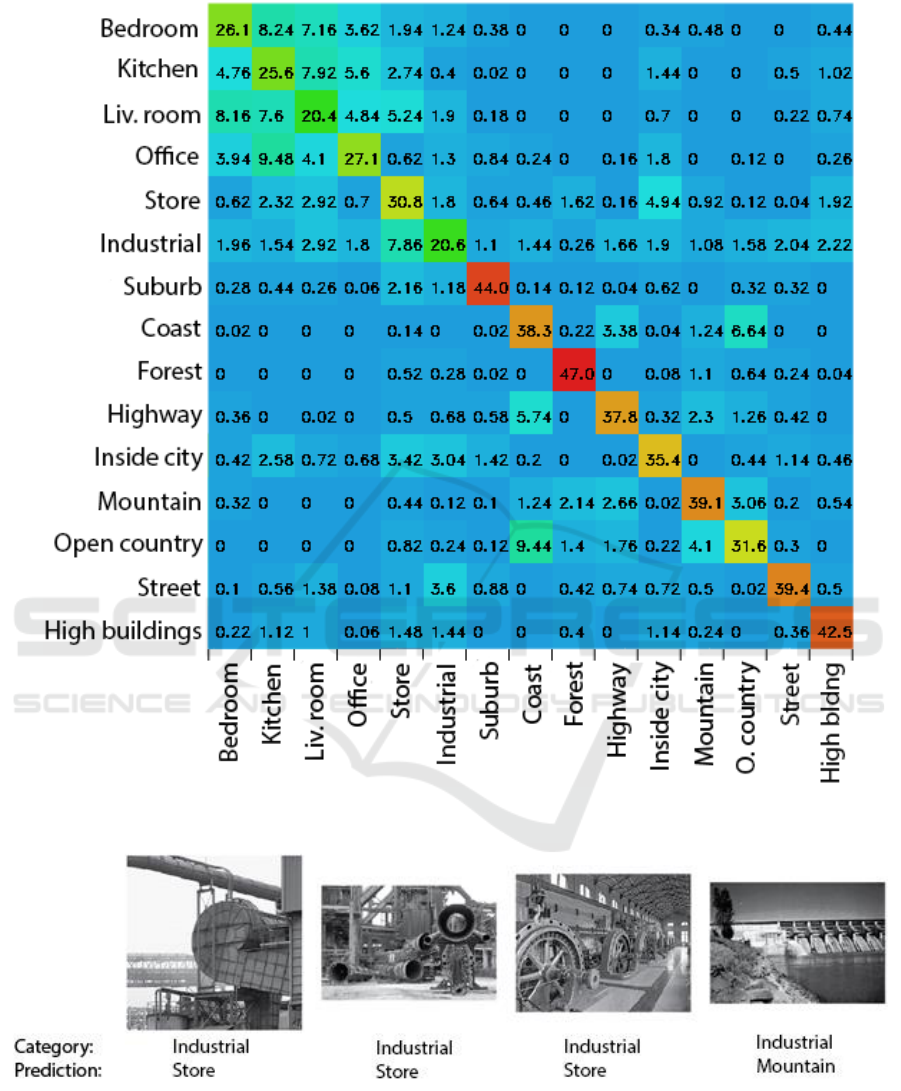
Figure 13: Confusion matrices for all (outdoor and indoor) image categories.
Figure 14: Examples of incorrect classification.
detector has proved to be particularly effective with
the SIFT descriptor. Using a grid pitch of 12 and a
characterization of 6, when the images are reduced
to 240 × 240 pixels, the accuracy of 84.99 ± 1.45%
was achieved by classifying images of outdoor
environments into eight categories. Since the
features detected by the artificial grid yielded better
results than the features discovered by the SIFT

detector (using the same set of images for training
and testing, the characteristics of the grid detected
and described by the SIFT descriptor achieved 10%
larger accuracy), we argue that not only the
distribution of distinctive features is important for
scene recognition, but also information about the
"intrusive" features of the detectors.
The SURF descriptor without orientation
information (U-SURF), worked better than the
classic SURF version of the BoW model. Using an
SURF detector with a U-SURF descriptor, an
average improvement of accuracy of 8.43%
accuracy over the classic SURF descriptor was
obtained. This confirms that specific character
orientation information is not required for the
recognition of the environment by this model, and it
only complicates the recognition process.
The Speed SURF detector with the U-SURF
descriptor operates faster (the image is encoded by
about 33% faster than when using the grid detector
with the SIFT descriptor with an average encoding
time of one image equal to 0.4 s), but a slightly
lower accuracy (83.51 ± 1.67%) has been obtained.
It has been noticed that the SURF descriptor
produces good results only by describing the
features detected by the SURF detector, while the
SIFT descriptor works well with various detectors.
Other combinations of detectors and descriptors
were not as effective as the latter; their accuracy
varied from 65% to 79.75% when performing
classification using 200 images of each category for
training. The algorithm has been tested with two
most effective detector and descriptor combinations
with indoor image images and reached an accuracy
of 55.85% - 58.16% by classifying images into five
categories of indoor environment. The shop's
environment was precisely distinguished, it was
correctly recognized on average 39 out of 50 images,
and the images of the bedroom, kitchen, living room
and office scenes were often mixed together. Having
tested the algorithm's performance with a data set
containing 15 outdoor and indoor categories, the
overall accuracy of 67.49 ± 1.50% was obtained.
Again, the indoor images were often mixed with
each other, but they were rarely blended with the
images of the outdoor environment categories.
We have noticed that the recognition and
separation of indoor scenes is more complicated,
because they are artificially created environments
that have plenty of inter-categorical similarities,
uniform shapes, repetitive objects, which results in
similar distinctive features in different categories of
images, which leads to inaccuracies of classification.
The type of the room could be determined more
precisely by finding specific objects in that room,
however, for a system based solely on the
distribution of distinctive features it is difficult to do.
The results of the research presented in this paper
could be used for researchers as well as practitioners
developing environment scene recognition systems
for blind and partially sighted people.
REFERENCES
Arthur, D., Vassilvitskii, S. 2007. K-Means: The
Advantages of Careful Seeding. Society for Industrial
and Applied Mathematics, pp. 1027-1035.
Bay, H., Tuytelaars, T., Van Gool, L. Surf: Speeded Up
Robust Features, Computer vision, ECCV 2006.
Springer, pp. 404-417. doi:
http://doi.org/10.1007/11744023_32
Bay, H., Ess, A., Tuytelaars, T., Van Gool, L. 2008.
Speeded-Up Robust Features (SURF). Comput. Vis.
Image Underst. 110, 3, (June 2008), pp. 346-359.
Chan, L.A., Der, S.Z., Nasrabadi, N.M. 2002. Image
Recognition and Classification. Marcel Dekker, Inc.
Csurka, G., Dance, C.R., Fan, L., Willamowski, J., Bray,
C., 2004. Visual Categorization with Bags of
Keypoints. Workshop on Statistical Learning in
Computer Vision, ECCV Prague, pp. 1-22.
Dobre, C., Mavromoustakis, C., Garcia, N., Goleva, R.,
George Mastorakis, G., 2016. Ambient Assisted Living
and Enhanced Living Environments: Principles,
Technologies and Control (1st ed.). Butterworth-
Heinemann, Newton, MA, USA.
Dutt, B.S.R., Agrawal, P., Nayak, S. 2009. Scene
Classification in Images.
www.eecs.berkeley.edu/~pulkitag/scene_report.pdf
Ezaki, N., Bulacu, M., Schomaker, L., 2004. Text
Detection from Natural Scene Images: Towards a
System for Visually Impaired Persons. In 17th
International Conference on Pattern Recognition, vol.
2, 683-686. doi: 10.1109/ICPR.2004.1334351
Fei-Fei, L., Perona, P., 2005. A Bayesian Hierarchical
Model for Learning Natural Scene Categories. In 2005
IEEE Computer Society Conference on Computer
Vision and Pattern Recognition, vol. 2, pp. 524-531.
doi: http://doi.org/10.1109/CVPR.2005.16
Gabryel, M., Capizzi, G. 2017. The Bag-of-Words Method
with Dictionary Analysis by Evolutionary Algorithm.
In 16th Int. Conference on Artificial Intelligence and
Soft Computing, ICAISC 2017, Part I. Lecture Notes in
Computer Science 10246, Springer, pp. 43-51.
Gabryel, M., Damasevicius, R. 2017. The Image
Classification with Different Types of Image Features.
In 16th Int. Conference on Artificial Intelligence and
Soft Computing, ICAISC 2017, Part I. Lecture Notes in
Computer Science 10245, pp. 497-506.
Lazebnik, S., Schmid, C., Ponce, J. 2006. Beyond Bags of
Features: Spatial Pyramid Matching for Recognizing

Natural Scene Categories. In 2006 IEEE Computer
Society Conference on Computer Vision and Pattern
Recognition, vol. 2, pp. 2169-2178. doi:
http://doi.org/10.1109/CVPR.2006.68
Lowe, D.G. 2004. Distinctive Image Features from Scale-
Invariant Keypoints. International Journal of
Computer Vision, vol. 60, no. 2. pp. 91-110. doi:
http://doi.org/10.1023/B:VISI.0000029664.99615.94
Lu, Z.-L., Dosher, B., 2013. Visual psychophysics: From
laboratory to theory. Cambridge, MA: MIT Press.
Mann, S., Huang, J., Janzen, R., Lo, R., Rampersad, V.,
Chen, A., Doha, T, 2011. Blind Navigation with a
Wearable Range Camera and Vibrotactile Helmet. In
19th ACM international conference on Multimedia,
pp. 1325-1328. doi: 10.1145/2072298.2072005
Matas, J., Chum, O., Urban, M., Pajdla, T. 2004. Robust
Wide-Baseline Stereo from Maximally Stable
Extremal Regions. Image and Vision Computing. vol.
22, no. 10. pp. 761-767. doi:
http://dx.doi.org/10.1016/j.imavis.2004.02.006
Muja, M., Lowe, D.G. 2009. Fast Approximate Nearest
Neighbors with Automatic Algorithm Configuration.
In VISAPP International Conference on Computer
Vision Theory and Applications, vol. 2. pp. 331-340.
Napoli, C., Pappalardo, G., Tramontana, E., Marszalek, Z.,
Polap, D., Wozniak, M. 2014. Simplified firefly
algorithm for 2D image key-points search. In 2014
IEEE Symposium on Computational Intelligence for
Human-like Intelligence, CIHLI 2014, pp. 118-125.
Oliva, A., Torralba, A. 2001. Modeling the Shape of the
Scene: A Holistic Representation of the Spatial
Envelope. 2001. International Journal of Computer
Vision, 42, 3, pp. 145-175. DOI:
https://doi.org/10.1023/A:1011139631724
Oliva, A., Torralba, A. 2011. Modeling the Shape of the
Scene: A Holistic Representation of the Spatial
Envelope. International Journal of Computer Vision,
vol. 42, no. 3. pp. 145-175. doi:
http://doi.org/10.1023/A:1011139631724
Oliva, A., Torralba, A., 2007. The Role of Context in
Object Recognition. Trends in Cognitive Sciences, vol.
11, no. 12. pp. 520-527. doi:
http://dx.doi.org/10.1016/j.tics.2007.09.009
Pascolini D., Mariotti, S.P., 2011. Global Estimates of
Visual Impairment: 2010. The British Journal of
Ophthalmology, vol. 96, no. 5, pp. 614-618. doi:
10.1136/bjophthalmol-2011-300539
Polap, D., Wozniak, M., Napoli, C., Tramontana, E.,
Damasevicius, R. 2015. Is the Colony of Ants Able to
Recognize Graphic Objects? In Information and
Software Technologies - 21st International
Conference, ICIST 2015, pp. 376-387.
Rosten, E., Drummond, T. 2006. Machine Learning for
High-Speed Corner Detection. In 9th European
conference on Computer Vision - Volume Part I
(ECCV'06), pp. 430-443. doi:
http://doi.org/10.1007/11744023_34
Vapnik, V. 1998. Statistical learning theory. New York:
Wiley.
Vogel, J., Schiele, B. 2004. A Semantic Typicality
Measure for Natural Scene Categorization. Pattern
Recognition, pp. 195-203. doi:
http://doi.org/10.1007/978-3-540-28649-3_24
Wozniak, M., Polap, D. 2014. Basic Concept of Cuckoo
Search Algorithm for 2D Images Processing with
Some Research Results - An Idea to Apply Cuckoo
Search Algorithm in 2D Images Key-points Search. In
11th International Conference on Signal Processing
and Multimedia Applications, SIGMAP 2014, pp. 157-
164.
Wozniak, M., Polap, D., Gabryel, M., Nowicki, R.K.,
Napoli, C., Tramontana, E. 2015. Can We Process 2D
Images Using Artificial Bee Colony? In Artificial
Intelligence and Soft Computing - 14th International
Conference, ICAISC (1) 2015, pp. 660-671.
