
Towards Rhythmicity Analysis of Text using Empirical Mode
Decomposition
Robertas Damaševičius
1
, Jurgita Kapočiūtė-Dzikienė
2
and Marcin Woźniak
3
1
Department of Software Engineering, Kaunas University of Technology, Kaunas, Lithuania
2
Faculty of Informatics, Vytautas Magnus University, Kaunas, Lithuania
3
Institute of Mathematics, Faculty of Applied Mathematics, Silesian University of Technology, Gliwice, Poland
Keywords: Text Mining, Text Phonology, Text Modes, Rhythm, Empirical Mode Decomposition.
Abstract: The rhythmicity characteristics of the written text is still an under-researched topic as opposed to the similar
research in the speech analysis domain. The paper presents a method for text deconstruction into text modes
using Empirical Mode Decomposition (EMD). First, the text is encoded into a numerical sequence using a
mapping table. Next, the resulting numerical sequence is decomposed into Intrinsic Mode Functions (IMFs)
using EMD. The resulting text modes provide a basis for further analysis of a text as well as specific
characteristics of the language of the text itself. The text modes are used further to derive the measures of
text complexity (cardinality) and rhythmicity (frequency) as well as the visual representations (scalograms,
convograms), which can provide important insights into the structure of the text itself. The application of
EMD to text analysis allows to decompose text into basic harmonics, which can be attributed to the
structural units of the text such as syllables, words, verses and stanzas. Higher order harmonics however can
be observed only in the rhymed types of the text such as poetry.
1 INTRODUCTION
The rhythmicity characteristics of the written text is
an under researched topic as opposed to the similar
research in speech analysis domain. Rhythm arises
as a reselt of letters, syllables or words, which are
perceived as similar. In speech, these elements are
syllables, or stressed syllables in particular.
Metrics for comparing the linguistic rhythm of
speech have been proposed previously such as the
proportion and standard deviationof vocalic and
consonantal intervals within (Ramus et al., 1999)
and pairwise variability indices (Grabe and Low,
2002), which reflect the specific phonological
characteristics of the text. Speech rhythm reflects the
phonological structure of a language (see, e.g.,
Roach, 1982; Dauer, 1987). For example, languages
that allow complex consonant clusters have a rhythm
with more variability in consonant length (Keane et
al., 2010).
Larger-scale structures such as meter and rhyme
are also important for cognitive processing of
language and influence the aesthetic and emotional
response of the subject (Obermeier et al., 2013).
Here, however, we analyse the rhytmicities of
written text rather than voiced text (speech).
The tune-text relationships have been researched
by Gussenhoven (2004) and Xu (2003). Xu (2003)
proposed three levels of timing relations: underlying
association of linguistically functional components
(consonants, vowels, lexical tones, pitch accents, etc.
combined into syllables), target synchronization
(coordination of phonetic targets, the smallest
articulated units associated with phonological
elements), and surface alignment (e.g., consonant
closure onset and release, vowel onset and offset,
etc.).
The potential applications of text rhythmicity
analysis may be the authorship analysis, i.e. the
statistical study of linguistic and computational
features of texts written by individuals
(Venckauskas et al., 2015). It involves analyzing the
writing styles or stylometric features from the
document content. Writing style is an unconscious
habit of a person, which varies from one author to
another in the way uses words, grammar and other
elements of a language to communicate. Writing
style can be identified using semantical information
extracted from the text features (Napoli et al., 2015).
Damasevicius R., Kapociute-Dzikiene J. and Wozniak M.
Towards Rhythmicity Analysis of Text using Empirical Mode Decomposition.
DOI: 10.5220/0006586803100317
In Proceedings of the 9th International Joint Conference on Knowledge Discovery, Knowledge Engineering and Knowledge Management (KDIR 2017), pages 310-317
ISBN: 978-989-758-271-4
Copyright
c
2017 by SCITEPRESS – Science and Technology Publications, Lda. All rights reserved

The rhythmical characteristics of a text alongside
with other stylometric features such as patterns of
word usage (e.g., lexical richness), composition and
writing, such as particular syntactic and structural
layout traits, patterns of vocabulary usage, unusual
language usage could be used for authorship
attribution (Kapociute et al., 2015) or profiling
(Kapociute et al., 2014).
In this paper, we analyze the rhythmicity (or
periodicity) characteristics of the written text. To
analyze rhythmicity characteristics we convert text
fragments into numerical sequences and use the
Empirical Mode Decomposition (EMD) (Huang et
al., 1998) method to deconstruct numerical
sequences into the empirical modes of frequency
(empiquencies), or in our case text modes, which
provide unique stylistics features of the text
message.
The remaining parts of the paper are as follows.
Section 2 discusses the related work on the numeri-
cal representation of text. Section 3 describes the
proposed method. Section 4 presents an illustrative
example in Lithuanian language. Finally, Section 5
presents conclusions and discusses future work.
2 RELATED WORK
The numerical processing of the text requires it to be
converted into a digital representation. Transforma-
tion of text messages to number series is not a
widely researched topic.
Traditionally, documents are represented as
feature vectors (e.g., in Vector space model (Salton
et al., 1975), word embeddings (Bengio et al., 2000),
word2wec (Mikolov et al., 2013), which do not
preserve the sequential information contained in the
text message. For example, common features such as
the number of words in a text document with some
specific linguistic property (e.g., ending in ‘-ing’)
will not change if the words in a text are randomly
permutated. Therefore, important stylistic and sub-
stylistic information in bag-of-words models is lost.
Other text features such as the frequency of n-grams
preserve only local sequential information, but still
do not allow reconstruction of the original text from
its n-gram frequencies.
Text fingerprinting using similarity preserving
hash functions have been used for plagiarism
detection. It involves generation of a unique
numerical representation of a document or a text
segment. Then, these representations are used in the
comparisons against a corpus of documents to find a
matching copy (Palkovskii et al., 2010).
Yang and Lee (2009) investigate if mapping
between text and time series data is feasible so the
the methods for time series analysis could be applied
for solving relevant data mining problems in text
and vice versa. They present the T3 (Text To Time
series) framework that is based on different
combinations of granularity (e.g., character or word
level) and n-grams (e.g., unigram or bigram). To
assign appropriate numeric values to each character,
the T3 method applies the space-filling curves (e.g.,
linear, Z orders, Hilbert), which are mostly based on
the keyboard layout.
Finally, one can assign fuzzy logic scores to texts
or parts thereof and apply fuzzy algebra to evaluate
the relations of text fragments with a specific
keyword or a tag (Damasevicius et al., 2016).
Text conversion to semi-numerical sequences
have been used in the phonetic coding algorithm,
called Soundex (Odell and Russel, 1922) in the
information retrieval task to match American
English names. Soundex converts each name into a
four-character code using a mapping scheme based
on the sound of each letter. The first letter of the
name is retained while each remaining letter in the
input word is assigned a numeric value.
There are extensions and adaptations of the
Soundex, such as Phonix (Gadd, 1999). While
Soundex only removes certain letters and duplicate
code characters, Phonix applies a much larger set of
rules to transform the name before it is mapped to a
set of codes. A number of variants of Soundex have
been proposed for non-English languages such as
SoundexPL (Kosmulski, 2005), LT-Soundex
(Paliulionis, 2009), Polyphon (Paramonov et al.,
2016), Arabic Soundex (Ousidhoum and Bensaou,
2013), D-M Soundex and its adaptation for texts in
Slavonic languages (Kawulak, 2009). Pinto et al.
(2012) present an adaptation of the Soundex
phonetic algorithm for representing SMS texts (or so
called textese language).
There has been several efforts in establishing the
taxonomy of rhythm-based units of the language
such as the prosodic hierarchy (McCarthy and
Prince, 1986), which includes the prosodic word,
foot, syllable, mora, phonome, and features.
The decomposition of a text into structurally
different text fragments and semantically different
text themes has been analyzed by Salton et al.
(1996).
In the context of analysis of text messages,
Empirical Mode Decomposition (EMD), as far as we
know, has not been used. The only known similar
application is the use of EMD for visual stylometry
in image recognition (Hughes et al., 2012).

3 METHOD
The proposed text decomposition method consists of
the following steps as explained as detailed below.
1) Text Pre-processing and Mapping to
Numerical Sequence
First, the text is pre-processed to remove all
punctuation symbols and other non-alphabetic
symbols such as digits.
Next, all remaining true letters of the language
are assigned the numerical codes as follows: vowels
are assigned 1, semivowels (glides or approximants)
are assigned 0, and consonants are assigned -1.
An example of the coding tables for English and
Lithuanian languages are presented in Tables 1 and
2, respectively. Lithuanian is one of Baltic
languages. It has a Latin-based alphabet with
additional letters with diacritics (in total, 32 letters).
Table 1: Coding table for English language.
Letter Numerical
code
A, E, I, O, U 1
Y,W 0
B, C, D, F, G, H, J, K, L, M, N, P,
Q, R, S, T, V, X, Z
-1
Table 2: Coding table for Lithuanian language.
Letter Numerical
code
A, Ą, E, Ę, Ė, I, Į, Y, O, U, Ų, Ū 1
V, J, L, M, N, R 0
B, C, Č, D, F, G, H, K, P, S, Š, T,
Z, Ž
-1
2) Empirical Mode Decomposition (EMD) of
a Numerical Sequence
Next, EMD (Huang, 1998) is applied to the
obtained numerical sequence. EMD is a signal
processing method based on local characteristics of
data in the time domain. EMD allows decomposing
a multicomponent signal consisting of many
composite signals with different frequencies into its
constituent mono-component signals, called Intrinsic
Mode Functions (IMFs).
The steps comprising the EMD method are as
follows:
1. Identify local maxima and minima of signal
()
St, where t is a sample number in the data
sequence.
2. Perform cubic spline interpolation between the
maxima and the minima to obtain the envelopes
()
max
Et and
()
min
Et.
3. Calculate the mean of the envelopes as:
() () ()
()
max min
/2Mt E t E t=+ .
4. Calculate
() () ()
1
Ct St Mt=− .
5. If the number of local extrema of
()
1
Ct, is
equal to or differs from the number of zero
crossings by one, and the average of
()
1
Ct is
close to zero, then
()
1
Ct
is an IMF
1
;
else repeat steps 1-4 on
()
1
Ct instead of
()
St,
until the new
()
1
Ct satisfies the conditions of
an IMF.
6. Compute the residue
() () ()
11
Rt St Ct=− .
7. If the residue
()
1
Rt
, is above a threshold value
of error tolerance, then repeat steps 1-6 on
()
1
Rt
to obtain the next IMF and a new residue.
As a result, n orthogonal IMFs are obtained from
which the original signal may be reconstructed as
follows:
() () ()
i
n
St IMF t Rt=+
(1)
here
()
Rt is the final residue.
The first IMF consists of the highest frequency
components present in the original signal. The next
IMFs contain progressively lower frequency
components of the signal, and the final residue
exhibits any general trends followed by the original
signal. Hereinafter, for further analysis, only three
first IMFs (modes) can be used.
3) Spectral analysis of IMFs using Short
Time Fourier Transform (TFTT)
Next, for each
()
i
I
MF t we calculate its Short
Time Fourier Transform (STFT) and a power
spectral density (PSD) estimate of each window as
follows. Given a signal
()
i
I
MF t
, the discrete STFT
for harmonic h at time n is defined as follows:

−
−=
k
kjwjw
STFT
hh
eknkxneX )().(),(
ν
(2)
where,
)(n
ν
is a suitably chosen window function
(e.g., a rectangular window) of size L and
2
, 0,1, 2, -1
h
h
whN
N
π
==
(3)
is the digital harmonic frequency in radian, and
N is the total number of harmonics.
The spectrogram of a signal scan be estimated by
computing the squared magnitude of the STFT of
the signal as follows:
() ()
2
,,spectrogram t STFT t
ωω
= (4)
4) Calculation of Scalograms
Next, we calculate scalograms (Fargues and
Brooks, 1995) as a squared multiplication of a STFT
with a real part of a Power Spectral Density (PSD)
matrix as follows:
() () ()
()
()
2
,STFT, ,scalogram t w t w real PSD t w=⋅ (5)
Scalograms are visual plots that represent the
percentage energy for each coefficient of STFT on a
time-scale dimension.
5) Calculation of Convograms
Convograms (Li and Nábělek, 1996) are
calculated as convolutions of different scalograms as
follows:
11
00
(, ) ( , ) ( , )
NN
ij ij
xy
gi j f x y hx y
−−
==
=
(6)
As a result of steps 4 and 5 we can obtain 3
scalograms for each of 3 modes and 3 convograms
for each combination of modes (1-2, 2-3, and 1-3).
6) Feature Dimensionality Reduction using
Principal Component Analysis (PCA)
To reduce feature dimensionality of the
scalogram and convogram images, Principal
component analysis (PCA) (Pearson, 1901) may be
applied. PCA is a statistical method that transforms a
set of observations of original variables into a set of
values of linearly uncorrelated variables called
principal components. The number of principal
components is less than or equal to the number of
original variables. The first principal component has
the largest possible variance.
4 EVALUATION OF TEXT
RHYTHMICITY
How can you quantify the rhythm of the written
text? A number of metrics have been proposed for
the quantification of the rhythm text.
The Pairwise Variability Index (PVI) (Grabe and
Low, 2002) is perhaps the best known one. PVI is a
metric used for quantifying speech rhythm. It
measures the average variability of duration from
one speech unit to the next. It has been used to
express the durational patterning of successive
vowels or successive intervocalic (consonantal)
intervals, showing how each linguistic event differs
from the next (Grabe and Low, 2002). The metric
was used, e.g., to compare English and Estonian
languages (Asu and Nolan, 2006).
The normalised Pairwise Variability Index
(nPVI) is the mean of the differences between
successive intervals divided by the sum of the same
intervals. It was used for measuring the rhythmic
differences between languages based on vowel
length (Grabe and Low, 2002),
The raw Pairwise Variability Index (rPVI) is the
mean of the differences between successive intervals
(Grabe and Low, 2002).
Other measures were proposed by Keane et al.
(2010), i.e., the mean number of consonants between
vowels, and the mean number of vowels between
consonants.
Other well-known metrics include %V – the
proportion of vocalic intervals, ΔV and ΔC – the
standard deviation of the duration of vocalic and
consonantal intervals respectively (Ramus et al.,
1999), and VarcoV/VarcoC: standard deviation of
vocalic/consonantal interval duration divided by
mean vocalic/consonantal duration (Dellwo, 2006).
A survey of different rhythm metrics can be found in
(Mairano and Romano, 2011).
Here, however, we propose metrics derived from
the numerical representations of the text using
EMD’s IMFs as the input as follows:
Dominating frequency – the frequency of the
IMF with the largest energy, where energy is
calculated as the sum of squares of the amplitude
values of the signal.
2
1
N
i
i
Ex
=
=
(7)
Cardinality – the number of IMFs’ derived from
the numerical representation of the text fragment.
Cardinality represents the complexity of the
structural component hierarchy of the text.
5 ILLUSTRATIVE EXAMPLE
As an illustrative example we analyse a line from the
classical Lithuanian poem The Seasons (“Metai”, in
Lithuanian) written by Kristijonas Donelaitis around
1765–1775.
The original text fragment is given below:
Jau saulelė vėl atkopdama
budino svietą
Ir žiemos šaltos trūsus
pargriaudama juokės.
The Lithuanian language has 32 letters, of which
12 are vowels, 6 are semivowels and 14 are
consonants.
The above given poetry line contains 14 words
(all unique and occurring only once), 86 characters
(73 without spaces) and 27 syllables. The average
word length is 1.93 syllables (6.14 letters), and the
average syllable length is 3.18 letters. This short
fragment was chosen deliberately as it is shorter than
140 characters that can be sent over Twitter.
1) Pre-processing and Transformation into
Numerical Representation
The string is pre-processed to remove all white
characters and delimiters, and uppercase letters are
replaced with lowercase letters. The resulting text
string is converted into the numerical representation
using the proposed scheme (see Table 2) (1 –
vowels, 0 – semivowels, -1 – consonants). The result
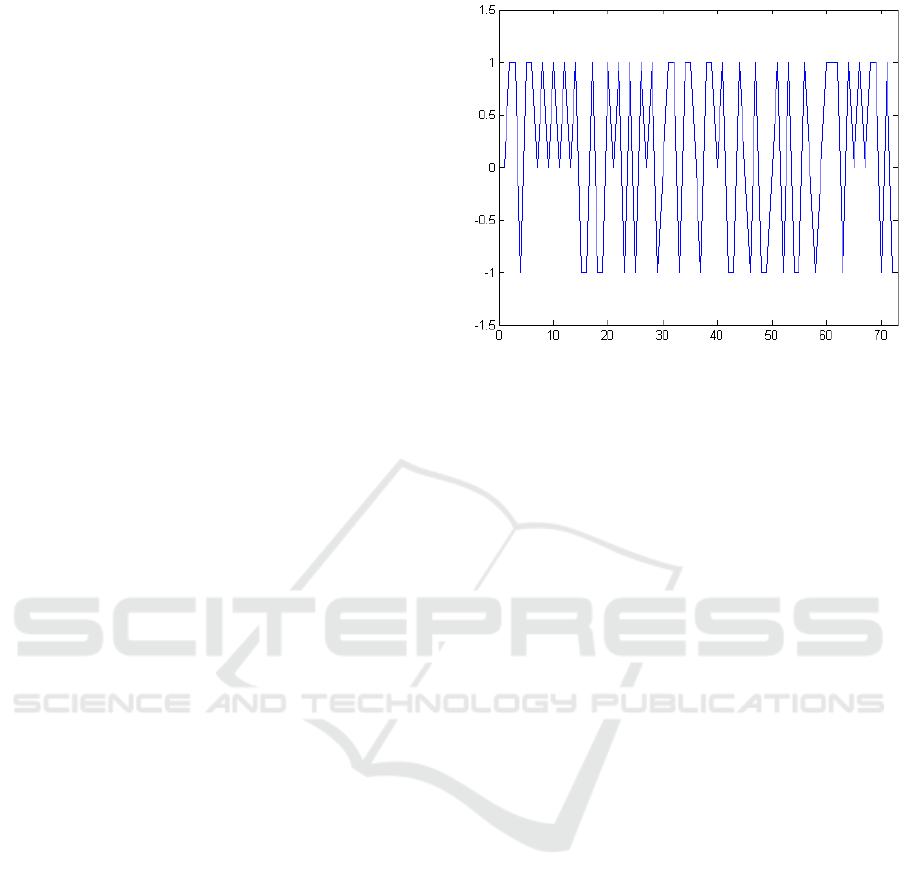
is a binary numerical sequence as follows:
0 1 1 -1 1 1 0 1 0 1 0 1 0 1 -1 -1 1 -1 -1 1
0 1 -1 1 -1 1 0 1 -1 0 1 1 -1 1 1 0 -1 1 1 0
1 -1 -1 1 0 -1 1 -1 -1 0 1 -1 1 -1 -1 1 0 -1
0 1 1 1 -1 1 0 1 0 1 1 -1 1 -1
The same numerical sequence is depicted
graphically in Figure 1.
2) Decomposition using EMD
Next, we perform decomposition of a numerical
sequence as a time series into Intrinsic Mode
Functions (IMFs) or text modes using the EMD
method. The result of decomposition is presented in
Figure 2.
Figure 1: Numerical representation of the analysed string.
The series has been decomposed into four IMFs
and a residue. Therefore, the cardinality of the
analysed text fragment is equal to 4. IMF
1
has the
largest amplitude. The frequency of IMF
1
calculated
using the zero-crossing method is f
-1
=2.76, and the
frequency of IMF
2
is f
-1
=7.44, and the frequency of
IMF
3
is f
-1
=14.04. These values are close to the
average length of syllables and words in Lithuanian
language (1.93 and 6.14 letters, respectively).
The periodicity of IMF
3
corresponds to a
metrical line of verses K. Donelaitis used – the
classical hexameter consisting of six feet, separated
by caesurae, a complete pause in a line of poetry.
The foot is the basic metrical unit that forms part of
a line of verse. The unit is composed of syllables,
the number of which is limited.
In our example, first five feet consist of a single
syllable, while the last one has two syllables.
Therefore, the average length of the verse is 7
syllables, i.e., 13.51 letters, a value close to
periodicity of IMF
3
.
The periodicity of IMF
4
(f
-1
= 28.24) corresponds
to the length of the stanza, which in case of
hexameter is equal to 2 verses (27 letters). A stanza
is a grouped set of lines within a poem, which can
have a regular rhyme.
Note that in this example IMF
1
is responsible for
92 % of variance in a numerical sequence, while
IMF
2
– for 4 %, and IMF
3
– for 2.6 %, and IMF
4
–
only for 0.7 %. Therefore, for this kind of short
texts, of text modes above 3 could be ignored.
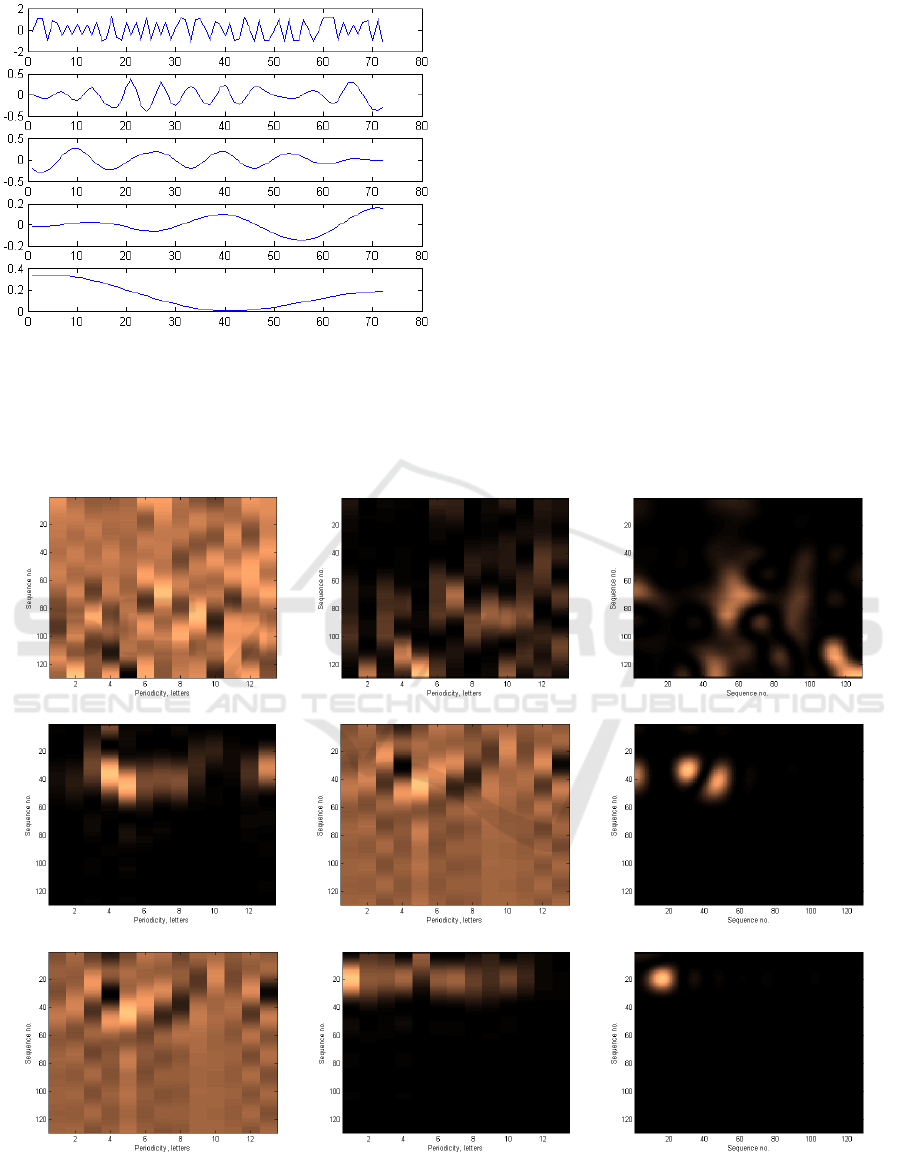
Figure 2: IMFs of analysed text (from top to bottom:
IMF
1
, IMF
2
, IMF
3
, IMF
4
, and residue).
3) Calculation of Scalogram
For IMFs 1-3 we calculate PSD using STFT with
a rectangular filter and 128 sampling point. Having
PSD, the numerical sequence can be represented
visually as a spectrogram or a periodogram. A
spectrogram is a visual representation of the
frequency spectrum of a time-varying signal while a
periodogram is an estimate of the spectral density of
a signal, which describes how the variance of the
data is distributed over the frequency components of
the data. Having spectrograms and periodograms
calculated, we compute scalograms as multiplication
of the periodogram matrix with a real part of the
spectrogram matrix as in Eq. 5. The obtained
scalogram allows to reveal the intrinsic periodicity
of a series. The results are presented as spectrograms
in Figure 3. Note that sequence no. is used instead of
time here, because numerical representations of text
are not time series, and periodicity is used instead of
frequency.
Figure 3: Spectrograms (left), periodograms (center) and scalograms (right) of IMF
1
, IMF
2
and IMF
3
.
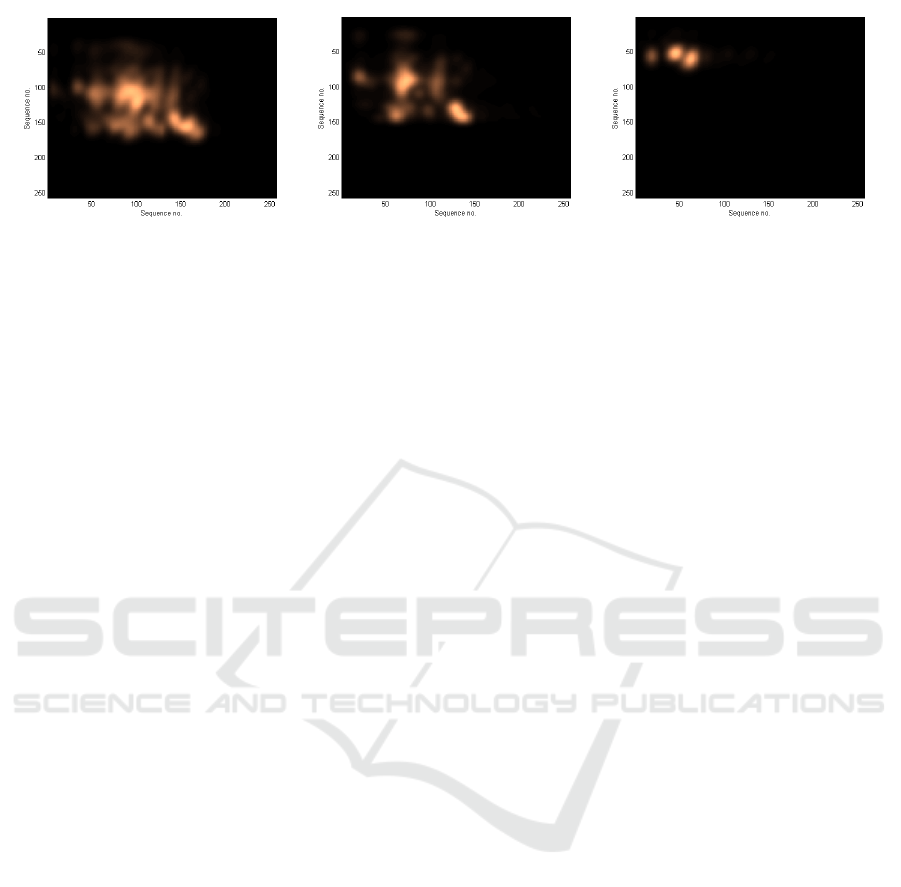
Figure 4: Convograms of IMF
1
-IMF
2
, IMF
1
-IMF
3
, and IMF
2
-IMF
3
.
1) Calculation of Convograms
To reveal the relationship between different
IMFs, convograms are calculated as convolutions of
the scalogram matrices of the respective IMFs. The
results are presented in Figure 4.
Note that the overlap of periodicities between
IMF
1
and IMF
2
is the largest.
Convograms and scalograms contain information
that describe the stylometric features of the analysed
text and specifically may reveal any periodicities or
rhythmicities at different scales present in the text.
The obtained convograms can be analysed either
manually by an expert in digital signal analysis or
further analysed using PCA or other feature
dimensionality reduction method, which is however,
has not been applied in this paper.
6 CONCLUSIONS
The spoken languages have their own specific
patterns of durational variation (or “rhythm”)
(Loukina et al., 2011). In this paper, we claim that it
is also valid for the written texts of languages, too.
The application of Empirical Mode Decomposi-
tion (EMD) to text analysis allows to decompose
text into basic text harmonics or modes: syllables,
words, verses and stanzas. Higher order harmonics
however can be observed only in the rhymed types
of text. While more extensive research and analysis
is still needed, the proposed method still can identify
the frequency characteristics of the short texts,
which match well with statistically established
characteristics of the considered language. Of
course, one should note the limitations of the
approach: the result depends upon the select method
of mapping from a sequence of text letters to a
numerical sequence. The presented approach to map
letters according to their spoken sound category
(vowel, semivowel, consonant) may not be the best
one or the only one possible. The use of other text-
to-sequence mapping methods and how it allows to
reveal the rhythmicity of the text is a subject of
further research.
In future work, we also intend to use the text
modes for authorship identification and for language
comparison.
REFERENCES
Asu, E.L., Nolan, F., 2006. Estonian and English rhythm:
a two-dimensional quantification based on syllables
and feet. In Proceedings of Speech Prosody, 249-252.
Bengio, Y., Ducharme, R., Vincent, P. 2000. A neural
probabilistic language model. In NIPS, 932- 938.
Damasevicius, R., Valys, R., Wozniak, M., 2016.
Intelligent tagging of online texts using fuzzy logic. In
2016 IEEE Symposium Series on Computational
Intelligence, SSCI 2016, 1-8.
Dauer R. 1987. Phonetic and phonological components of
language rhythm. In 11th International Congress of
Phonetic Sciences, 447–450.
Dellwo, V. 2006. Rhythm and speech rate: a variation
coefficient for deltaC. In Karnowski P. & Szigeti, I.
(ed.) Language and language processing. Frankfurt
am Main: Peter Lang, 231-241.
Fargues, M.P., Brooks, W.A., 1995. Comparative study of
time-frequency and time-scale transforms for ultra-
wideband radar transient signal detection. In IEE
Proceedings - Radar, Sonar and Navigation, vol. 142,
no. 5, 236-242. doi: 10.1049/ip-rsn:19952075
Gadd, T.N., 1990. PHOENIX: the algorithm. Program:
Automated Library and Information Systems, 24, 4,
363-369. DOI=http://dx.doi.org/10.1108/eb047069
Grabe, E., Low, E. L. 2002. Durational variability in
speech and the rhythm class hypothesis. Papers in
laboratory phonology, 7, 515-546.
Gussenhoven, C., 2003. On Tune-Text relations. In 15th
International Congress of Phonetic Sciences, vol. 1,
241-244.
Huang, N., Shen, Z., Long, S., 1998. The empirical mode
decomposition and the Hilbert spectrum for nonlinear
and non-stationary time series analysis. Proceedings of
the Royal Society. A, 454, 903-995.
Hughes, J.M., Mao, D., Rockmore, D.N., Wang, Y., Wu,

Q., 2012. Empirical Mode Decomposition Analysis for
Visual Stylometry. IEEE Transactions on pattern
analysis and machine intelligence, 34, 11, 2147-2157.
Kapociute-Dzikiene, J., Sarkute, L., Utka, A. 2014.
Automatic Author Profiling of Lithuanian
Parliamentary Speeches: Exploring the Influence of
Features and Dataset Sizes. In Sixth International
Conference Human Language Technologies - The
Baltic Perspective, Baltic HLT, Frontiers in Artificial
Intelligence and Applications 268, IOS Press, 99-106
Kapociute-Dzikiene, J., Utka, A., Sarkute, L. 2015.
Authorship Attribution of Internet Comments with
Thousand Candidate Authors. In 21st International
Conference, Information and Software Technologies,
ICIST 2015. Communications in Computer and
Information Science 538, 433-448.
Kawulak, R., 2009. Determination of Similarity of
Slavonic Languages Using D-M Soundex Algorithm.
Journal of Applied Computer Science, 17, 2, 71–82.
Keane, E., Loukina, A., Kochanski, G., Rosner, B., Shih,
C., 2010. How far can phonological properties explain
rhythm measures? In 2010 Colloquium of the British
Association of Academic Phoneticians (BAAP 2010),
28-31 March 2010, London, UK.
Kosmulski, M. 2005. Reprezentacja dokumentów
tekstowych w modelu przestrzeni wektorowej. MSc
thesis, Politechnika Warszawska, Warszawa, Poland.
Li, X.-Q., Nábělek, J., 1996. Detecting slow, long-duration
slip of large earthquakes using very long-period orbital
surface waves. Geophysical Journal International,
124(2), 483-501.
Loukina, A., Kochanski, G., Rosner, B., Keane, E., Shih,
C., 2011. Rhythm measures and dimensions of
durational variation in speech. Journal of the
Acoustical Society of America, 129(5), 3258-70.
Mairano, P., Romano, A., 2011. Rhythm Metrics for 21
Languages. In International Congress of Phonetic
Sciences, 1318-1321.
McCarthy, J., Prince, A. 1986. Prosodic morphology
(RuCCS Technical Report Series TR-3). Rutgers
University.
Mikolov, T., Chen, K., Corrado, G., Dean, J. 2013.
Efficient Estimation of Word Representations in
Vector Space. In Workshop at ICLR.
Napoli, C., Tramontana, E., Sciuto, G. L., Wozniak, M.,
Damasevicius R., Borowik, G. 2015. Authorship
Semantical Identification Using Holomorphic
Chebyshev Projectors. In Asia-Pacific Conference on
Computer Aided System Engineering, APCASE 2015,
232-237.
Obermeier, C., Menninghaus, W., von Koppenfels, M.,
Raettig, T., Schmidt-Kassow, M., Otterbein, S., Kotz,
S.A. 2013. Aesthetic and Emotional Effects of Meter
and Rhyme in Poetry. Frontiers in Psychology, 4, 10.
http://doi.org/10.3389/fpsyg.2013.00010
Odell, M.K., Russell, R.C., 1922. U.S. Patent Numbers
1261167 (1918) and 1435663 (1922). Washington,
D.C.: U.S. Patent Office.
Ousidhoum, N.D., Bensaou, N., 2013. Towards the
Refinement of the Arabic Soundex. In 18th
International Conference on Natural Language
Processing and Information Systems - Applications of
Natural Language to Information Systems, NLDB
2013. Lecture Notes in Computer Science 7934,
Springer, 309-314.
Paliulionis, V. 2009. Lithuanian address geocoding:
problems and solutions. Informacijos mokslai, 50,
217-222.
Palkovskii, Y., Belov, A., Muzika, I., 2010. Exploring
Fingerprinting as External Plagiarism Detection
Method - Lab Report for PAN at CLEF 2010. CLEF
(Notebook Papers/LABs/Workshops).
Paramonov, V.V., Shigarov, A.O., Ruzhnikov, G.M.,
Belykh P.V., 2016. Polyphon: An Algorithm for
Phonetic String Matching in Russian Language. In
22nd International Conference, Information and
Software Technologies, ICIST 2016. Communications
in Computer and Information Science 639, 568-579.
Pearson, K., 1901. On lines and planes of closest fit to
systems of points in space. Philosophical Magazine,
2(6), 559–572.
Pinto, D, Ayala, D.V., Alemán, Y., Gómez-Adorno, H.,
Loya, N., Jiménez-Salazar, H., 2012. The Soundex
Phonetic Algorithm Revisited for SMS Text
Representation. In 15th International Conference on
Text, Speech and Dialogue, TSD 2012. Lecture Notes
in Computer Science 7499, Springer, 47-55.
Ramus, F., Nespor, M., Mehler, J. 1999. Correlates of
linguistic rhythm in the speech signal. Cognition
73(3), 1-28.
Roach P. 1982. On the distinction between ‘stress-timed’
and ‘syllable-timed’ languages, in Crystal D. (eds.),
Linguistic Controversies. Edward Arnold, 73–79.
Salton, G., Singhal, A., Buckley, C., Mitra, M. 1996.
Automatic text decomposition using text segments and
text themes. In 7th ACM conference on Hypertext
(HYPERTEXT '96). ACM, 53-65.
Salton, G., Wong, A., Yang C.S. 1975. A Vector Space
Model for Automatic Indexing. Communications of
the ACM, 18 (11), 613–620.
Venckauskas, A., Damasevicius, R., Marcinkevicius, R.,
Karpavicius, A. 2015. Problems of Authorship
Identification of the National Language Electronic
Discourse. In 21st International Conference,
Information and Software Technologies, ICIST 2015.
Communications in Computer and Information
Science 538, Springer, 415-432.
Xu, Y. 2003. Three levels of tune-text relations. In 15th
International Congress of Phonetic Sciences,
Barcelona. August, 257-260.
Yang, T., Lee, D., 2009. T3: On Mapping Text To Time
Series. In 3rd Alberto Mendelzon International
Workshop on Foundations of Data Management,
Arequipa, Peru, May 12-15, 2009. CEUR Workshop
Proceedings 450, CEUR-WS.org 2009, AMW 2009.
