
Ambient Intelligent Systems
The Role of Non-Intrusive Approaches
Paulo Novais
1
, Davide Carneiro
1,2
, Filipe Gonçalves
2
and José Miguel Pêgo
3,4
1
Algorimti Centre/Department of Informatics, University of Minho, Braga, Portugal
2
CIICESI, ESTG,Polytechnic Institute of Porto, Felgueiras, Portugal
3
Life and Health Sciences Research Institute (ICVS), School of Medicine, University of Minho, Braga, Portugal
4
ICVS/3B’s - PT Government Associate Laboratory, Braga/Guimarães, Portugal
Keywords:
Ambient Intelligence, Human-Computer Interaction, Stress Detection, Emotion Classification.
Abstract:
There is currently a significant interest in consumer electronics in applications and devices that monitor and
improve the user’s well-being. This is one of the key aspects in the development of ambient intelligence
systems. Nonetheless, existing approaches are generally based on physiological sensors, which are intrusive
and cannot be realistically used, especially in ambient intelligence in which the transparency, pervasiveness
and sensitivity are paramount. We put forward a new approach to the problem in which user behavioral cues
are used as an input to assess inner state. This innovative approach has been validated by research in the last
years and has characteristics that may enable the development of true unobtrusive, pervasive and sensitive
ambient intelligent systems.
1 INTRODUCTION
Ambient Intelligence, as many other terms that fall
under the Artificial Intelligence umbrella, are nowa-
days more or less well-known in the society, as well
as its technological potential (Carneiro et al., 2008;
Costa et al., 2007; Carneiro and Novais, 2014; Ana-
cleto et al., 2014; Carneiro et al., 2008). At the time
of the coining of the term, in 1998, it was viewed
as a significant change in consumer electronics, from
a paradigm in which interesting features were scat-
tered and fragmented in independent devices, towards
a new reality in which these features would be readily
available, in the form of services, regardless of device
or location.
Several characteristics or traits are necessary to
implement this new vision, summarized by (Cook
et al., 2009): sensitivity, responsiveness, adaptive-
ness, transparency, ubiquity, and intelligence. Some
of these characteristics depend on technological evo-
lution. For instance, ubiquity and transparency de-
pend on advances in pervasive computing. Intelli-
gence depends, mostly, on contributions of certain
fields of Artificial Intelligence. If the question is now
on what the sensitivity characteristic depends, the log-
ical answer is that it depends on advances in sensors
and sensor networks.
To some extent, this answer is correct. However,
if that is the whole answer, we are clearly reducing
the problem. In fact, evolution in this aspect is not
only dependent on smaller, cheaper or more reliable
or connected sensors. Moreover, one should not only
consider the so-called hard sensors (traditional sen-
sors, in the physical sense, made of specifically de-
signed hardware). Evolution may also come from the
so-called soft sensors: virtual (software-based) sen-
sors, especially useful in data fusion, where measure-
ments of different characteristics and dynamics are
combined.
In fact, from a human-centered perspective, sen-
sitivity may involve aspects as complex and diverse
as our level of stress, our level of fatigue, our state
of arousal or our emotional state, just to name a few.
All this information is very important for an AmI sys-
tem, especially one that is sensitive, responsive and
adaptive. And, there are nowadays approaches to ac-
quire this information. These approaches, which we
deem as "traditional" are based on physiological sen-
sors (e.g. electrodermal activity, heart rate, respira-
tory rate, electroencephalography) and are very accu-
rate. They are, however, and most of the times, im-
practicable. Especially because they cannot be realis-
tically used to acquire the necessary information: no
users will walk around continuously connected to a
Novais P., Carneiro D., GonÃ
˘
galves F. and PÃłgo J.
Ambient Intelligent Systems: The Role of Non-Intrusive and Sensitive Approaches.
DOI: 10.5220/0006810900010001
In Proceedings of the 9th International Joint Conference on Computational Intelligence (IJCCI 2017), pages 11-17
ISBN: 978-989-758-274-5
Copyright
c
2017 by SCITEPRESS – Science and Technology Publications, Lda. All rights reserved

number of sensors so as to have an application that
can monitor their state during the day.
On the other hand, questionnaires have also been
frequently used to assess people’s state, mostly by
psychology. There are many such instruments, val-
idated and with many practical uses. However, one
again, these are not suitable for implementing an AmI
system.
In this paper we argue that the path to overcome
this challenge may be a new approach based on be-
havioral biometrics: one that is non-intrusive, fully
integrates the main characteristics of AmI. Specifi-
cally, we propose a technological framework that is
able to capture, store and process large amounts of
data about users of intelligent environments, and that
uses this data to produce high-level features describ-
ing their behavior(Novais and Carneiro, 2016). This
high-level information, when contextualized, can lead
to very interesting insights into the individuals’ deci-
sions and actions. In Section 2 we describe this ap-
proach in more detail. In Section 3 we detail the tech-
nological framework that makes it possible. Finally,
in Section 4 we describe three real-life scenarios in
which this approach is currently being used, to study
different aspects of Human behavior.
2 A NEW APPROACH
In the last years, we have been working on a differ-
ent approach on data acquisition that we expect may
support the development of real AmI systems, in the
sense that they can simultaneously be sensitive and
transparent. That is, AmI systems in which the user is
constantly being monitored but in a way that is com-
pletely non-intrusive and transparent. Ultimately, the
user forgets about the monitoring and notices only the
environment’s contextualized actions.
This new view on the problem is based on Behav-
ioral Analysis (Turaga et al., 2008). Here, everything
the user does (e.g. interactions with devices, move-
ment patterns, interactions with other users) can be
used as a potential input. Moreover, one can consider
not only what the user does but how the user does it.
In fact, our behaviors are commonly associated
with our inner states. We look at someone who is rest-
less, biting the nails or fiddling and we instantly know
that the person is nervous or stressed. The fact is
that, in an interaction, our behaviors often give away
more information than the words we use. And we,
as humans, have evolved to collect this information
to, even in an unconscious way, better understand the
state of the other individual. This information is actu-
ally paramount for the efficiency of the communica-
tion process (Dennis and Kinney, 1998).
The challenge thus lies in developing ways to ac-
quire this information and use it as a way to perceive
the user’s inner state. As will be detailed in Section 4,
many of our behaviors can be used as input to classify
our state. Namely, the way we type in a keyboard, the
way we move the mouse or the way we hold or touch
our smartphone. While one of these features may not
be enough to accurately describe the user’s state, their
combined used may constitute a reliable source of in-
formation.
The main advantage of this approach is, undoubt-
edly, that it can be used continuously throughout the
day, without interfering with the users’ routines. It is
transparent, non-intrusive and pervasive. It allows for
behavioral models to be trained in short time frames
that allow to know one’s frequent behaviors when in
neutral states as well as in specific states. These mod-
els can be dependent on many variables (that can also
be acquired by the environment) including geograph-
ical, social or historic context.
There is a significant opportunity in the devel-
opment of methods for the acquisition of behavioral
data. First of all, there is the possibility of learning
how we behave as individuals and as a group in cer-
tain situations and in certain states. From a crowd-
sourcing point of view, it could be used to measure
the state of the society at different levels or granular-
ity. For example, it could be used to monitor in which
parts of a city people are more stressed (e.g. a specific
neighborhood) in order to improve it. It could also be
used to track changes in people’s states over long peri-
ods of time. Similar initiatives could be implemented
at a personal level (e.g. personal monitoring applica-
tions) or at an organizational level (e.g. tracking the
fatigue of employees) as we are currently doing.
This knowledge, by itself, can be very important
to understand ourselves and each other. However, true
opportunities lay in what we can do with this infor-
mation. In a few words, the opportunity in these new
approaches is, in our opinion, the opportunity to im-
plement true AmI systems, in the sense that there are
no visible sensors, no wires, no hardware, no intru-
sion. True also in the sense that they cab be always
on, always monitoring, always acting accordingly.
3 TECHNOLOGICAL
FRAMEWORK
The approach described in Section 2 is made possible
through the integration of several technologies, that
can be organized in four logical layers, depicted in
Figure 1.
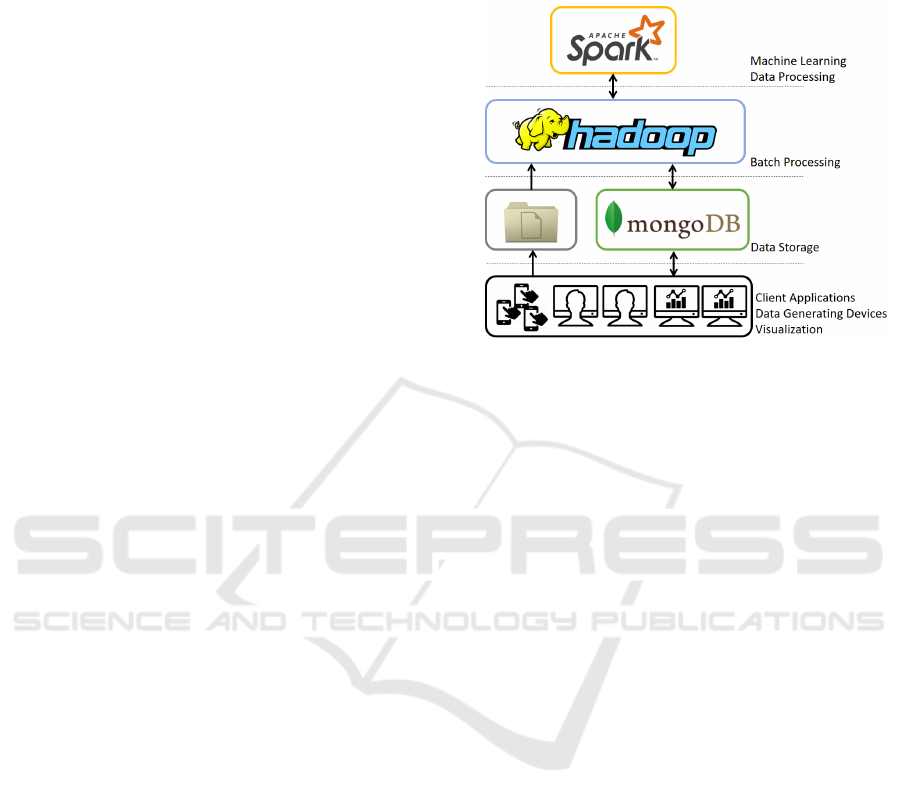
The bottom-most layer comprises the Client ap-
plications. These include data-generating devices and
visualization applications. Visualization applications
provide graphical tools to interpret the collected data,
facilitating its analysis and interpretation. Data gen-
erating devices, on the other hand, are the devices that
the users interact with and that generate relevant data.
These include personal computers, smartphones and
tablets, depending on the type of data being collected
and the purpose of the intervention, as described in
Section 4. Moreover, two different types of data are
collected: Behavioral Data and Operational Data. Be-
havioral Data describes the behavior of the user while
interacting with the device. This includes events that
describe the interaction with the peripherals or with
the screen, that is later used to compute interaction
the features. On the other hand, Operational Data de-
scribe events specific to the task that the user is carry-
ing out. Depending on the context, this can include a
student answering a question in an exam (as detailed
in Section 4.1) or a worker switching focus to a differ-
ent application (Section 4.2). These two types of data,
when collected together, allow for interesting insights
into the individuals’ state, describing in a rich manner
the context of the decisions or the behavior.
The second layer is dedicated to the storage of the
raw data collected as well as of the processed data.
Raw data can be stored both in files or in a database,
depending on its source: there are data generating de-
vices that write directly in the database while oth-
ers, due to some constraints, produce files that are
then uploaded into the system. Processed data re-
sults from the processing and transformation of the
raw data into behavioral and operation features (car-
ried out in the upper layer) such as Mouse Velocity,
Writing Rhythm, Key Latency or Touch Intensity, as
detailed in (Carneiro and Novais, 2017).
The third layer is responsible for the processing
of the raw data and its transformation into meaning-
ful features. This layer takes as input the raw data
(operational and behavioral) describing the interac-
tion events of the users with the devices and produces
high-level features that allow to interpret the users’
actions throughout time.
Finally, the topmost layer is responsible for the
processing of the high level features (generated in the
lower layer). To this end, statistic and machine learn-
ing techniques are used. This layer provides insights
into the data that would otherwise be impossible (e.g.
how does a stressed student behave during an online
exam?; how does an individual’s performance vary
during a workday). These insights point out poten-
tially interesting paths that are then investigated fur-
ther, namely through machine learning techniques, al-
lowing the training of models that can be used in real
time to classify human behavior, as described in Sec-
tion 4.
Figure 1: Four mains layers of the technological framework
that supports this approach.
4 PRACTICAL APPLICATIONS
4.1 Student Long-term Monitoring
In the last years, this approach has been used to mon-
itor students throughout the academic year. Data is
collected from the students’ interaction with their per-
sonal or institutional computers over the academic
year and in specific moments such as high-stakes
computer-based exams. This allows to characterize
their baseline behavior as well as their behavior in
scenarios such as specific classes or high-stakes ex-
ams. In this research line we have been specifically
studying student attention and stress.
Attention is measured based on the student’s use
of the computer: the activity level and the applica-
tions used (Durães et al., 2017). The computation of
the activity level is based on the interaction features
mentioned in Section 3, namely on mouse velocity,
number of clicks and typing rhythm. The other im-
portant aspect for computing attention is the applica-
tion that the student is interacting with, at any given
moment.
To this end the teacher, who is also the end-user of
this system, indicates the group of applications that
are included in each class. This information is then
transformed into a list of regular expressions that are
used to filter the applications used by the students as
belonging or not to the class. The system thus mea-
sures the percentage of time spent by each student in
class-related applications and, together with the level
of activity during those periods, computes the level of

attention. This information is provided to the teacher
in real-time, enabling real-time decisions on how to
steer the class or on which students to focus, if neces-
sary.
Specifically, the teacher can see information by
class, by student or group of students and over differ-
ent periods of time. All this information may be very
valuable for the teacher to improve teaching method-
ologies, class content and, in the overall, student’s re-
sults.
This same approach is also being used to mon-
itor the effect of stress on Human-Computer Interac-
tion(Carneiro et al., 2015). Specifically, in the context
of the EUSTRESS project
1
, the goal is to find a rela-
tionship between interaction features and stress mark-
ers, so that a non-intrusive stress classification tool
can be developed for this specific domain. Such a tool
will point out those students that have poorer stress
coping skills, eventually allowing for the teacher or
the institution to provide these students with guided
or personalized training in this regard.
It has been long established that there is a relation-
ship between Human performance and stress(Driskell
and Salas, 2013), although this relationship depends
on the individual’s characteristics and state, the con-
text, among other factors. In this line of research we
combine variables that describe the student’s inter-
action performance with the computer, exam results
and exam behavior (e.g. doubts, correct decisions,
flagged questions) in order to characterize each stu-
dent in each exam and provide valuable information
for the teacher.
Figure 2 depicts the evolution the values of 9 inter-
action features for a specific student in an high-stakes
exam. It clearly shows how the performance of this
student continuously improves throughout the exam,
through a constant decrease in variables such as Time
Between Clicks (which denotes the time between de-
cisions), Click Duration (denoting faster clicks) or
a more efficient movement of the mouse (evidenced
through features such as Avg. Dist. pointer to line or
Avg. Excess of Dist. Between Clicks). In this spe-
cific case, there is an evident performance improve-
ment throughout the exam. However, not all students
behave like this and not all students behave the same
throughout their term or their course. In that sense,
this kind of information may be very useful not only
for the teacher or the institution to better know their
students, but also to allow them to intervene in more
efficient ways regarding stress coping strategies.
1
The website of EUSTRESS is available at
http://www.eustress.pt/
4.2 Performance Monitoring
The relationship between fatigue (e.g. mental, phys-
ical) and human performance has also been studied
thoroughly in the past decades(Goel et al., 2013). In
that sense, the proposed approach has been used to
contribute to this study, namely to assess the relation-
ship between interaction performance and fatigue.
To this end, a specific application was developed
that continuously monitors a computer user’s interac-
tion patterns throughout the workday. The environ-
ment described in Section 3 builds a model of each
user’s interaction patterns, which may include user’s
input quantifying fatigue in different moments of the
day. Fatigue is quantified using the USAFSAM 7
point fatigue scale. This model shapes the relation-
ship of interaction performance with mental fatigue,
allowing the classification and monitoring of the lat-
ter, in real-time. Figure 3 shows the typical behavior
of two interaction features under different levels of fa-
tigue: mouse acceleration tends to decrease when fa-
tigue increases (indicating a slower movement of the
mouse) while keystroke latency tends to increase (in-
dicating a slowing typing in the keyboard).
This resulted in the development of an application
for real-time fatigue management, that can be used
either by single individuals or by team managers. It
reveals each individual’s current state as well as each
one’s daily rhythms and best/worst moments. Over
time, it allows a better management of the workforce
based on these insights.
4.3 Emotion Perception
On a slightly different field of application, this ap-
proach has been also applied to improve auditory and
visual emotion perception studies. Auditory emotion
recognition refers precisely to the ability of a listener
to infer emotion from sounds in the environment, in-
cluding the voice. Visual emotion perception, on he
other hand, refers to the ability to recognize emotions
in visual stimuli such as photos.
When studying emotion recognition (visual or au-
ditory), the standard perception paradigm is to have
listeners choose which one of several emotion words
best characterizes pictures or linguistically neutral ut-
terances (or nonverbal vocalizations) made by actors
attempting to portray various emotions (Bachorowski,
1999; Lima et al., 2013). In addition, listeners may be
asked to classify stimuli in several dimensions, such
as its valence (a continuum ranging from ’unpleas-
ant’ to ’pleasant’), arousal (from ’calm’ to ’arous-
ing’), and dominance (from ’controlled’ to ’in con-
trol’)(Bradley and Lang, 1994).
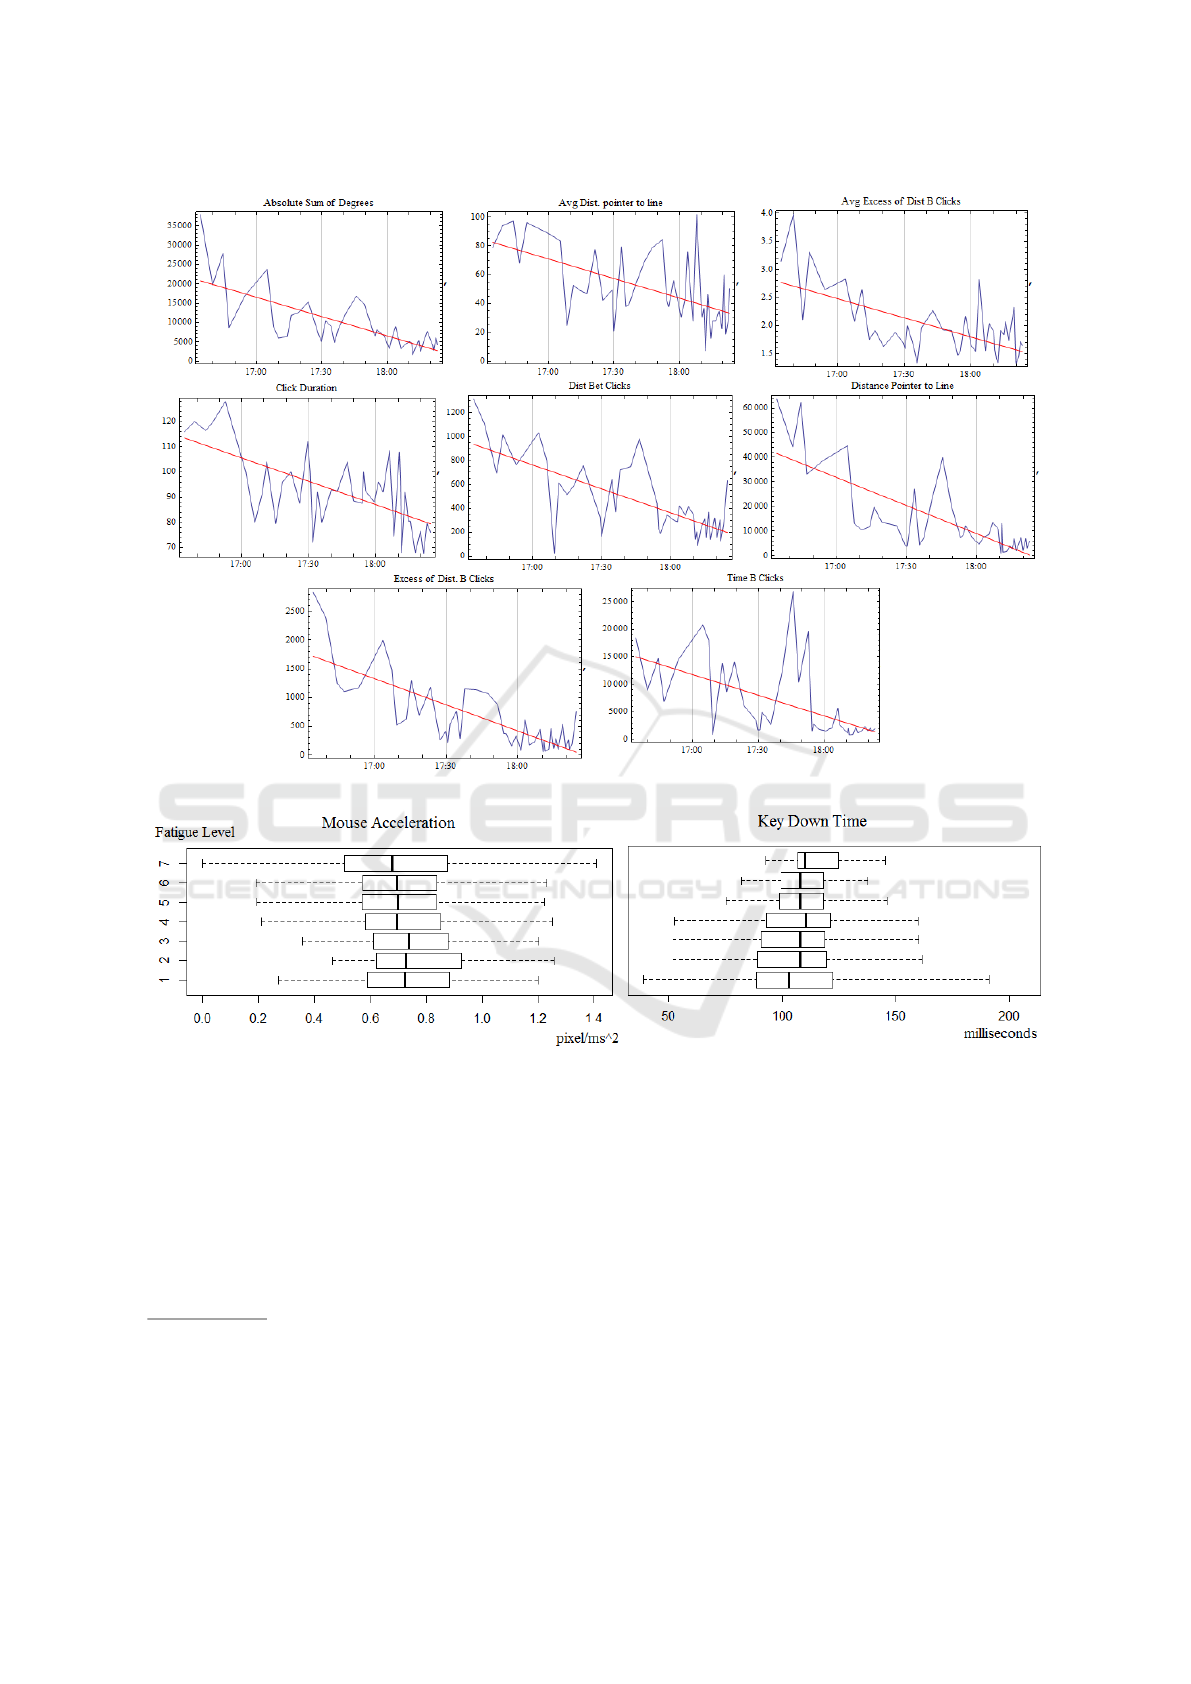
Figure 2: Evolution of student performance, described by 9 interaction features, during an high-stakes exam.
Figure 3: Interaction performance decreases (smaller mouse acceleration and longer keystroke latency) with higher levels of
fatigue.
Traditional approaches involve setting up the ex-
perimental trials, as well as controlling for stimulus
presentation and timing through software such as Pre-
sentation
2
(Neurobehavioral Systems, Inc., Albany,
CA, USA) or Superlab
3
(Cedrus, San Pedro, CA).
The few measures that are often the focus of those
studies (e.g. accuracy rates, reaction time) are usually
obtained by recording the participants’ responses di-
2
Presentation is a stimulus delivery and experimental
control program typically used in neuroscience and be-
havioural research. https://www.neurobs.com/
3
Superlab is an environment for setting-up and running
experimental studies, providing accuracy and reaction time
measures. http://www.superlab.com/
rectly via the software, or by using a paper-and-pencil
approach.
In this approach we are enriching this kind of in-
struments by incorporating new variables and improv-
ing the data collection procedure. The participant now
interacts with a mobile application to provide feed-
back about the auditory stimuli. To do so, the partic-
ipant selects which one of several emotion words (ar-
ranged in buttons and set by the expert when defining
the study) best characterizes the emotion conveyed by
the stimulus. The participant also classifies the va-
lence, authenticity and intensity of the emotion that
was expressed. This constitutes the operational infor-
mation. However, in parallel, the system is collecting
behavioral data that generates features such as touch
intensity, touch area, touch duration, among others,
which characterize the participant’s interaction with
the tablet. This allow to study, in parallel, emotion
perception and interaction patterns, with a significant
potential to hold new interesting variables and new
markers for cognitive impairments.
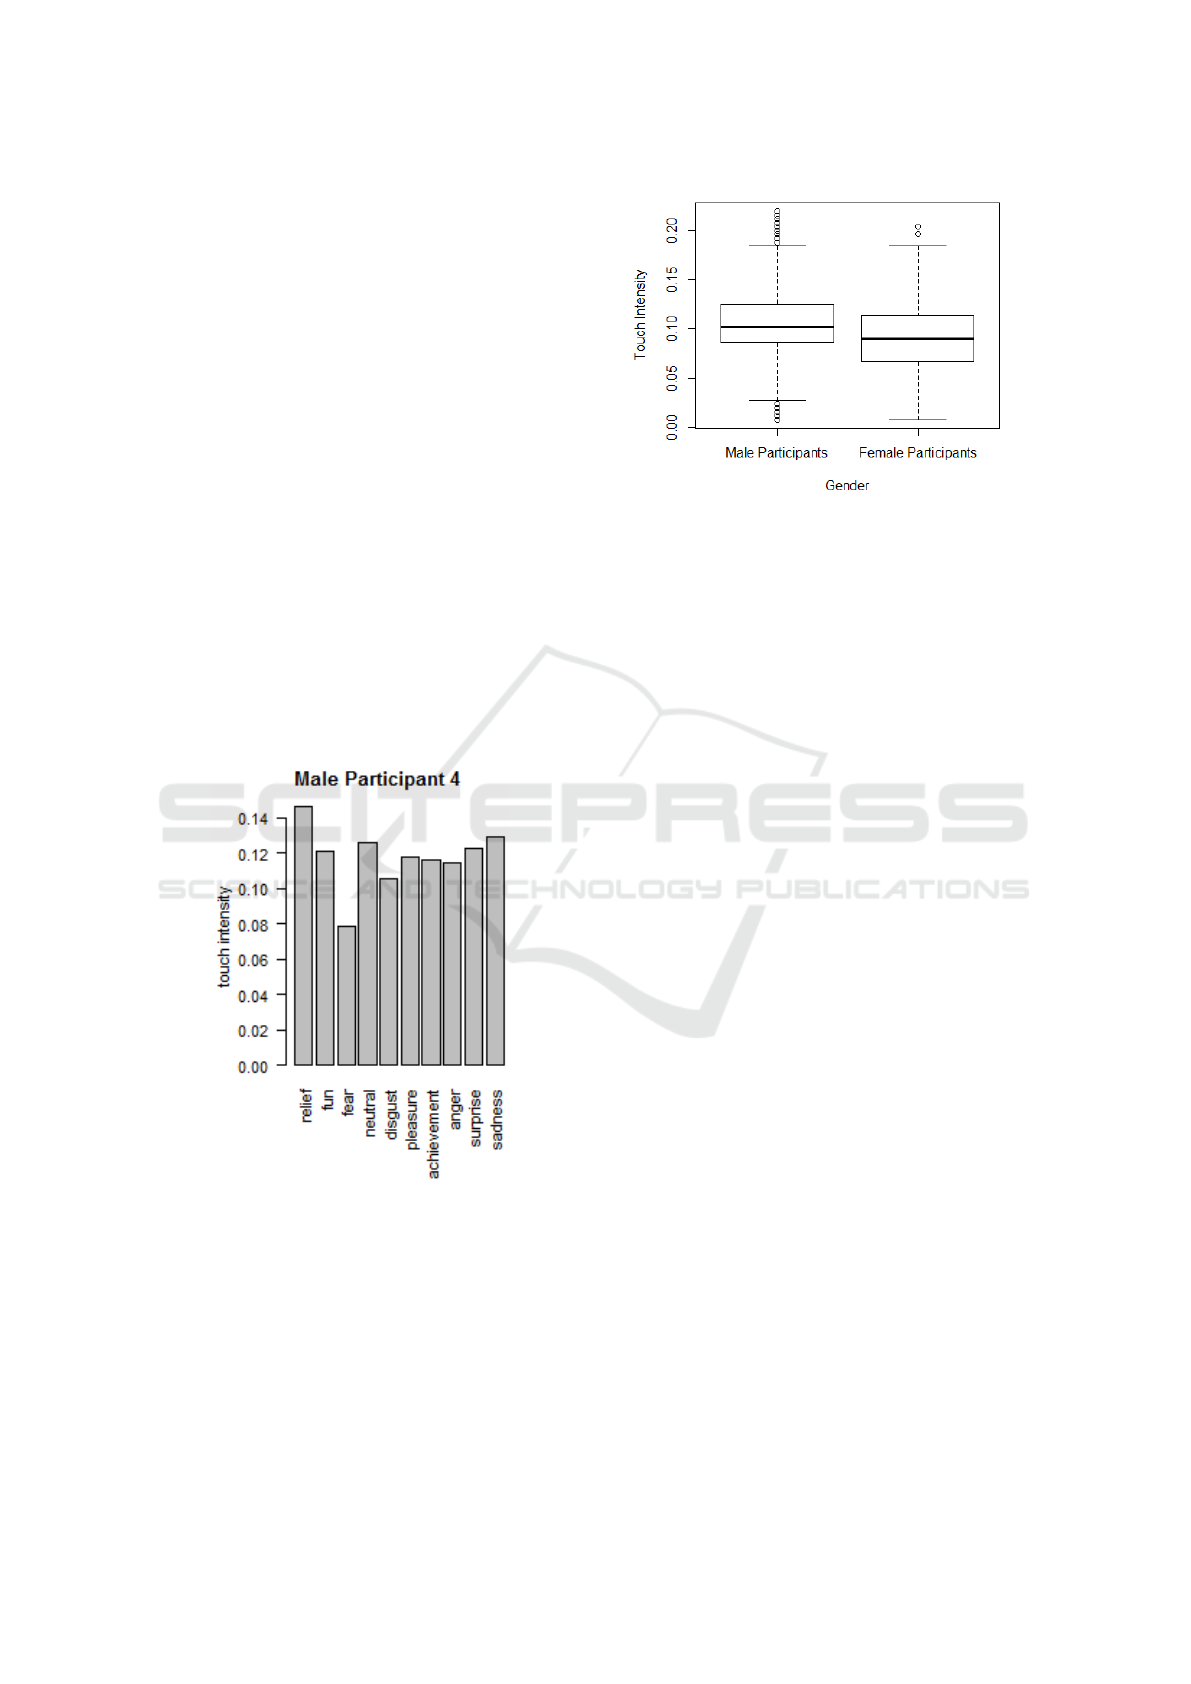
As an example, Figure 4 details how touch in-
tensity varies for a male participant according to the
emotion conveyed by the stimulus. It is interesting to
note that, for this participant, touches that happened
during stimulus that conveyed fear were far less in-
tense than touches conveying relief. In that sense, this
work allows to understand how emotions affect each
individual’s interaction with the device, with interest-
ing potential applications, namely in the development
of affective applications or devices. This approach
also reveals inter-individual differences at other lev-
els. Figure 5, for example, shows statistically signif-
icant differences in interaction patterns with a tablet
between men and women (Kolmogorov-Smirnov test,
p-value < 2.2
−16
). This approach is thus contributing
with new and interesting variables, both for the study
of emotion recognition and Human-computer Interac-
tion.
Figure 4: Touch intensity immediately after hearing each
type of stimulus for one of the participants.
5 CONCLUSIONS
In this paper we detailed the development of a
behavioral-approach to Ambient Intelligence. Indeed,
it is our belief that the path to developing true sensi-
tive and transparent AmI systems lies in the collection
and use of data in a non-intrusive way. Data collected
Figure 5: Distribution of touch intensity by gender, dif-
ferences are statistically significant (Kolmogorov-Smirnov
test, p-value < 2.2
−16
)
this way will not only be more abundant as there are
not barriers to its collection (as happens when peo-
ple use sensors or other devices that change daily rou-
tines) but also more true, as people’s behavior or rou-
tines will not be affected by the presence of sensors
or other devices.
In the description of three practical applications
that are now being carried out, we have shown how all
them may reveal very interesting insights about peo-
ple, and about the relationship between their behav-
iors and their actions. The access to this information
may not only allow us to better know ourselves but
also provide us with the knowledge to improve our
daily living: improve our stress coping mechanisms,
improve our work rhythms, or develop more sensitive
devices and environments.
ACKNOWLEDGEMENTS
This work was developed in the context of the project
EUSTRESS – Information System for the monitor-
ing and evaluation of stress levels and prediction of
chronic stress part-funded by ERDF–European Re-
gional Development Fund and by National Funds
through the FCT–Portuguese Foundation for Science
and Technology within project NORTE-01-0247--
FEDER-017832. The work of Filipe Gonçalves is
supported by a FCT grant with the reference ICVS-
BI-2016-005.
REFERENCES
Anacleto, R., Figueiredo, L., Almeida, A., and Novais, P.
(2014). Mobile application to provide personalized

sightseeing tours. Journal of Network and Computer
Applications, 41:56–64.
Bachorowski, J.-A. (1999). Vocal expression and percep-
tion of emotion. Current directions in psychological
science, 8(2):53–57.
Bradley, M. M. and Lang, P. J. (1994). Measuring emotion:
the self-assessment manikin and the semantic differ-
ential. Journal of behavior therapy and experimental
psychiatry, 25(1):49–59.
Carneiro, D., Costa, R., Novais, P., Neves, J., Machado,
J., and Neves, J. (2008). Simulating and monitoring
ambient assisted living. In Proceedings of the ESM,
pages 175–182.
Carneiro, D. and Novais, P. (2014). New applications of am-
bient intelligence. In Ambient Intelligence-Software
and Applications, pages 225–232. Springer.
Carneiro, D. and Novais, P. (2017). Quantifying the effects
of external factors on individual performance. Future
Generation Computer Systems, 66:171–186.
Carneiro, D., Novais, P., Pêgo, J. M., Sousa, N., and Neves,
J. (2015). Using mouse dynamics to assess stress dur-
ing online exams. In International Conference on Hy-
brid Artificial Intelligence Systems, pages 345–356.
Springer, Cham.
Cook, D. J., Augusto, J. C., and Jakkula, V. R. (2009).
Ambient intelligence: Technologies, applications, and
opportunities. Pervasive and Mobile Computing,
5(4):277–298.
Costa, R., Novais, P., Machado, J., Alberto, C., and Neves,
J. (2007). Inter-organization cooperation for care of
the elderly. In Integration and Innovation Orient to
E-Society Volume 2, pages 200–208. Springer.
Dennis, A. R. and Kinney, S. T. (1998). Testing media rich-
ness theory in the new media: The effects of cues,
feedback, and task equivocality. Information systems
research, 9(3):256–274.
Driskell, J. E. and Salas, E. (2013). Stress and human per-
formance. Psychology Press.
Durães, D., Carneiro, D., Jiménez, A., and Novais, P.
(2017). Characterizing attentive behavior in intelli-
gent environments. Neurocomputing.
Goel, N., Basner, M., Rao, H., and Dinges, D. F. (2013).
Circadian rhythms, sleep deprivation, and human per-
formance. Progress in molecular biology and transla-
tional science, 119:155.
Lima, C. F., Castro, S. L., and Scott, S. K. (2013). When
voices get emotional: a corpus of nonverbal vocaliza-
tions for research on emotion processing. Behavior
research methods, 45(4):1234–1245.
Novais, P. and Carneiro, D. (2016). The role of non-
intrusive approaches in the development of people-
aware systems. Progress in Artificial Intelligence,
5(3):215–220.
Turaga, P., Chellappa, R., Subrahmanian, V. S., and Udrea,
O. (2008). Machine recognition of human activities:
A survey. Circuits and Systems for Video Technology,
IEEE Transactions on, 18(11):1473–1488.
BRIEF BIOGRAPHY
Paulo Novais is an Associate Professor with Habilita-
tion of Computer Science at the Department of Infor-
matics, in the School of Engineering of the University
of Minho (Portugal) and a researcher at the ALGO-
RITMI Centre in which he is the coordinator of the
research group ISlab - Synthetic Intelligence, and the
coordinator of the research line in “Ambient intelli-
gence for well-being and Health Applications”.
He is the director of the PhD Program in Informat-
ics and co-founder and Deputy Director of the Master
in Law and Informatics at the University of Minho.
He started his career developing scientific research in
the field of Intelligent Systems/Artificial Intelligence
(AI), namely in Knowledge Representation and Rea-
soning, Machine Learning and Multi-Agent Systems.
His interest, in the last years, was absorbed by the
different, yet closely related, concepts of Ambient In-
telligence, Ambient Assisted Living, Intelligent Envi-
ronments, Behavioural Analysis, Conflict Resolution
and the incorporation of AI methods and techniques
in these fields.
His main research aim is to make systems a little
more smart, intelligent and also reliable.
He has led and participated in several research
projects sponsored by Portuguese and European pub-
lic and private Institutions and has supervised several
PhD and MSc students. He is the co-author of over
250 book chapters, journal papers, conference and
workshop papers and books.
He is the president of APPIA (the Portuguese As-
sociation for Artificial Intelligence) for 2016/2017,
Portuguese representative at the IFIP - TC 12 - Artifi-
cial Intelligence chair of the Working Group on Intel-
ligent Agent (WG12.3), and member of the executive
committee of the IBERAMIA (IberoAmerican Soci-
ety of Artificial Intelligence).
During the last years he has served as an ex-
pert/reviewer of several institutions such as EU Com-
mission and FCT (Portuguese agency that supports
science, technology and innovation).
