
Analysis of Material Requirement Planning (MRP) Implementation
on The Company
Chairul Furqon, Mokh. Adib Sultan, Rifqi Jalu Pramudita
Universitas Pendidikan Indonesia, Setiabudhi Street No.229, Bandung 40154, Indonesia
c_furqon@upi.edu
Keywords: Material Requirement Planning (MRP), Lot for Lot (LFL), Economic Order Quantity (EOQ), Periodic
Order Quantity (POQ).
Abstract: Inventory management has a strategic position in the company. As the one of the most expensive assets of
many companies, inventory representing almost 50% of total invested capital. Therefore, this study aimed
to analyse inventory management, especially Material Requirement Planning (MRP) implementation on the
company. MRP system with lot sizing techniques such as Lot for Lot (LFL), Economic Order Quantity
(EOQ), and Periodic Order Quantity (POQ) are implemented to decide when and how many materials are
needed based on the cost that company will pay. The research use descriptive comparative methods. Most
of the data analysed are about; product’s specification, number of orders in one year period, lead time, setup
cost, holding cost, and so on. The overall result shows that MRP analysis with POQ technique is the best
method’s with minimum cost of all materials.
1 INTRODUCTION
Fuel oil is one of the vital needs of our society.
Unfortunately, the oil production in our country
cannot meet domestic demand. For this purpose, oil
production capacity should be optimized by
increasing the capacity of the offshore pipeline as a
means of transportation. One of the executors who
are trying to fulfill the demand for upgrading the
offshore pipeline capacity is XYZ Company through
its project. The project is an offshore transmission
pipeline replacement from one of the offshore
platforms to the mainland oil refinery. The pipe to
be replaced is a two-lane pipe along ± 15 km.
Project implementation takes place approximately
16 months. Pipe coatings work are expected to last
for ± 311 working days since the bare pipe received.
It is included with the inspection, setup time, and the
things required satisfying the client's needs.
(Engineering center, 2015, Project Procurement
Plan, 2016).
In previous projects, the company used three
different types of coatings with different lead times.
The ordering of all raw materials is done in the first
week while the production process starts at the 10th
week. This causes the length of material storage
time; such conditions may increase the cost of
storage. Limited project time and material
endurance is a major consideration of why the
ordering of raw materials must be timely (Project
Execution Report, 2017).
The importance of inventory control planning
and capacity becomes one of the major factors in
minimizing storage costs and helping companies
achieve production targets. Inventory management
has a strategic position in the company. As the one
of the most expensive assets of many companies,
inventory representing almost 50% of total invested
capital. One of the inventory management methods
is Material Requirement Planning (MRP) (Heizer,
2014).
MRP systems became a prominent approach to
managing the raw material flow and components on
the factory in the late 20th century (Mabert, 2007).
By using this method, the company is expected to
get the minimum inventory cost by comparing three
lot sizing techniques in MRP, namely Lot for Lot,
Economic Order Quantity, and Periodic Order
Quantity. Some previous research showed that the
MRP implementation shall prevent the company
from wasting materials, more effective production,
and lead a more profitable business (Iasya, 2015).
However, not all MRP users attained the same
degree of MRP benefits (Salaheldin, 1998). This is
what lies behind the research on analysis of MRP
implementation on the company.
The purpose of this research is to analyze
efficiency level of inventory control by comparing
MRP methods with inventory cost incurred.
140
Furqon, C., Sultan, M. and Pramudita, R.
Analysis of Material Requirement Planning (MRP) Implementation on The Company.
In Proceedings of the 2nd International Conference on Economic Education and Entrepreneurship (ICEEE 2017), pages 140-145
ISBN: 978-989-758-308-7
Copyright © 2017 by SCITEPRESS – Science and Technology Publications, Lda. All rights reserved

2 LITERATURE REVIEW
The stock of material on inventory management is
used to facilitate production or meet customer
demand. The main reason companies should have
inventory are; protecting from uncertainty, enabling
economical purchase and production, masking
changes in anticipated demand and supply,
providing transit (Schroeder, 2011). The external
customer demand also has to be an orientation for
organization to keep a stock of items (Russell,
2006). The purpose of inventory management in
general is to determine the amount of inventory to be
stored, how much and when to order, and to get a
balance between inventory investment and service to
consumers. Inventory management has two main
approaches, base on the customer demand which
consists of dependent and independent. On
independent demand, the method used is Economic
Order Quantity, and others. As for the dependent
demand techniques used are Material Requirement
Planning (Heizer, 2014).
2.1 Material Requirement Planning
The main purpose of the MRP is to keep inventory
levels as low as possible. The MRP achieves it by
determining when a component is needed and
scheduling it to be available on time. To minimize
inventory cost, the company also can use JIT
system, but it is more suitable for small lot size and
large variety production, while MRP for large lot
size and small variety production (Hui Wang, 2017).
To use the MRP method effectively, the required
inputs are: Master Production Schedule (MPS), Bill
of Materials (BOM), inventory records, purchase
orders, and Lead Time are known. The MRP system
parameter is one of the most important activities for
the perfect system functioning. They should take
into consideration some reality and circumstances of
companies environment. For instance, supplier
deliveries are not always on time (fuzzy lead time),
so the safety stock option can be adopted as the
included parameter (Santin, 2015). In the case of
MRP problem with fuzzy lead times, analysis can
use a fuzzy multi-objective integer linear
programing (Madronero, 2015). The accuracy of the
MRP input is the main factors of MRP system
success. Once all inputs are available, the next step
is to determine gross demand and net requirement of
material. The difference of them lies in the
calculation of inventory stocks of the company.
Most of MRP outputs needed by the company
are; a) MRP report per period, b) MRP report per
day, c) Report of the plan of reservation, this report
contains Planned Order Releases and Planned Order
Receipt, d) Purchase Recommendation, e) Exception
report, is an additional report for raw materials that
have special treatment in the ordering process
(Heizer, 2014, Russell, 2006).
The MRP process consists of several steps;
netting, lot measurement, and offsetting as a
determination of order quantity and time by
considering process time. To achieve cycle time
reduction, it can use a smaller lot size, a reduction in
lot size transferred directly into lower raw process
times (Ying-MeiTu, 2017). MRP methods produce
schedule of production and the need for material
which required Lot Sizing technique. Determining
lot sizes in production areas is an essential task of
production planning and control (Schmidt, 2015).
There are various kinds of lot sizing techniques,
including: Lot for Lot (LFL), Economic Order
Quantity (EOQ), and Periodic Order Quantity
(POQ).
2.1.1 Lot for Lot (LFL)
Lot for Lot (LFL) is a technique that produces the
right amount of raw materials to meet the plans that
have been made. The LFL technique is in line with
the objectives of the MRP to meet the needs of
dependent demand. Therefore, the MRP system
must produce goods as required (Heizer, 2014).
2.1.2 Economic Order Quantity (EOQ)
The objective of EOQ is to minimize the amount of
ordering and storage costs. This technique is one of
the most commonly used and easy-to-use based on
the following assumptions: a) demand is known,
constant, and independent, b) lead time is known
and constant, c) receipt of inventory is instantaneous
and complete, d) quantity discounts are not possible,
e) only variable costs are setup and holding, f) stock
outs can be completely avoided (Heizer, 2014).
Although EOQ is more suitable for use when
demand is relatively constant and independent, it can
be used in known queries by finding the average
requests that appear within a year. The formula used
is:
(1)
Q* = Optimal number of pieces per order (EOQ)
D = Annual demand in units for the inventory item
S = Setup or ordering cost for each order
H = Holding or carrying cost per unit per year
Analysis of Material Requirement Planning (MRP) Implementation on The Company
141
2.1.3 Periodic Order Quantity (POQ)
POQ is a booking technique that issues orders within
specified time intervals between orders with the
number of items ordered must cover the number of
items required during the interval, e.g. once every
week. POQ is defined as the time interval when the
number of economic orders is derived from the
division of demand per period (Heizer, 2014). The
formula used is:
(2)
2.2 Inventory cost
The costs that appear in inventory management are:
a) Holding Cost, b) Ordering Cost, and c) Setup Cost
(Heizer, 2014). Holding costs covers: building
costs, material handling costs, labor costs,
investment costs, loans to purchase inventory
(Russell, 2006). Ordering costs are the costs
incurred during the booking process. The cost of
ordering includes several things: purchase cost of
goods, consist of unit price of material ordered,
supply fee that is cost incurred for delivery of goods,
inspection, administration cost, consist of document
issuance cost, certificate, letter examination, etc.
Setup cost is the cost incurred when a company
prepares a machine or an order manufacturing
process. These costs include labor costs incurred and
time. A high regulatory time will affect the labor
costs incurred so that the company needs appropriate
planning (Heizer, 2014).
3 METHODS
The research was carried out in 2016 to 2017. The
data used in this study consisted of primary data and
secondary data, include: number of pipeline orders,
number of coats required for a pipe, number of
coatings required for all pipes, lead time (raw
material ordering time), ordering cost and storage
cost incurred for the project, organizations and
projects structure, data and events from the internet
and journals.
This research uses quantitative approach with
descriptive research type. Especially descriptive
comparative analysis is used to compare three lot
sizing techniques in MRP; Lot for Lot, EOQ, and
POQ. The analysis start with MRP step which
include: 1) creating a Master Production Schedule,
2) creating a product structure or Bills of Materials,
3) collecting lead time data of raw material ordering,
4) preparing a Gross Requirements Plan, 5) Make a
Net Requirements Plan, 6) determine the ordering
time of goods (Planned Order Release) with lot
sizing method, 7) determine the right lot sizing
method (Heizer, 2014).
Determining the right lot sizing method will
result in a minimum total inventory cost.
Determination of this method is done by comparing
total inventory cost based on company calculation
with total cost obtained through calculation by lot
sizing method. Lot sizing methods used in this
research are Lot for Lot, Economic Order Quantity
(EOQ), and Periodic Order Quantity. The software
for data analysis use Production and Operation
(POM) for Windows ver. 3 (build 18).
4 RESULTS AND DISCUSSION
The Inventory analysis starts with the calculation of
raw material using Product Structure or Bill of
Material (BOM), and Records Inventory. Costs will
be calculated using the Lot for Lot method, EOQ,
and POQ.
The pipe to be produced by the company is pipes
coated by 3LPP, MLPP and CWC coatings. 3LPP
Coating consists of FBE, adhesive polypropylene,
and polypropylene. While the MLPP coating
consists of a pipe that has been coated 3LPP added
solid polypropylene and polypropylene foam.
Coating CWC is a concrete made from a mixture of
cement, water, and ore which will be applied to a
pipe that has been coated MLPP and has been
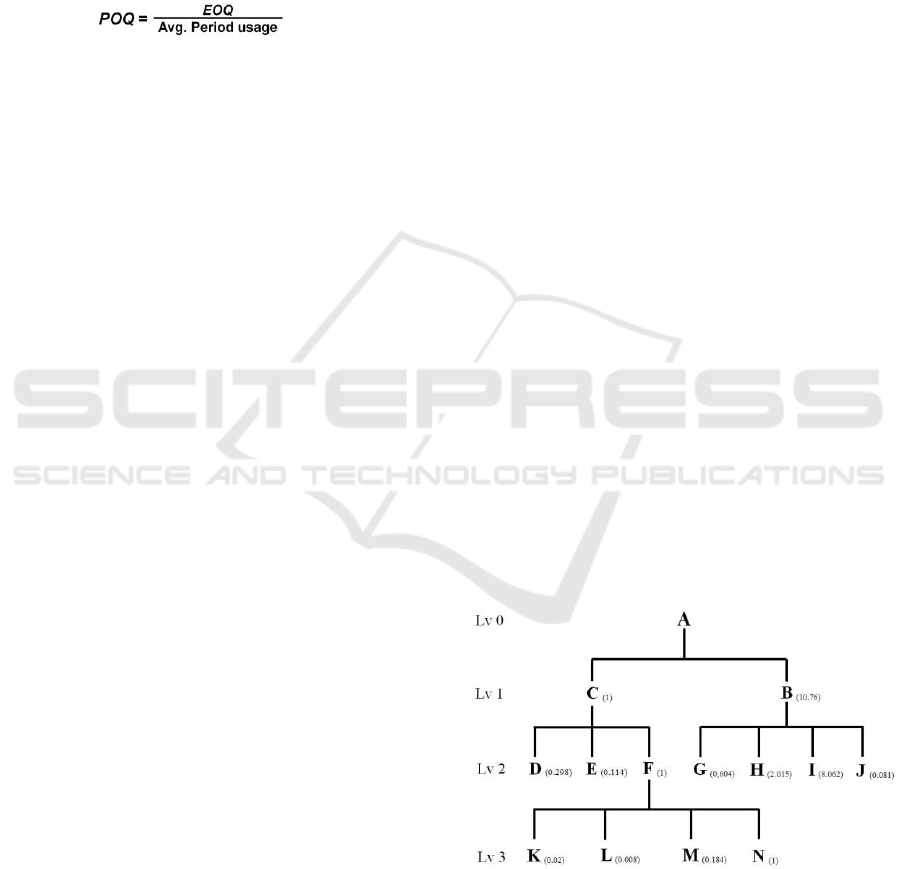
installed with a reinforcing frame. Below is Product
Structure or Bill of Materials (Figure 1).
Figure 1: Bill of Materials of the Product.
Meanwhile the raw materials detail of the
product can be shown in the Table 1.
ICEEE 2017 - 2nd International Conference on Economic Education and Entrepreneurship
142
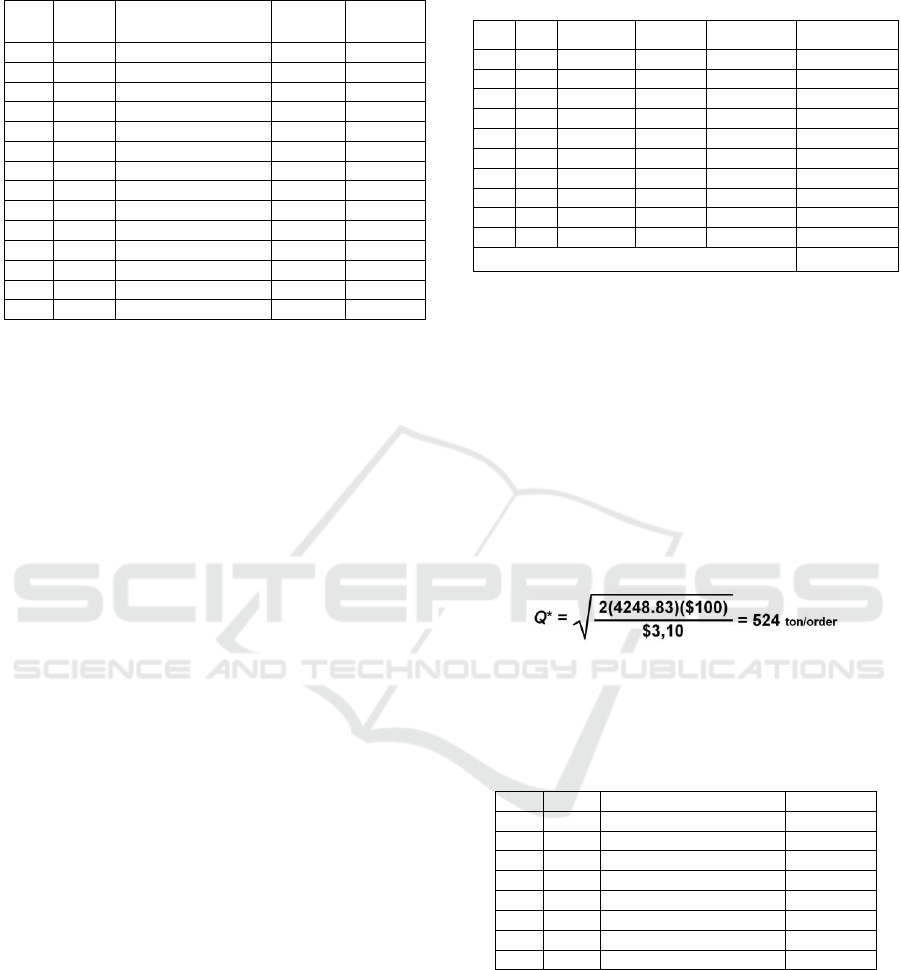
Table 1: Raw Materials Detail of Product.
Level
Code
Component/ Material
Name
Amount
Lead Time
0
A
CWC 100mm Coated Pipe
1 unit
3,5 weeks
1
B
Concrete Weight Coating
10,76 ton
4 weeks
1
C
MLPP coated pipe
1 unit
5,17 weeks
2
D
Polypropylene Foam
0,298 ton
12 weeks
2
E
Solid Polypropylene
0,114 ton
12 weeks
2
F
3LPP Coated Pipe
1 unit
2,7 weeks
2
G
Water
0,604 ton
1 weeks
2
H
Cement
2,015 ton
2 weeks
2
I
Iron Ore
8,062 ton
8 weeks
3
J
Reinforcement Frame
0,081 ton
4 weeks
3
K
FBE
0,02 ton
12 weeks
3
L
Adhesive polypropylene
0,008
12 weeks
3
M
Polypropylene
0,184 ton
12 weeks
3
N
Bare Pipe
1 unit
12 weeks
4.1.1 Lot for Lot (LFL) Analysis
The Lot for Lot (LFL) technique determines the
amount of raw material purchased in accordance
with the net amount of raw materials required in the
production process. The cost of inventory should be
reduced to 0 by this technique. Ordering of 100mm
CWC pipe raw materials begins by ordering a bare
pipe (N) 1230 units at first. In the same week,
polypropylene (M), adhesive polypropylene (L), and
Fusion Bonded Epoxy (K) ordered. Item M ordered
as much as 52.44 tons, 87.4 tons, and 86.48 tons.
For item L will be ordered a number of 2.28 tons,
3.8 tons, and 3.76 tons. At the same time item M
also ordered a number of 5.7 tons, 9.5 tons and 9.4
tons. Production of 3LPP coated pipe (F) items will
be made at the later week.
The production of concrete weight coating (B)
requires water (G), cement (H), iron ore (I), and
reinforcement frame (J). Any material needed in the
production of concrete weight coating has a different
lead time. The total requirement of 2478.45 ton H
items is required to produce B item. All of H items
needs will be met in five orders made for Meet the
needs in next week after. The last material to
produce B item is J item.
Although item F is completed in full at certain
weeks, item C will be produced three days after item
F. The total item C required is 1230 units Item C
consisting of items D, E, and F will be completed
whole at certain week. Item B has the same case as
item C, it takes 13,234.8 ton items B to produce item
A. Item A will be dried for 3.5 weeks.
The next step is to calculate the costs that appear
based on the data that has been calculated by lot for
lot technique. The calculation of costs by Lot for Lot
techniques is shown in the following Table 2.
Table 2: Total Inventory Cost of Product Raw Material
with Lot for Lot Technique.
No
Code
Amount
(Ton)
Holding
Cost
Ordering Cost
Total
1
N
3690
$308.03
$13,457.80
$13,665.83
2
M
226.32
$0.00
$449,239.67
$449,239.67
3
L
9.84
$0.00
$35,558.65
$35,558.65
4
K
24.6
$0.00
$82,549.32
$82,549.32
5
J
99.63
$0.00
$61,139.80
$61,139.80
6
I
9916.26
$0.00
$730,535.06
$730,535.06
7
H
2478.45
$0.00
$257,316.99
$257,316.99
8
G
743.73
-
$699.11
$699.11
9
E
140.22
$0.00
$278,747.40
$278,747.40
10
D
362.17
$0.00
$686,423.22
$686,423.22
Total
$2,595,975.04
4.1.2 Economic Order Quantity (EOQ)
Analysis
The analysis of EOQ uses average demand per year.
The amount of raw material demand in the project
has been determined for several weeks so it is
necessary to estimate the total annual demand for the
raw materials. Estimated annual raw material
demand is done by multiplying the average weekly
requirement for a total of weeks in a year as
described earlier. After the average annual use of
raw materials is obtained, the number of economical
orders can be calculated.
The EOQ calculation process generates an
economic order of all raw materials that can be seen
in the following Table 3:
Table 3: EOQ of Product Raw Material Technique
No
Code
Raw Materials Type
EOQ
1
M
Polypropylene
456 tons
2
L
Adhesive Polypropylene
95 tons
3
K
FBE
38 tons
4
J
Reinforcement Frame
93 tons
5
I
Iron Ore
8157 tons
6
H
Cement
2216 tons
7
E
Solid Polypropylene
278 tons
8
D
Polypropylene Foam
447 tons
Pipes and water are excluded from EOQ
calculations because pipes can only be ordered once
during the project, and water due to no storage and
ordering costs. The number of items M ordered by
EOQ technique is 456 tons, while the required
number of M items is 226.32 tons so that there are
229.68 tons of raw materials remaining. The same is
true for items D, E, K, and L, ordered L items
totaling 95 tons with a requirement of 9.84 tons and
leaving 85.16 tons. 38 tons of K items ordered with
Analysis of Material Requirement Planning (MRP) Implementation on The Company
143
the needs of 24.6 tons and remaining 13.4 tons.
Similar to the remaining E item 137.78 tons, the
ordered quantity is 278 tons with a requirement of
140.22 tons. The number of items D ordered was
447 tons with 80.46 tons remaining, and so forth.
After the amount of material ordered, the order
amount, and the ordering time is determined by
EOQ technique, the next step is to calculate the
inventory cost shown in the following table 4.
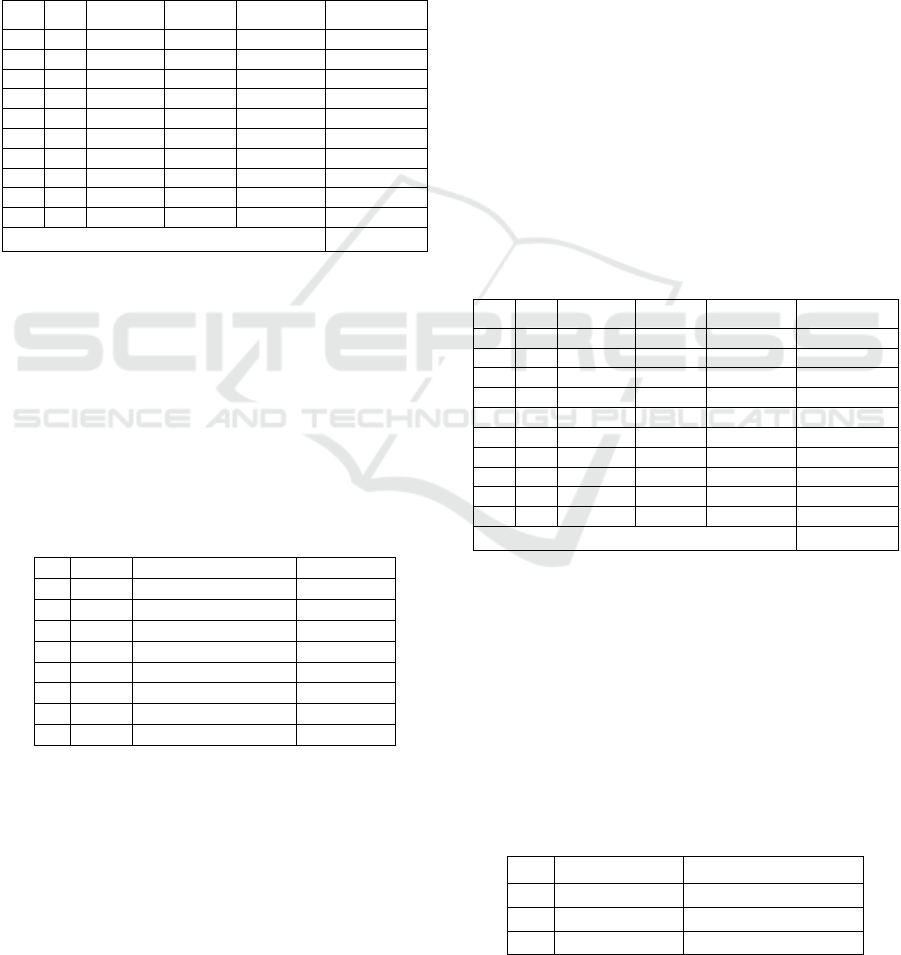
Table 4: Total Inventory Cost of Product Raw Material
with EOQ Technique.
No
Code
Amount
(Ton)
Holding
Cost
Ordering Cost
Total
1
N
3690
$308.03
$13,457.80
$13,665.83
2
M
456
$168.74
$904,644.40
$904,813.14
3
L
95
$56.39
$336,284.28
$336,340.67
4
K
38
$167.94
$126,886.23
$127,054.17
5
J
99.63
$83.41
$60,839.80
$60,923.21
6
I
9916.26
$89.65
$730,235.06
$730,324.71
7
H
2478.45
$82.70
$257,016.99
$257,099.69
8
G
743.73
-
$699.11
$699.11
9
E
278
$104.92
$551,554.70
$551,659.62
10
D
447
$112.04
$846,561.55
$846,673.59
Total
$3,829,253.75
4.1.3 Periodic Order Quantity (POQ)
Analysis
POQ analysis uses a lot determination technique that
orders the amount of raw material in accordance
with the required within the specified time interval.
The time span is determined by dividing the number
of economic orders by the average requirement per
period, in this study per week. The following Table
shows the order interval for each raw material.
Table 5: EOQ of Product Raw Material Technique
No
Code
Raw Materials Type
Interval
1
M
Polypropylene
6 weeks
2
L
Adhesive Polypropylene
30 weeks
3
K
FBE
5 weeks
4
J
Reinforcement Frame
5 weeks
5
I
Iron Ore
4 weeks
6
H
Cement
4 weeks
7
E
Solid Polypropylene
11 weeks
8
D
Polypropylene Foam
7 weeks
The pre-defined reservation time interval will be
used in the determination of the order amount. The
number of units of raw materials ordered will be
affected by the number of intervals and lead time of
each raw material. Water does not have an interval
because it is channeled directly when production is
being pipe has no interval because pipeline ordering
can only be done once during the project.
POQ technique determines the interval between
materials ordering. Item M which has six-week
intervals, ordered once 226.32 tons. The same
conditions for items L, K, J, I, E, and D. Item L has
an interval time ordered 9.84 tons at certain week,
and K items ordered 24.6 tons on the same week.
Item J also has a 5 week interval booked at certain
week because it has 4 week lead time. Item I have a
4 week interval booked 9916.26 tons at certain
week. All of these items are only ordered once with
the POQ technique as there is no more requests for
those items when the order is made after the interval
of each item.
Different things happen to item H that has a 4
week interval. Item H is ordered twice with first
order 1836,276 ton and second order 362,835 ton.
The second order was made to increase the number
of items H in inventory to meet demand at certain
week.
After the ordering amount with POQ technique is
determined, the cost of 100mm CWC pipe with POQ
technique can be calculated as follows:
Table 6: Total Inventory Cost of Product Raw Material
with POQ Technique.
No
Code
Amount
(Ton)
Holding
Cost
Ordering Cost
Total
1
N
3690
$308.03
$13,457.80
$13,665.83
2
M
226.32
$18.88
$449,039.67
$449,058.54
3
L
9.84
$0.82
$35,358.65
$35,359.47
4
K
24.6
$31.92
$82,349.32
$82,381.24
5
J
99.64
$97.56
$60,745.89
$60,843.44
6
I
9916.26
$121.12
$730,135.06
$730,256.18
7
H
2478.45
$57.65
$257,016.99
$257,074.63
8
G
743.73
-
$699.11
$699.11
9
E
140.22
$25.01
$278,247.40
$278,272.41
10
D
362.17
$65.38
$685,923.22
$685,988.60
Total
$2,593,599.45
4.1.4 Discussion of Research Results
Material requirement planning as a system of raw
materials planning and control used to take decisions
on the amount of raw materials to be ordered at a
certain period. The use of lot sizing technique is
expected to provide the minimum inventory cost.
However, not all lot sizing techniques resulting
minimum inventory cost. The analysis shows that
the total inventory cost of all techniques as follows.
Table 7: Cost Comparison of Lot Sizing Technique
No
Technique
Total Inventory Cost
1
LFL
$2.595.975,04
2
EOQ
$3.829.253,75
3
POQ
$2.593.599.45
ICEEE 2017 - 2nd International Conference on Economic Education and Entrepreneurship
144

The inventory cost of the company's raw
material control system is $2,605,654.34. The
company ordering all raw materials in the first week
and stored it until the production process begins to
run. This leads to high storage costs.
Economic order quantity technique generates a
total cost of $3,829,253.75. It is greater than the
company cost calculation, due to the remaining raw
materials.
The Lot for Lot technique adjusts the amount of
raw materials ordered by the amount of raw material
demand in order to reach 0 storage cost. However,
the cost of ordering raw materials will soar due to
the ordering process done repeatedly to meet the
amount of raw material needs each week. Total
inventory cost of Lot for Lot technique is
$2,595,975.04.
The total inventory cost generated by the POQ is
$2,593,599.45. This technique calculates the
interval between ordering and buying raw materials
in accordance with the required amount in a given
period. With this technique, the cost of ordering and
storage costs can be minimized optimally so that the
total cost of raw material inventory of pipe with
POQ technique is the minimum inventory cost
compared to other lot sizing techniques, it can save
inventory costs of $11,253.85.
5 CONCLUSIONS
Analysis of Material Requirement Planning (MRP)
with lot sizing technique used in this research are:
Lot for Lot (LFL), Economic Order Quantity (EOQ),
and Periodic Order Quantity (POQ). The lot sizing
technique that provides the minimum cost for all raw
materials is POQ. Ordering raw materials using the
POQ method is highly recommended to minimize
the cost of inventory because it scheduling the
ordering of raw materials in certain intervals with
the amount of raw materials ordered in accordance
with the demand of such raw materials in a certain
period. The company can save a significant
inventory cost by using appropriate technique in
inventory management.
ACKNOWLEDGEMENTS
We would like to express our deepest gratitude to
the Company as a member of Maspion Group, steel
pipe manufacturer, who have helped the research
from the beginning till its completion.
REFERENCES
Engineering centre, 2015. Front end Engineering design:
Pipeline Design Philosophy. Document Number: S-
41-1222-001W.
Heizer, J. Render, B. 2014. Operation Management:
Sustainability and Supply Chain Management (11 ed.).
Harlow, England: Pearson Education Limited.
Hui, Wang, Qiguo G. Information processing structures
and decision making delays in MRP and JIT.
International Journal of Production Economics, 2017,
Vol.188, p41-49.
Iasya, A., Yuanita H. Material Requirement Planning
Analysis in Micro, Small and Medium Enterprise Case
Study: Groove line
‐
an Apparel Outsourcing
Company Final Project. Journal of Business and
Management, 2015, Vol. 4, No.3, p317-329.
Mabert, Vincent A. The early road to material
requirements planning. Journal of Operations
Management, 2007, Vol.25, Issue 2, p346-356.
Madronero, Josefa M. Material Requirement Planning
under Fuzzy Lead Times. IFAC-PapersOnLine-
Elsevier. 2015, Vol.48, Issue 3, p242-247.
Project Execution Report. PTMB-ISP-QPPMP-0004.
(company internal document, 2017).
Project Procurement Plan. PTMB-ISP-QPPMP-0003.
(company internal document, 2016).
Russell, Roberta S. Taylor, Bernard W. 2006. Operation
Management: Quality and Competitiveness in Global
Environment. 5
th
Ed. Hoboken, New Jersey, USA:
John Wiley & Sons, Inc.
Salaheldin, Ismail. 1998. The implementation of material
requirements planning (MRP) systems in Egyptian
manufacturing companies: an empirical study. PhD
thesis. United Kingdom: University of Glasgow.
Santin, Karen, Sousa, L.S.G., Cardoso, B.M., Antoniolli,
P.D. MRP Implementation on Supply Management
Process: a Brazilian Furniture Industry Case Study.
European Journal of Business and Social Sciences,
April 2015, Vol. 4, No. 01, p158-173.
Schmidt, M., B. Münzberg, P.Nyhuis. Determining Lot
Sizes in Production Areas – Exact Calculations versus
Research Based Estimation. Procedia CIRP-Elsevier.
2015, Vol.28, p143-148.
Schroeder, R.G. 2011. Operations Management.
International Ed. Singapura: McGraw-Hill Education.
Ying-MeiTu, Chun-WeiLu. The Influence of Lot Size on
Production Performance in Wafer Fabrication Based
on Simulation. Procedia Engineering-Elsevier. 2017,
Vol.174, p135-144.
Analysis of Material Requirement Planning (MRP) Implementation on The Company
145
