
Accessibility of Schools in Indonesia: Is School Zoning Required?
Siti Parhah
Universitas Pendidikan Indonesia, Jalan Dr.Setiabudhi 229, Bandung , Indonesia
sitiparhah@upi.edu
Keywords: Accessibility to school, time spent to school, school zoning.
Abstract: Empirical evidence documented that school accessibility affecting the student’s performance. Under this
condition, the government made a policy that in the enrolment system must be based on school zoning. This
study identifies that distance to school as proxies of accessibility was important for guiding the school’s
zoning policy. Using the Indonesia Family Life Survey (IFLS) 2000, this study describes the distance
to school through descriptive analysis by using the data in the form of time spent to school. The analysis
shows that the time to school for each student at each level varied with the maximum traveling time
for 90 minutes. The finding emphasizes that school zoning policy is suitable to implement in Indonesia.
1 INTRODUCTION
The selection of school is at the decision of the
household level. In this case, parents play a very
dominant role in deciding where their child’s school
is. In this regard, the characteristics of the school to
be chosen are closely related to household
characteristics, such as the socio-economic condition
and the area of residence (Glenn, 1997). In addition,
school choice is also related to the aspect of equity
and social justice (West, 2006). Empirically, there is
a tendency that parents tend to choose schools that are
expected to improve their children’s achievement,
even if their children have to go to school in a location
far from where he or she lives (Pearce, 2000;
Singleton et.al, 2011).
In order to improve school accessibility, the
popular policy is to conduct school zoning. This
policy is expected to minimize the student’s travel
time to school, so that students can be more fit in
learning which is then expected to increase student
achievement. Previous studies have found that
school zoning policy increases student attendance
(Galabawa et al., 2002). This attendance rate will
then determine achievement and dropout rate
(Jones et al., 2006). Burde and Linden (2012)
revealed that the distance to school is very
sensitive to students. They noted that with
increasing attendance, students’ academic
performance is also increased. However, the
school’s zoning policy, according to some views,
eliminates the freedom of choice in education, and
this raises debates (Bunar, 2010).
Unlike the previous research that used spatial
analysis, this study used micro data sourced from
the Indonesia Family Life Survey (IFLS). The
study was conducted to analyse the distance to
school for elementary, junior-high and senior-high
school students. This will be useful to provide
another insight into the scepticism surrounding the
enactment of school zoning policy in Indonesia.
This research uses IFLS 3 of year 2000 was
provided by cooperation between RAND and
Center for Population and Policy Studies (CPPS)
of Gadjah Mada University. IFLS is a longitudinal
survey data that observes socioeconomic and
health conditions at the individual, household, and
community levels. IFLS data represent 83 percent
of Indonesia’s population living in 13 of 26
provinces in 1993 covering the islands of Java,
Sumatra, Bali, West Nusa Tenggara, Kalimantan,
and Sulawesi. To enrich the analysis, the data in
this study was also supported by Central Bureau of
Statistics data. The data to be used is the distance
to school that is measured through time spent to
school for each level of education. In addition,
other data to be used are school participation for
rural and urban areas.
622
Parhah, S.
Accessibility of Schools in Indonesia: Is School Zoning Required?.
In Proceedings of the 2nd International Conference on Economic Education and Entrepreneurship (ICEEE 2017), pages 622-625
ISBN: 978-989-758-308-7
Copyright © 2017 by SCITEPRESS – Science and Technology Publications, Lda. All rights reserved
2 METHODS
In the preliminary scenario, this study is planned to
see how the role of school zoning on student
achievement. However, since the data structure of
IFLS is not possible to research its correlation, the
method used in this research was descriptive method.
In the IFLS data, students’ academic
achievement is measured by national examination
scores. The implementation of the national
examination is done at the end of the school year
for each level of education. At the primary school
level, a national examination is conducted when
student has completed education at the end of the
sixth grade. For junior and senior high-school
level, national examination is conducted when
students are at the end of third grade. With regard
to the IFLS data structure, this national
examination data cannot be used for correlation
analysis because other data used in this study is
data from the survey results of students who are
still active in school
.
3 RESULTS AND DISCUSSION
The challenge in using IFLS data lies in the
process of data cleaning. The problem encountered
in data cleaning is the
number of duplicate data,
thereby reducing the number of observations.
Initially, the number of observations for the
travelling time to school data was 23078, but after
the cleaning, the number of observations was
reduced to 2324.
The travelling time to school can be a reference
to estimate the distance to school for each student.
In the IFLS data, the travelling time data must be
adjusted to the data “whether the student has
graduated” or “whether the student is still in
school” at an educational level. This is related to
the information available from respondents whose,
in facts, have passed and did not continue, so the
data about the travelling time is information of
when he/she went to school in the past. One of the
disadvantages of the data used is the lack of
information on whether the respondent went to
school using a vehicle or on foot.
Based on previous studies, distance travelled or
travelling time affects the arrival rate of students
to school. In macro data, it is represented by
school participation data.
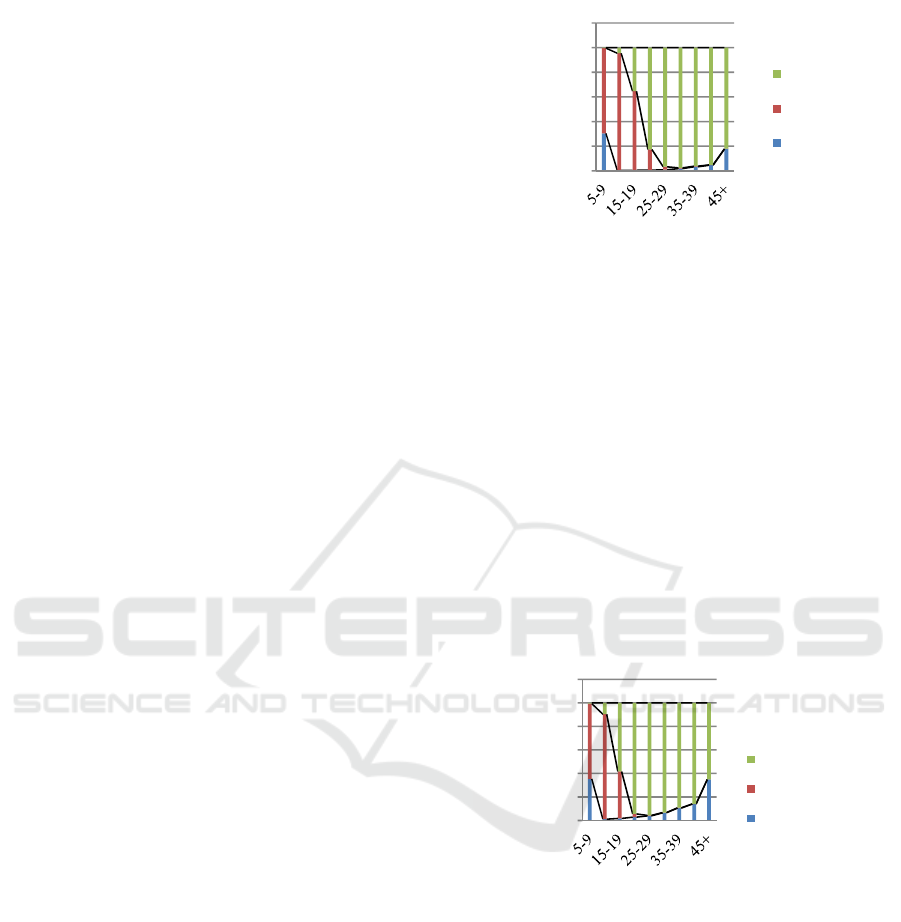
Figure 1: School participation (Urban) year 2000.
Figure 1 shows that the composition of urban
residents who no longer in school are dominant
compared with those who are still in school or who
are not or are not yet in school. In figure 1, we are
also informed that the population between the ages
of 10-14 years of school participation is the
highest. This illustrates to us that the profile of
urban residents from the educational aspect is
mostly secondary school graduates. Then we can
observe also that in the age range 20-24 years,
school participation began to decline. This
indicates that many residents do not continue their
education after completing their education at the
senior high school level.
Figure 2: School participation (Rural) year 2000.
Similar to urban areas, figure 2 shows that in
rural areas the composition of the non-resident
population is also the most dominant. However,
unlike urban areas, the compositions of the
population in rural areas that are not going to
schools are quite significant in numbers.
Referring to the macro data reflected in figure
1 and 2, in general, both in urban and rural areas,
school enrolment is already quite high, especially
at the junior secondary level. Whereas if referring
to micro data, this study reveals the picture of
student’s travelling time. The statistical summary
0,00
20,00
40,00
60,00
80,00
100,00
120,00
Participation (%)
Age
No more
schooling
Schooling
No
Schooling
0,00
20,00
40,00
60,00
80,00
100,00
120,00
Participation
Age
No more schooling
Schooling
No Schooling
Accessibility of Schools in Indonesia: Is School Zoning Required?
623

for students’ travel time to school can be seen in
table 1.
Table 1: The summary of statistics.
Level of
School
Traveling Time to School
Mean Max Min Std. Dev. Obs.
Elementary 12.52 90 1 9.70 1572
Junior High 16.47 60 1 10.67 217
Senior High 18.89 90 1 13.02 535
Total 14.36 90 1 10.99 2324
Table 1 informs us that the maximum travelling
time from home to school on a single journey takes
90 minutes for elementary and high school
students, and 60 minutes for junior high school
students. For elementary school students, 233 of
them travelled for 30 minutes. For junior high
school students, it was experienced by 48 students,
and for high school students, it covers 138
students.
When viewed from the average travel time,
high school students have the longest travelling
time, which is about 18 minutes; the elementary
school students have the average time of 12.5
minutes, and the junior high school students have
16.5 minutes.
The main topic of the study is to describe the
conditions of student travelling time at the
primary, junior, and senior high school levels. The
selection of these three levels of education is
linked to the school zoning policy applied in
Indonesia. This zoning policy is based on an
argument that there will be a quality distribution
of schools in every region, because each student
can choose the school closest to where he lives.
Before school zoning is enforced, students cannot
access the best schools in the region if
academically their grades
are not eligible for
admission to the school. This ultimately causes
students to have a considerable distance from
home to school. With close distance, students can
walk to school.
This will help to reduce the
transport burden for the household and will
improve the students’ physical condition. Several
studies have shown that walking to school or
cycling has many benefits, especially for physical
health (Rodriguez-Lopez et al., 2017; D’Haese et
al., 2011; Chillon et al., 2015).
As mentioned in the previous research that time
consumed to school for elementary grade was not
clearly known how the student goes to school. If the
maximum consumed time for a student is 90 minutes,
therefore a student should start from home at least on
5.30 to be in the school on 07.00. It related that in
Indonesia, commonly school activity start from
07.00.
Based on the data, it is not easy to compare ideal
consumed time to go to school. De Chiara and
Koppelman (1975) stated that the maximum distance
to school for an elementary grade is about 0.5 mil or
about 800m by walking. Then we can compare with
the previous studies in Belgium that the maximum
distance by walking are 1.5km for 11-12 year and
2km for 17-18 year (D’Haese et al., 2011; Van Dyck
et al., 2010). Chillon et.al (2015) stated that
maximum distance by walking are 1.4 km, 1.6 km,
and 3 km for 10 year, 11 year, and 14 year of age,
respectively.
This research has an insight that the student needs
a school that closest to his residence. It becomes a
base for government to make school zoning in
Indonesia as a policy. The policy has implication to
the student’s accessibility to school. Mandic et.al
(2017) recommended to policy maker that they
should make an enrolment system that supports the
parents to choose a school which is near to theirs
residence. The policy not impacts to the education
system only, but also to another aspect such as health,
transportation, and environmental sustainability.
4 CONCLUSIONS
Referring to the description of the data, there is a
variation of travel time to school for students at all
levels of education. There are students who travel
very briefly. On the other hand, there is a longer
time travelling. Based on the fact, this study may
provide a view that school-zoning policy is
indispensable, so that in general students may
access the nearest school from their residence.
REFERENCES
Bunar, N., 2010. Choosing for Quality or Inequality:
Current Perspectives on The Implementation of School
Choice Policy in Sweden, Journal of Education Policy,
25 (1), 1-18.
Burde, D., Linden, L. L., 2012. The Effect of Village-Based
Schools: Evidence from a Randomized Controlled Trial
in Afghanistan, NBER Working Paper 18039.
Chillón, P., Panter, J., Corder, K., Jones, A.P., Van Sluijs,
E.M.F., 2015. A Longitudinal Study of the Distance that
ICEEE 2017 - 2nd International Conference on Economic Education and Entrepreneurship
624

Young People Walk to School, Health & Place, 31: 133–
137.
De Chiara, J., Koppleman, L.E., 1975. Urban Planning and
Design Criteria, Van Nostrand Reinhold Company, 2
nd
Edition.
D’Haese, S., De Meester, F., De Bourdeaudhuij, I.,
Deforche, B., Cardon, G., 2011. Criterion Distances
and Environmental Correlates of Active Commuting to
School in Children, International Journal of Behavioral
Nutrition and Physical Activity, 8:88.
Glenn, C. L., 1997. Who Chooses? Who Loses? (Book),
Journal of Education for Students Placed at Risk
(JESPAR), 2 (4), 403-406.
Jones, J. T., Tomab, E. F., Zimmer, R. W., 2008. School
Attendance and District and School Size, Economics of
Education Review, 27: 140–148.
Mandic, S., Sandretto, S., Bengoechea, E.G., Hopkins, D.,
Moore, A., Rodda, J., Wilson, G., 2017. Enrolling in the
Closest School or Not? Implications of School Choice
Decisions for Active Transport to School, Journal of
Transport & Health,
http://dx.doi.org/10.1016/j.jth.2017.05.006
Pearce, J., 2000. Techniques for Defining School
Catchment Areas for Comparison with Census Data,
Computers, Environment and Urban Systems, 24: 283-
303.
Rodríguez-López, C., Salas-Fariña, Z.M., Villa-González,
E., Borges-Cosic, M., Herrador-Colmenero, M.,
Medina-Casaubón, J., Ortega, F.B., Chillón, P., 2017.
The Threshold Distance Associated with Walking from
Home to School, Health Education & Behavior, 1-10.
Singleton, A.D., Longley, P.A.
,
Allen, R., O’Brien, O.,
2011. Estimating Secondary School Catchment Areas
and the Spatial Equity of Access, Computers,
Environment, and Urban Systems, 35 (3), 241-249
Van Dyck, D., De Bourdeaudhuij, I., Cardon, G., Deforche,
B., 2010. Criterion Distances and Correlates of Active
Transportation to School in Belgian Older Adolescents.
International Journal of Behavioral Nutrition and
Physical Activity. 7: 87.
West, A., 2006. School Choice, Equity and Social Justice:
The Case for More Control, British Journal of
Educational Studies, 54 (1), 15–33.
Accessibility of Schools in Indonesia: Is School Zoning Required?
625
