
Impact of Tobacco Use on Poverty in Indonesia
Bayu Adi Radityo
Faulty of Public Health, Universitas Airlangga, Mulyorejo, Surabaya, Indonesia
bayu.adi.radityo-2014@fkm.unair.ac.id
Keywords: Tobacco, Poverty, Health, Indonesia.
Abstract: According to World Health Organization (WHO) data, almost 80 percent from a total of 1 billion smokers
globally live in low and moderate income countries. The proportion of tobacco use in the poorest smoker
households in Indonesia accounts for almost 12 percent of their incomes (Ahsan, 2009). The paper was
carried out to know how tobacco use can lead to poverty in Indonesia. This paper uses descriptive method to
collect quantitative data and results show that tobacco use is the third largest expense after food and
beverages and grains. Tobacco use also become the largest expenditure on people with medium and low
prosperity. The conclusion is that tobacco use has many negative impacts on poverty in Indonesia. The
following paper seeks to find more about how tobacco use can impact poverty in Indonesia.
1 INTRODUCTION
According to BPS data for September 2016, the
number of poor people (people with per capita
expenditure per month below the Poverty Line) in
Indonesia decreased to 27.76 million people
(10.70%) compared to 28.01 million people
(10.86%) in March 2016 (Central Bureau of
Statistics, 2017). Based on the area of residence, in
the period of March to September 2016 the number
of poor people in urban areas increased by 0.15
million people, whereas in the rural areas it
decreased by 0.39 million people (Central Bureau of
Statistics. 2017). The largest number of poor people
by province in September 2016 is East Java with
4.63 million people, while the lowest number of
poor people by province in September 2016 is North
Kalimantan with 47,030 people (Central Bureau of
Statistics. 2017).
Smoking is common, because of its relatively
affordable price, widespread and aggressive
marketing, lack of knowledge of the dangers and
inconsistencies of public policy on tobacco, whereas
smoking can cause health, economic, social and
environmental burdens (Kosen, 2008; Data and
Information Center Ministry of Health, 2015).
Smoking can cause various diseases, especially lung
cancer, stroke, heart disease and blood vessel
disorders, as well as decreased fertility, increased
incidence of pregnant out-of-body, fetal (physical
and mental growth) slows, seizures in pregnancy,
infant immune disorders and increased perinatal
death (Kosen, 2008). Based on the results from
Riskesdas (2013), smoking behavior of the
population 15 years and above did not decrease from
2007 to 2013 and even showed an increase from
34.2 percent in 2007 to 36.3 percent in 2013. In
2013, it was found 64.9 percent of men and 2.1
percent of women were still smoking cigarettes, with
1.4 percent of smokers aged 10-14 years and 9.9
percent of smokers in the unemployed group
(Agency for Health Research and Development
Ministry of Health, 2013).
2 METHOD
This research uses descriptive analysis method with
a quantitative approach. The use of this quantitative
descriptive method straightens the research variables
that focus on actual problems and phenomena that
are currently occurring in the form of meaningful
numbers (Shinta, 2013).The data used come from
government agencies, such as the Central Bureau of
Statistics (BPS). The data already collected will be
processed again into data obtained from the results
of the indicators of research variables and
interpreted in writing by the researchers (Shinta,
2013).
38
Radityo, B.
Impact of Tobacco Use on Poverty in Indonesia.
In Proceedings of the 4th Annual Meeting of the Indonesian Health Economics Association (INAHEA 2017), pages 38-41
ISBN: 978-989-758-335-3
Copyright © 2018 by SCITEPRESS – Science and Technology Publications, Lda. All rights reserved

3 RESULTS
Table 1 shows average expenditure (rupiahs) and
percentage of monthly average expenditure per
capita by commodity group and urban rural
classification in March 2016. In the table, cigarettes
account for the third largest expenditure after grain.
Table 1: Average Expenditure (Rupiahs) and Percentage
Of Monthly Average Expenditure Per Capita By
Commodity Group and Urban Rural Classification, March
2016
Commodity Groups
Expenditure
(Rupiah)
Percentage
(%)
Grains
Tubers
Fish/shrimp/common
squid/shells
Meat
Eggs and milk
Vegetables
Legumes
Fruits
Oil and coconut
64,566
5,057
33,620
20,526
28,025
34,505
10,349
19,268
12,705
6.82
0.53
3.55
2.17
2.96
3.65
1.09
2.04
1.34
Commodity Groups
Expenditure
(Rupiah)
Percentage
(%)
Beverages
Spices
Miscellaneous food
items
Prepared food and
beverages
Cigarettes
16,019
9,166
9,443
133,834
63,555
1.69
0.97
1.00
14.14
6.72
Total
460,639
48.8
Source : Susenas Results March 2016, Central Bureau of
Statistics
Expenditure quintile can be used to measure the
level of welfare or the level distribution of
income/expenditure, by sorting the average
expenditure per capita from the smallest to the
largest, then dividing them equally into five groups
of expenditure (Central Bureau of Statistics, 2016).
The higher the expenditure quintile, the increasingly
prosperous the household (Central Bureau of
Statistics, 2016).
Table 2 presents the monthly
percentage per capita expenditure by food group and
expenditure quintile.
Table 2: Monthly Percentage Per Capita Expenditure By Food Group And Expenditure Quintile, March 2016
Commodity Groups
First
Second
Third
Fourth
Fifth
Total
Grains
Tubers
Fish/shrimp/common
squid/shells
Meat
Eggs and milk
Vegetables
Legumes
Fruits
Oil and coconut
Beverages
Spices
Miscellaneous food items
Prepared food and beverages
Cigarettes
25.94
1.29
6.57
1.97
4.19
9.09
3.19
2.33
3.78
4.64
2.48
2.28
19.32
12.94
20.02
1.09
7.09
2.68
4.80
8.70
2.77
2.84
3.41
4.16
2.33
2.27
22.68
15.16
16.69
1.00
7.57
3.41
5.32
8.31
2.43
3.37
3.12
3.89
2.23
2.24
24.31
16.11
13.13
1.29
7.60
4.36
6.05
7.75
2.27
4.08
2.81
3.53
2.04
2.14
27.83
15.12
8.54
0.98
7.22
6.18
7.34
6.16
1.75
5.52
2.10
2.75
1.62
1.77
36.47
11.60
14.02
1.10
7.30
4.46
6.08
7.49
2.25
4.18
2.75
3.48
1.99
2.05
29.05
13.80
Total
100.00
100.00
100.00
100.00
100.00
100.00
Source: Susenas Results March 2016, Central Bureau of Statistics
Generally, tobacco-related illnesses take a long
time (15-20 years) to manifest after the smoking
behavior begins, so that the epidemic of tobacco-
related diseases and the number of deaths in the
future may continue to increase (Tobacco Control
Support Center – IAKMI, 2014). Table 3 shows the
total cost of treatment of diseases related to tobacco
use in Indonesia in 2013.
Table 3: Total Cost of Treatment of Diseases Related to Tobacco Use, Indonesia 2013
Disease
Total cases
Cost per episode
Total cost in 2013
Low Birth Weight babies
Neoplasm of Mouth and Throat
Neoplasm of Esophagus
216,050
6,670
1,710
6,185,362
3,733,141
3,733,141
1,336,347,460,100
24,900,050,470
6,383,671,110
Impact of Tobacco Use on Poverty in Indonesia
39
Disease
Total cases
Cost per episode
Total cost in 2013
Neoplasm of Stomach
Neoplasm of Liver
Neoplasm of Pancreas
Neoplasm of Lung, Bronchus
and Trachea
Neoplasm of Cervix
Neoplasm of Ovary
Neoplasm of Gall Bladder
Coronary Heart Disease
Cerebrovascular Disease/Stroke
Chronic Obstructive Pulmonary
Disease
10,440
13,400
2,910
54,300
28,940
7,690
10,160
183,950
144,780
284,310
3,733,141
3,733,141
3,733,141
3,733,141
3,733,141
3,733,141
3,733,141
6,017,579
7,726,946
4,551,951
38,973,992,040
50,024,089,400
10,863,440
202,709,556,300
108,037,100,540
28,707,854,290
37,928,712,560
1,106,933,657,050
1,118,707,241,880
1,294,165,188,810
Total
5,353,829,437,990
Source: Tobacco Control Support Center – IAKMI, 2014)
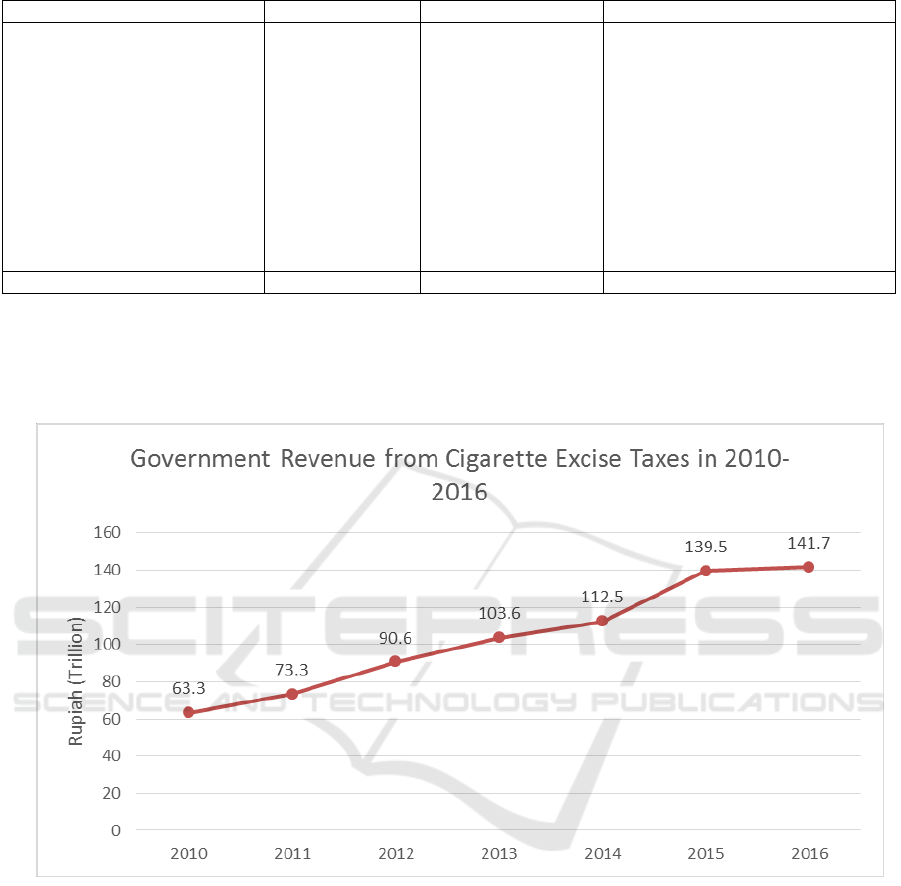
Every year in the state budget of revenues and
expenditure (APBN), the Government tends to target
cigarette excise taxes revenue to rise by reason of
reducing tobacco consumption in the community.
Chart 1 shows government revenue from cigarette
excise in 2010-2016.
4
Figure 1: Government Revenue from Cigarettes Excise Taxes in 2010 – 2016
4 DISCUSSION
Based on Table 1, cigarettes account for the third
largest expense after food and beverages and grains.
This shows that the people of Indonesia prefer to
buy cigarettes than foods such as meat, vegetables
and fruits. Tobacco use causes unnecessary and
actually preventable diseases, even worsening the
welfare of the poor and increasing the burden of the
country's economy.
Table 2 shows the highest expenditure of
cigarettes in the third expenditure quintile (medium
prosperity), while the lowest expenditure of
cigarettes is in the fifth (high prosperity) expenditure
quintile. People with medium to low expenditure
tend to spend more money on cigarettes than on
food. When the Poverty Line increases it increases
cigarette consumption (Sari, 2016). This can happen
because of the strong nicotine content in cigarettes
so that the addiction leads to continued smoking and
which is difficult to prevent.
Table 3 explains that the cost of treatment for
diseases caused by tobacco use is high. Estimated
data may be missed as the greater the use of tobacco,
INAHEA 2017 - 4th Annual Meeting of the Indonesian Health Economics Association
40

the higher the cost of treatment. Therefore, the
money that could have gone to buy other purposes is
used to fund the cost of treatment of diseases caused
by tobacco use. It can be estimated that the cost of
treatment for diseases caused by tobacco use can
account for all BPJS funds. According to WHO,
there is association between tobacco-related illness
and low-income level, especially for all-cause
mortality, lung cancer, low birth weight for
gestational age.
Table 4 shows that cigarette taxes received by
the Government are constantly increasing. However,
the number of smokers in Indonesia is still not
reduced, and has even tended to increase because of
the ease by which the people of Indonesia can obtain
cigarettes wherever and whenever. The amount of
received cigarette excise taxes revenue is still not
comparable with the impact of smoking due to
economic, health, social and environmental impacts.
According to Sari (2016), there is a significant
association between cigarette consumption and
Poverty Line. Although there has been a cigarette
tax, the cigarette consumption continues to increase.
5 CONCLUSIONS
Based on the research result, tobacco use has a
significant impact on the expense of medium and
low prosperity. In addition, the use of tobacco also
reduces financing for more important uses, such as
education, health and food. Although every year the
cigarette excise taxes target and revenue always
increasing, it’s not enough to reduce amount of
smokers in Indonesia. It requires effort by the
Government and the people themselves to reduce
tobacco use, such as the adoption of FCTC policies
that have been shown to reduce the degree of
tobacco use and the promotion of healthy lifestyles
to improve public health status.
REFERENCES
Agency for Health Research and Development Ministry of
Health. 2013. Basic Health Research 2013. [online].
Available at :
www.depkes.go.id/resources/download/general/Hasil
%20Riskesdas%202013.pdf (Accessed 4 September
2017).
Central Bureau of Statistics. 2016. Consumption
Expenditure of Population of Indonesia Based on the
results of Susenas March 2016. Jakarta: CV.
Dharmaputra.
Central Bureau of Statistics. 2017. Profile of Poverty in
Indonesia September 2016. [online] Available at :
https://www.bps.go.id/index.php/brs/1378 (Accessed 4
September 2017).
Data and Information Center Ministry of Health. 2015.
ISSN 2442-7659. Smoking Behavior of Indonesian
People Based on Riskesdas 2007 and 2013. [online].
Available at :
http://www.depkes.go.id/resources/download/pusdatin
/infodatin/infodatin-hari-tanpa-tembakau-sedunia.pdf
(Accessed 5 September 2017).
Kosen, Soewarta. 2008. The Impact of Health and
Economics of Smoking Behavior In Indonesia. Health
System Research Bulletin, h.207-211. Jakarta:
Research and Development and Health Policy Center.
Sari, Agnes Marisca Dian. 2016. Analysis of the Effects of
Cigarette Consumption on Poverty in Central Java.
Final Project. Semarang: State University of
Semarang.
Shinta, M. 2013. Relationship of Implementation of
Archive System with Effectiveness of Decision
Making of Leader: Descriptive study of quantitative
analysis in Sub Division of Personnel and General
Environment Office of Education Office of West Java
Province. Bandung: Indonesian Education University.
Tobacco Control Support Center – IAKMI. 2014. Books
of Potpourri - The Facts of Tobacco and the Problems,
5th ed. Jakarta: Tobacco Control Support Center –
IAKMI.
WHO. 2011. Systematic Review of the Link Between
Tobacco and Poverty. Geneva: WHO Press.
Impact of Tobacco Use on Poverty in Indonesia
41
