
Analysis of Student Satisfaction on Academic and Non Academic
Administration
Sri Lestari and Khusaini Khusaini
Program Studi Pendidikan Ekonomi, Universitas Islam Syekh Yusuf, Jl. Maulana Yusuf, Tangerang Indonesia
{Slestari, khusaini}@unis.ac.id
Keywords: Service Quality, Service Performance.
Abstract: The main issues of this study, the gap between expectations and reality felt by students about the quality of
academic and non-academic services in the Universitas Islam Syekh-Yusuf Tangerang. Service quality
indicators include; Reliability, responsiveness, assurance, empathy, and physical evidence (tangibles). The
research method used explanatory survey method with quantitative-qualitative descriptive data analysis with
different test. The result of the research shows that the level of performance is 3,26 sufficient categories, the
student expectation level is 4.50 important category, the test result is different t = 23,401, sig 0,000 <0,05, it
means there is difference between student expectation level and employee performance level. Student
satisfaction as a whole the aspects that are considered important or very important in the medium or
sufficient category.
1 INTRODUCTION
Progress of a nation is determined by many factors,
including the quality of education. Higher education
occupies a very important position in the service
sector because of its role in implementing Tri Darma
Higher Education. The higher public awareness of
the value (value) of higher education also the
demands of the community on the quality of
universities. Community demands for higher
education include quality assurance, quality control,
and quality improvement. Related to this, the
Education Economics Faculty of Teacher Training
and Education realizes that meeting the demands of
society on the quality of higher education is not just
to get good accreditation value from BAN-PT, but
has become the main goal as stated in the vision and
mission.
Increasingly fierce competition requires in
service to students should be improved. Students are
the main customers of college that can influence the
growth of college by looking at the number of
students. From this it should be college services
should be oriented to students. The education service
is a student's right which university must fulfil as a
service provider.
National customer satisfaction indices provide
additional benefit to different stakeholder. At the
micro level of single customer, the result of the
indices can be used for consuming decision (Bruhn
and Grund, 2000). The satisfaction of the students is
closely related to the match between student
expectation and the reality about the quality. If treats
students as customers by evaluating the gap between
expectation and reality perceived by students about
the quality of education service, it is expected can
prepare the right strategic plan to improve its
quality. This evaluation of student satisfaction can
be used to determine the quality of education service
that needs to be maintained and improved in relation
to resources such as funds, labor, and time.
Based on the description above to examine the
satisfaction related to the quality of education
service required appropriate measurement
instrument. With measurement instruments and
analytical tools suitable for student satisfaction
analysis, can evaluate the quality of education
services that will help realize the vision and mission.
The problem of student's satisfaction on the
quality of education service in the Education this
research is limited to student's satisfaction on the
quality of academic administration service, non-
academic, and the availability of education facilities.
Research problems formulated in the form of the
following questions:
How is student satisfaction on academic
service quality, non-academic seen from
Lestari, S. and Khusaini, K.
Analysis of Student Satisfaction on Academic and Non Academic Administration.
In Proceedings of the 1st International Conference on Educational Sciences (ICES 2017) - Volume 1, pages 409-413
ISBN: 978-989-758-314-8
Copyright © 2018 by SCITEPRESS – Science and Technology Publications, Lda. All rights reserved
409

dimension of belief, responsiveness, belief,
attention, and physical evidence?;
What is the configuration of academic, non-
academic administration services and facilities
to improve student satisfaction?;
Are there any differences in the performance
of academic and non-academic services?.
The objectives of the study are to present the
results of the research on student satisfaction on the
quality of education services seen from the
dimension of trustworthiness, responsiveness, belief,
attention and physical evidence Configuration of
academic, non-academic administration services to
improve the quality of education services to meet the
expectations and Differences of Academic and Non
Academic Service Performance with Student
Satisfaction.
Benefits Research as a reference related
empirical proof of student satisfaction analysis to
academic and non-academic services, giving input or
consideration in evaluating and improving the
quality of education service based on student
satisfaction, giving insight to understand how
student satisfaction analysis to the quality of
education service comprehensively.
2 SERVICE QUALITY
2.1 Services
Services as any action or performance that one party
can offer to another, which is essentially non-proof
and does not result in ownership of anything (Kloter,
2008; Sangadji and Sopiah, 2013). Service is an
economic activity whose output is not a product,
services are consumed simultaneously with
production time and provide added value, and are
intangible Zeithaml (Sangadji and Sopiah, 2013).
The main characteristic that distinguishes
services with products is the unreal nature of
services in addition to the active involvement of
consumers in the service delivery process. Services
have four main characteristics, namely: Intangibility,
Inseparability, variability, perishability (Kloter,
2008).
2.1.1 Classification of Services
Classifies services based on seven criteria, i.e.
market segment, degree of embodiment, service
provider skills, service organization objectives,
regulation, employee intensity level, and service
provider and customer contact level. Kotler (2008)
formulates that quality is a dynamic condition
associated with products, services, people, processes
and environments that meet or exceed expectations.
2.1.2 Types of Services
Tjiptono (2005) classifies services from the
consumer's point of view into two main categories;
Facilities services, i.e. services that are used as
a means or media to achieve certain objectives
that include transportation, communication,
financial, accommodation and recreation.
Human services, services addressed to
consumers. This category is divided into two
groups, namely human processing (people
processing) and human change (people
changing).
2.1.3 Service Quality Dimension
Sangadji and Sopiah (2013) presents five
dimensions of service quality;
Reliability, in the ability to provide accurate
and reliable services (dependably), especially
providing services on time, in the same
manner as the promised schedule, and Without
making a mistake:
Responsiveness is the willingness or desire of
the employees to help provide services
required consumers:
Assurance, including knowledge, capability,
friendliness, courtesy, and the credible nature
of personal contact to eliminate the nature of
consumer doubt and make them feel free from
harm and risk.
Empathy, including personal or corporate
contact attitude to understand needs and
difficulties, consumers, good communication,
personal attention, and ease of
communication.
Physical products (tangible), the availability of
physical facilities, equipment and
communication facilities that must exist in the
service process.
2.2 Higher Education Service
2.2.1 Quality of Education Service at Higher
Education
The products provided by educational institutions
are services. The quality of educational services is
very dependent on the attitude of service providers
in the field and the attitude and expectations of
ICES 2017 - 1st International Conference on Educational Sciences
410

education service users. Quality education services
are a process centered on achieving customer
expectations of education, continuous improvement,
sharing of responsibilities with employees
(Alifuddin, 2012). The quality of the college service
is declared good if it has the ability to establish and
realize the vision through its mission. Similarly, if
the university is able to meet the needs of
stakeholders covering the needs of society, the world
of work and the profession Hayati (Kamil, 2014).
Service quality plays a major role in education. High
quality is not a distinction between efficient and
inefficient colleges (Javadi, 2011).
Academic services include education-teaching
and non-academic services including financial
administration services and infrastructure facilities.
The process of service within a college
institution cannot be separated from the existence of
the student as a customer of the educational services
offered. Universities as service providers must be
able to meet the expectations of students and
minimize the gap in accordance with its ability.
Students as college institutional customers also have
the same behavior when they make a purchase of
goods with when making a purchase in the form of
services. Behavior of goods and services are both
seen in the process of acquisition, consumption,
experience, and ideas.
Students is customers. The customer is in general
believed to be satisfied when the offered products
meet their needs, desires and request (Helgesen,
2010). Students is customers. “When a customer
recognises quality, it is reflected in customer
satisfaction. Customer satisfaction in turn, can lead
to increased revenue. Customers are an economic
asset. They’re not on the balance sheet, but they
should be” (Gorst and jonathan, 1998). Universities
as institutions of education service providers should
pay attention to the satisfaction of students by
providing services implemented as much as possible,
so that students become satisfied customers of
education. While the low quality of college leads to
student dissatisfaction as a customer. Unsatisfied
students, tend to choose to withdraw or transfer to
other universities. While those who stay in the
college, will not provide a statement of support to
other prospects after graduation.
3 RESEARCH METHODOLOGY
The type of research is descriptive qualitative-
quantitative in accordance with the purpose of
research to describe the properties of a situation and
data obtained based on the formulation of the
problem (Syofyan, 2010). Qualitative-quantitative
descriptive method is used for fact-finding with
appropriate interpretation and the aim is to find a
systematic, factual, and accurate picture.
Data collection using primary data was done
through questionnaires distribution containing
questions to measure all variables studied. The
population used is students Universitas Islam Syekh-
Yusuf active period 2013-2014 and period 2014-
2015, which amounted to 184 students. The sample
based on Hary's Nomogram (Iskandar, 2013), is 60%
out of 184 as many as 110 students.
The questionnaire uses a scale of 5 (five)
adaptation levels of the Likert scale. For a reflecting
view of hope consists of a statement of view is very
important, important, important enough, less
important, and not important. While for performance
appraisal that reflects reality consists of very good,
good, fair, bad, and bad judgment statements. All
statements formulated in the form of questionnaire
items are positive statements.
This study uses a questionnaire that has been
tested to 30 respondents using product moment with
value r > 0.3 for validity and value r > 0.6 for
reliability using even odd test categorized reliable
good. (Sugiyono, 2013).
Data analysis by comparing performance scores
with student expectation scores. This level of
conformity will determine the priority order of
increasing factors affecting student satisfaction. Data
analysis by:
Comparing expectations and service
performance adapted from Sugiyono (2013) is
as follows.
Tki = Xi/Yi X 100%
(1)
Tki = Respondents Conformity Level
Xi = Service performance appraisal scores
Yi = Scores of service expectation expectations
From the above variables, the horizontal axis
(X) will be filled by the service score in
academic and non-academic administration
performance level to give satisfaction to the
students, while the upright axis (Y) is filled by
student expectation score.
X = Xi/n
(2)
Y = Yi/n
(3)
X = average score of level of satisfaction
Y = average score of expectation level
n = number of respondents
Analysis Configuration of Service Expectations
and Performance in Cartesius Diagram.
Analysis of Student Satisfaction on Academic and Non Academic Administration
411
Test the mean difference with paired samples
test used SPSS version 22 applications.
Ho: μ1 = μ2
Ha: μ1 ≠ μ2
4 RESULT AND DISCUSSION
4.1 Student Satisfaction on Academic
and Non Academic Administration
Services
The result of data analysis showed that student
satisfaction toward academic and non-academic
administration service obtained average of
appropriateness level and service performance of
academic and non-academic administration 72,58%,
with average service performance of 3.26 and the
average student expectation of 4.50.
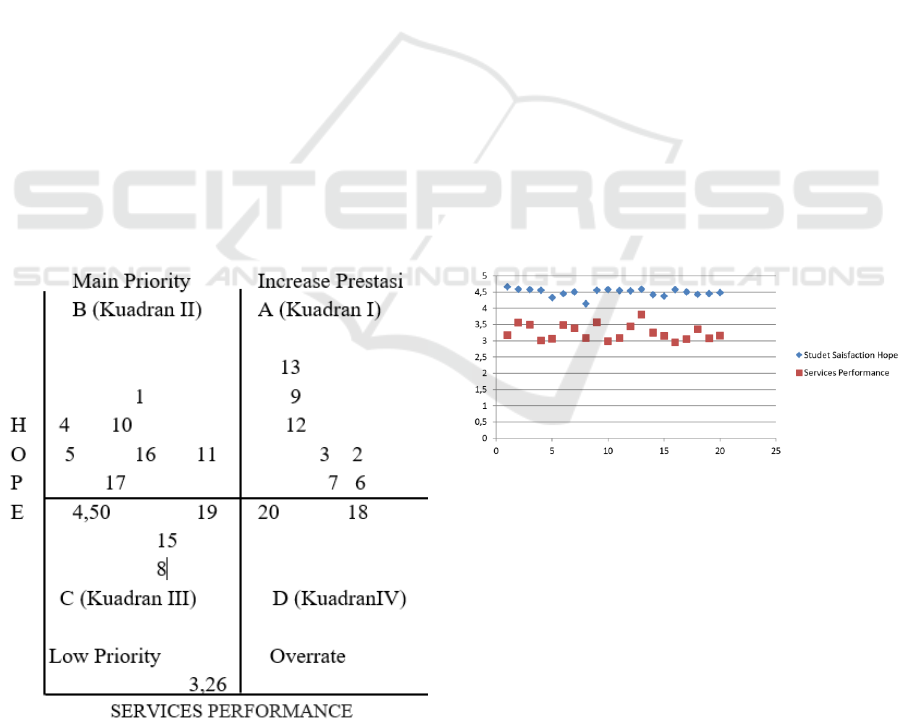
4.2 Configuration of Service
Expectations and Performance in
the Cartesius Diagram
The results of research indicate the level of service is
quite satisfactory, can be known by writing in
cartesius diagram the factors that affect student
satisfaction of service administration academic and
non-academic as follows:
Figure 1: Cartesius Diagram Factors Affecting Student
Satisfaction on the Service.
There are 20 indicators of student satisfaction on
the picture in four kuadran:
A (kuadran II student hope > 4.50, services
performance > 3.26 ) Shows the factors that
affect student satisfaction, including the
elements of service that peting or very
important, but the service is not as desired, so
it has not satisfied the students and require
priority;
B ( kuadran I student hope > 4.50,
performance < 3.26) Shows the element of
basic services that have been successfully
implemented quite well. Considered very
important and service performance is good
enough to be maintained and improved again;
C (kuadran III student hope < 4.50,
performance < 3.26) shows the factors that
affect student satisfaction of important
categories and the performance of service
implementation is;
D (kuadran IV student hope < 4.50,
performance > 3.26) Shows that the factors
affecting student satisfaction within this
quadrant are rated above average in
performance performance and below average
student satisfaction expectations. This is
because these factors are considered important
and the performance of administrative services
is quite good.
Figure 2: Scatter Diagram Between Student Satisfaction
Hope and Services Performance
Strategy that can be done to improve student's
satisfaction on Academic and Non Academic
Administration Service is to further improve the
existing performance factor and optimize the
expectation of student. Completion of services
should be done continuously by performing the
following steps:
Identify value-added services to students;
Identify student expectations and meet
expectations;
Identify the critical needs of academic and non
academic administration that enable it to
satisfy students;
ICES 2017 - 1st International Conference on Educational Sciences
412

Pay close attention to the error of the process
and eliminate the less relevant efforts;
Ensure continuous improvement by supporting
continuous feedback.
The service improvement strategy must be
balanced with the proper implementation strategy
that is with the project management approach that
should be held in all academic and non academic
administration.
4.3 The result of paired samples test of
Service Performance and Student
Satisfaction
Result of Mean Difference Test of Student
Expectation and Employee Performance with paired
samples test, obtained mean difference = 1,235
which means there is difference of score between
student expectation and employee performance. The
positive price means student expectation is higher
than the employee performance. The statistical price
t = 23,401, with db = 19 and sig numbers. Or p-
value = 0.000 ˂ 0.05 or Ho is rejected. Thus it is
concluded that there is a significant difference
between student expectations and employee
performance.
5 CONCLUSIONS
Student satisfaction on the quality of academic and
non academic administration services seen from the
dimensions of trustworthiness, responsiveness,
confidence, attention, and physical evidence shows
the level of service performance of 3.26 in sufficient
category and student expectations level of 4, 50
important categories.
Student satisfaction on academic and non
academic administration services shows the
following configuration: (1) Aspects that are
considered important or very important nanum of
service performance have not fulfilled student
satisfaction, (2) Aspects that are considered
important performance Service is good enough, (3)
The aspects are not too important, the performance
of the administrative services is good.
There is a significant difference between student
expectations and employee performance.
Leader is systematically acts quickly and
responsively in increasing student satisfaction
related to representative libraries and building
reliable computerized academic and non academic
administration.
Academic and non academic administration
personnel consistently maintain and improve
friendly service, always ready to assist, support
conducive learning by lecturers, move quickly and
quickly solve student complaints, effective
communication, and responsibility for security and
comfort.
Building understanding and cooperation between
administrative staff and students in fulfilling the
standard of service excellence and the creation of
harmonious relationship between administrative
staff with students for improving the quality of
education services on an going basis so as to meet
the expectations of the students.
REFERENCES
Alifuddin, M., 2012. Reformasi Pendidikan: Strategi
Informatif Peningkatan Mutu Pendidikan, Magna
Script. Jakarta.
Bruhn, M., Grund, A. M., 2000. Theory, Development and
Implementation of National Customer Satisfaction
Indices: the Swiss Index of Customer Satisfaction
(SWICS). Total Quality Managemet. vol.11, No. 7,
2000, S1017-S1028. Taylor & Francis Ltd.
Sangadji, E. M., Sopiah, 2013. Perilaku Konsumen, Andi.
Yogyakarta.
Gorst, Jonathan, 1998. Providing Customer Satisfaction.
Total Quality Managemet. vol.9, NOS 4&5, 1998,
S100-S103. Carfax Publishing Ltd.
Helgesen, O., 2010. Are Loyal Customers Profitable?
Customer satisfaction, Customer (Action) Loyalty and
Customer Profitability at the Individual Level. Journal
of Marketing Management. Pubisher: Routledge.
Informa Ltd.
Iskandar, 2013. Metodologi Penelitian Pendidikan dan
Sosial. Mega Mall. Jakarta.
Javadi, M., 2011. Quality Assesment for Academic
Services in University of Isfahan According ti the
Student’s Opinion Using SERVQUAL. Model
Interdicliplinary Journal of Contemporary Research
of in Business. Volume 3 Edisi 4.
Kamil, K. E., 2013. Penelitian Analisis Kepuasan
Mahasiswa terhadap Layanan Administrasi Akademik
dan Sarana Prasarana pada PPs UNIS, PPs UNIS.
Tanggerang.
Kloter, P., 2008. Manajemen Pemasaran, Jakarta Indeks.
Jakarta.
Sugiyono, 2013. Metode Penelitian Manajemen, Alfabeta.
Bandung.
Syofyan, S., 2010. Statistik Deskriptif, Rajagrafindo
Persada. Jakarta.
Tjiptono, F., 2005. Pemasaran Jasa, Bayumedia. Malang.
Analysis of Student Satisfaction on Academic and Non Academic Administration
413
