
Validation of Advanced Progressive Matrices as a Instrument
Intelligence Test in Indonesian Cultural Perspective
Yaya Sunarya dan Nurhudaya Nurhudaya
Departemen Psikologi Pendidikan dan Bimbingan, Universitas Pendidikan Indonesia, Bandung, Indonesia
{yayasunarya, nurhudaya}@upi.edu
Keywords: Reliability, item validity, item difficulty Index, discriminating index.
Abstract: To achieve of the intelligence score on a test, is highly influenced by culture, where people staying. Hence
the validity of a test always need to be analysed continuously from time to time. This research analyze various
aspects of good test advanced progressive matrices were constructed by Raven with involving 36 items, that
its use had been widespread in various countries , including Indonesia . The analized aspect include reliability
index, accuracy of validity, the discriminating index of item, and usability of distractors for each item. This
research involving 4500 respondents of senior high schools student. The results of validation indicates that
each of items has proportional level of item difficulty index about hardship items, middle item, and difficult
item; any item having good index of homogeneity, every item have good power distinguishing, and every
options of item have a good function. So that this test can be used in Indonesia for full item (full scale).
1 INTRODUCTION
Implementation of the assessments, both educational
assessment and psychological assessment, have the
ultimate goal of making decisions about individuals
(Murphy, 1998), on processes and learning outcomes
(Nitko, 1996), and on the condition of psychological
attributes measured (Crocker, 1986) by applying test
as a measure (Wright, 2011). With the test result, the
test taker (teacher, counselor, psychologist or helper)
interprets the quality of one's behavior in the form of
"label", which is then attached to one's self (Ercole,
2009). Based on the interpretation, decisions both
with regard to education as well as other fields are
made.
The Indonesian government nowadays, highly
appreciate learners who have high intelligence and
talent (special). A special program for them is a
special talented children's school program (CIBI),
which is one of the requirements that students have
very intelligent brain (IQ 130 and above). One
instrument for identifying this capability is that the
IMM which is believed to have the power to select the
child with special ability (Subino 1984). It is
suggested by some experts that in order for the
appropriate decision to be taken, a test needs to be
analyzed and reviewed for efficacy (reliability and
validity, especially the item discrimination index) at
any time (Murphy, 1998; Wright, 2011).
This APM test has a progressive level of
difficulty. To test and maintain this, norms have been
tested in various places and opportunities to see their
normality and stability in different cultures, ethnic,
and socioeconomic groups (Raven 2000: 1). This test
has been applied and studied in various countries and
various field settings. As reported by Brouwers, Van
de Vijver, and Van Hemer (2009) who have
conducted meta-analysis in 45 countries for 60 years.
Specifically the validity of the APM (IQ) test score
on job performance has been investigated by
Richardson and Norgate (2015). Meanwhile, related
to the effect of age on achievement of APM score has
been investigated by Babcock (1994). But is it also
true in Indonesia whether the 1984 test results still fit
the current picture? This study only tests the difficulty
index, discrimination index, and distractor capability,
because basically all three will determine the validity
and reliability of the tests empirically.
480
Sunarya, Y. and Nurhudaya, N.
Validation of Advanced Progressive Matrices as a Instrument Intelligence Test in Indonesian Cultural Perspective.
In Proceedings of the 1st International Conference on Educational Sciences (ICES 2017) - Volume 1, pages 480-486
ISBN: 978-989-758-314-8
Copyright © 2018 by SCITEPRESS – Science and Technology Publications, Lda. All rights reserved

2 INTELLIGENCE
MEASUREMENT
In this study intelligence is seen as a basic ability of a
person, which is demonstrated by the efficiency of
intellectual work, which will determine the success or
failure of a person in learning. This basic ability is
expressed by the IQ score obtained from the results of
this intelligence test. What is meant by one's
intellectual work efficiency is the total ability to
observe and think clearly. The ability to think
efficiently and clearly will appear and be measured
when someone is doing the test, in a limited time. One
can be said to think efficiently if the activity is done
easily, quickly, and appropriately (Subino, 1984: 9).
Recent developments, Shakeel and Gogkari (2017)
explain that the APM test developed by Raven is one
of 6 intelligence tests they studied as tests that
measure fluid intelligence.
This APM test according to Raven (2011)
measures the intellectual performance of those with
above-average intelligence; and this test is also able
to distinguish sharply between those classified as
having superior intelligence from others. Subino
(1984: 97) concludes that the set of APM II includes
problems that can be a measure of all the integral and
analytical operations that exist in the high thinking
process.
In some literature it is stated that intelligence test
scores are always interpreted on the basis of
comparison with scores in groups of children of their
age. Therefore norms used always include those age
groups. On the other hand, based on the results of the
trials found that the total score of intelligence tests
with APM, in children until the final adolescence
(student) the total score rose, while in adults tend to
decline coincided with increasing age. It can be
reviewed from the following test results.
In reliability testing, from children to adulthood,
the number of reliability increases. For example,
based on Foulds test results (Subino, 1984: 98) a re-
test obtained reliability rate of 0.76 for children aged
10.5 years, 0.86 for 12.5 years age group, and 0.91 for
groups of students and adult.
Referring to the results of Subino’s research
(1984: 182), with 36 questions set II against 981
students, it can be concluded: First: Reliability index
with KR20 approach is between 0.81 to 0.85. This
reliability shows a high degree of reliability (steady).
Second: The questions of APM are built up from easy
to difficult problems, and the APM is more sensitive
to those with superior intelligence than the low
intelligence. Third: The items of the APM are not
perfectly progressive (not the quickest from the
easiest to the difficult ones), some early items have
better discrimination index.
The re-test reliability with the re-test done by
Yaya Sunarya (2015) with three repeated tests using
Pearson's product moment correlation, obtained a
correlation number between 0.73 to 0.76. This means
that this APM has a fairly high degree of consistency.
Which also means that repeatedly the scores obtained
by each tested will still be in a reasonable fluctuation
(not out of the standard error measurement).
According to the assessment experts, a good test
instrument should at least have validity, reliability,
discrimination index, and difficulty index (Crocker,
1986; Murphy, 1998; Drummond, 2010; Wright,
2011).
2.1 Test Validity
Test validity is the level of accuracy of a test in
measuring what it wants to measure, not deviating
from what the theory or clues is already made. Junior
high school test, for example, should really measure
students' mathematics learning outcomes in second
grade; not the other, nor does it measure the learning
outcomes in other fields of study. There are several
validity tests (learning outcomes, psychological tests)
and the ways to test them:
2.1.1 Construct Validity
The construct validity refers to the precision of the
concepts underlying the instrument development,
which explains the attributes or aspects to be
expressed conceptually. The construct validity is the
source and the meaning estuary of the test result. To
test the construct validity is often done by factor
analysis techniques.
2.1.2 Content Validity
The level of content validity can also be recognized
by rational analysis (Subino, 1987). Essentially the
examination of each item is done, whether the matter
is in accordance with the indicators or learning
outcomes, or subject matter to be tested. The usual
way is to match each item with a clue compiled based
on a concept. Testing in this way is done to answer
the following questions.
Have the whole test (matter) fit with the referred
grid?
Are there any items that deviate, or demand
answers from the relevant thing or concept?
Validation of Advanced Progressive Matrices as a Instrument Intelligence Test in Indonesian Cultural Perspective
481

2.1.3 Concurrent Validity
To analyze this type of validity, it can be known
empirically, namely by calculating the correlation
coefficient between tests concerned with other tests
that have been standard as the criteria. Another test
that can be used as a criterion is a test that has been
considered valid
2.1.4 Predictive Validity
This validity indicates the extent to which the test
scores concerned can be used to predict a person's
future success in a particular field. How to get it is a
test score correlated with future probability. For
example, the value of National Exam in junior high
school, correlated with the achievement of learning in
high school in the same subjects.
2.2 Test Reliability
Test reliability is the level of consistency of a test, i.e.
the extent to which a test can be trusted to produce a
steady or consistent score (unchanged). A reliable test
that generates a score steadily, relatively unchanged,
although it is administered in different situations and
times.
Test reliability can be estimated by the following
methods: test-retest, alternate or parallel form, split-
half reliability (Anastasi, 1988), internal consistency
(Murphy and Davidshofer, 1998; Crocker and Algina,
1986; Drummon and Jones, 2010) and interrater
reliability (Drummon and Jones, 2010). From the test
results obtained coefficient correlation that shows the
reliability index.
2.3 Item Analysis
The item analysis is every effort to know the quality
of each item in a test by calculating discrimination
index, difficulty index, homogeneity index, and
deception function in each item. (Crocker and Algina,
1986: 311; Izard, 1977; Subino, 1987; Sukardi, 2009).
Discrimination index indicates the extent to which
each item is capable of distinguishing between those
who have attributes and those who do not have the
attributes expressed. It is a question of low power, of
no benefit, even to 'harm' a particular individual
(Subino, 1987; Suryabrata, 1999).
The difficulty index, particularly in cognitive
tests, indicates whether the item is difficult, moderate
or easy. A good test contains about 25% easy
questions, 50% moderate and 25% difficult. It is too
difficult to make it almost missed by all students or
too easy so it can be answered by almost all students,
should be discarded because it is not useful (Izard,
1977).
The homogeneity index of the question indicates
whether each item measures the same aspect, or the
extent to which each item contributes to the total
score. A homogeneous item is the one that supports
the total score. Conversely, items that are not aligned
with the total score are not homogeneous, and are
better discarded or revised (Karno To, 2003).
In the multiple-choice test, each item uses several
observers (distracters / decks / options). Each checker
should function, i.e. there is a test participant who
chooses it. Deceivers that are not chosen at all, mean
that they cannot work to deceive, on the contrary the
deceivers selected by almost all students mean they
are too similar to the correct answer (Karno To,
2003).
3 METHOD
This research is a descriptive research with expost-
facto approach, involving 4500 participants from 20
schools. The data were collected by documentation
study at Laboratory of Educational Psychology and
Guidance FIP UPI. The data were analyzed by
Advanced Progressive Matrices (APM) intelligence
test developed by John C. Raven (1962), on the basis
of his theory is the theory of intelligence from
Spearman (namely the theory of "g" factor). This test
consists of two sets, set I consists of 12 problems (as
a matter of practice), and set II about 36 questions.
The problem model used is a multiple choice with
each option 8 (dichotomous). The analyzed one is a
matter of set II. The techniques are analysis of items
with aspects of analysis (1) difficulty index, (2)
discrimination index, (3) homogeneity of items, and
(3) distractor analysis. Reliability has been done in
previous research.
4 RESULTS AND DISCUSSION
4.1 Difficulty Index
The results of calculation by calculating the
proportion (P) student / tested who answered
correctly on each item with difficulty index as
follows.
ICES 2017 - 1st International Conference on Educational Sciences
482
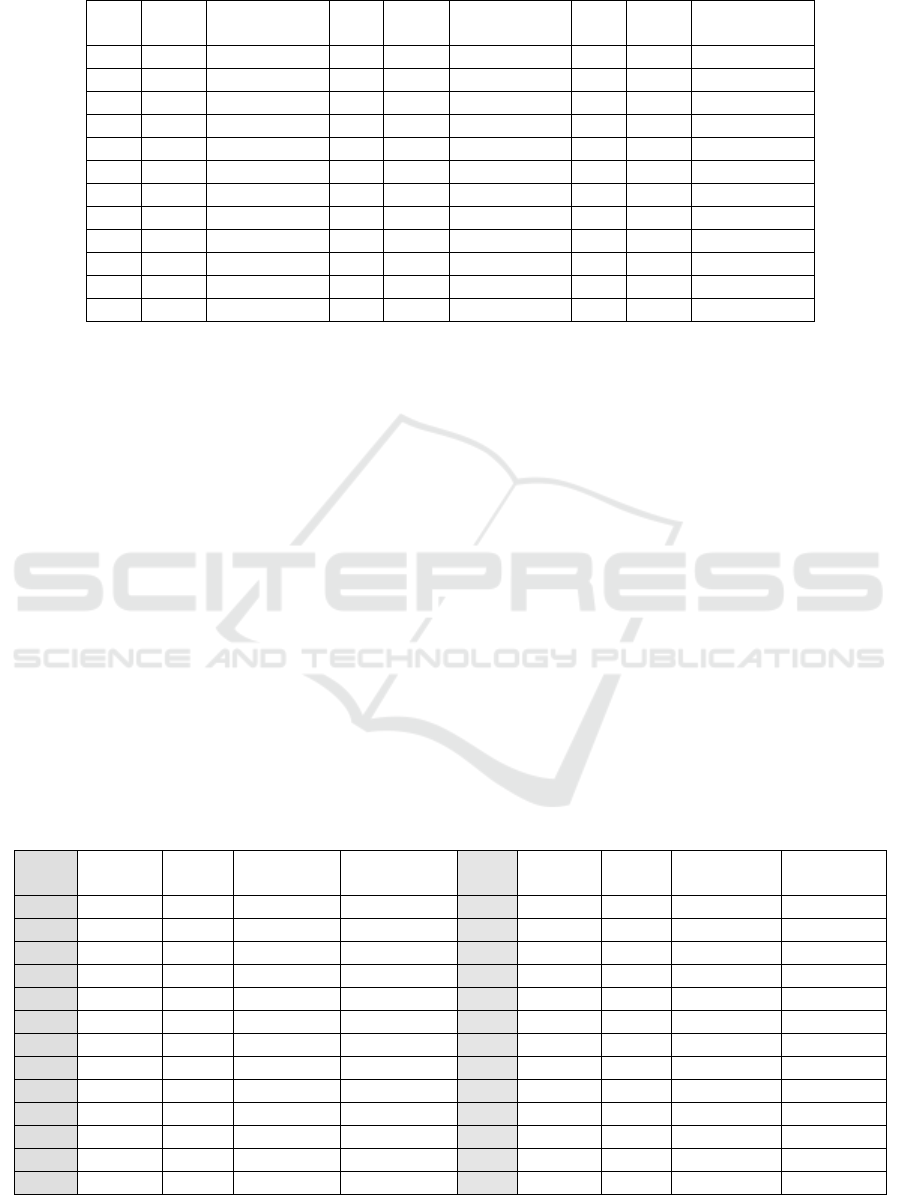
Table 1: Result of difficulty index.
No
Item
Index
(P)
Interpretation
No
Item
Index
Interpretation
No
Item
Index
Interpretation
1
85.40
Easy
13
52.48
Moderate
25
35.85
Moderate
2
84.04
Easy
14
67.74
Moderate
26
35.75
Moderate
3
84.90
Easy
15
53.51
Moderate
27
25.65
Difficult
4
82.48
Easy
16
64.39
Moderate
28
18.07
Difficult
5
80.88
Easy
17
65.10
Moderate
29
14.75
Difficult
6
85.16
Easy
18
49.45
Moderate
30
29.60
Difficult
7
73.60
Easy
19
68.35
Moderate
31
22.12
Difficult
8
67.05
Moderate
20
59.42
Moderate
32
15.74
Difficult
9
88.06
Easy*)
21
45.49
Moderate
33
33.85
Moderate
10
71.71
Easy
22
35.20
Moderate
34
18.24
Difficult
11
76.98
Easy
23
44.79
Moderate
35
24.11
Difficult
12
74.94
Easy
24
26.68
Difficult
36
7.077
Difficult
From the table 1 above calculation using three
categories, 11 problems are classified as easy
category (31%), 15 moderate (42%), and 10 problems
including difficult category (27%). The ideal problem
criteria, with the comparison between Easy: Medium:
and difficult is 1: 2: 1 or 25%: 50%: 25% almost
fulfilled; the criteria of the questions that included
moderate still more than the problem Easy and
difficult. When viewed from the provisions of a
progressive problem, the composition of the question
must be from Easy, Moderate and Difficult. However,
if viewed from the order of difficulty index based on
test results, progressive nature is not met ideally (not
progressive correct). It is recommended that if you
want to meet the ideal progressive criteria, there
should be a change in the sequence of questions based
on the level of difficulty. The results of this study are
the same as that of Subino (1984).
The results of research by Kpolovie and Emekene
(2016) in Nigeria using the Item Response Theory
(IRT) analysis technique show similar results. That
the items used have a balanced proportion of
difficulty.
4.2 Discrimination Index
To look at these differentiators, two approaches are
used: firstly using the superior-low group comparison
approach with the procedure: (a) test participants are
ranked by the highest to lowest score; (b) taken 25%
to 33% for each superior group and low (Izard, 1977).
(c) calculate how many people of the right group
answer the question, and how many correct groups of
correctors answer the same question. (d) calculate the
percentage of the difference in the number of correct
answers in the superior group of the low group. For
this purpose, 30% of the test takers for each group
were excelled and asor (Crocker, 1986). The results
of the calculation as follows.
Table 2: The calculation result of item discrimination index.
No
Item
Superior
Group
Low
Group
Discriminat
ion Index
Meaning
No
Item
Superior
Group
Low
Group
Discriminat
ion Index
Meaning
1
1447
1010
29.1
Enough
19
1299
645
43.6
Good
2
1469
856
40.9
Good
20
1266
477
52.6
Very Good
3
1469
909
37.3
Good
21
1186
252
62.3
Very Good
4
1450
876
38.3
Good
22
1029
418
40.7
Good
5
1450
832
41.2
Good
23
1062
236
55.1
Very Good
6
1458
1000
30.5
Good
24
754
180
38.3
Good
7
1355
806
36.6
Good
25
943
178
51.0
Very Good
8
1304
609
46.3
Good
26
860
239
41.4
Good
9
1484
1023
30.7
Good
27
758
146
40.8
Good
10
1456
501
63.7
Very Good
28
516
126
26.0
Enough
11
1460
647
54.2
Very Good
29
414
116
19.9
Enough
12
1437
588
56.6
Very Good
30
803
192
40.7
Good
13
1169
427
49.5
Very Good
31
668
109
37.3
Good
Validation of Advanced Progressive Matrices as a Instrument Intelligence Test in Indonesian Cultural Perspective
483
14
1396
509
59.1
Very Good
32
422
115
20.5
Enough
15
1214
387
55.1
Very Good
33
842
221
41.4
Good
16
1393
419
64.9
Very Good
34
566
103
30.9
Good
17
1320
553
51.1
Very Good
35
695
142
36.9
Good
18
1168
285
58.9
Very Good
36
171
71
6.7
Bad
From the table 2 above can be seen that the
discrimination index of each problem is included in
the category enough upwards except for the number
36 discrimination index is less. If there are 1 problem
with less discrimination index, 4 problems are good
enough, 18 problems have good discrimination index,
and 13 problems are very good. The results of this
study when it is compared with Subino (1984) have
similarities. That is the items about 29, 32 and 36 are
the matters with least discrimination index. Subino’s
analysis (1984: 239) on numbers 29 and 36 is “it
measures the intellectual process that is different from
other questions. Both of these questions, questioned
things that are not clear rules, more than other
intellectual demands from other questions. Number
29 poses the positions of three straight lines on the
unclear thing, and the number 36 poses an unknown
point in the thing of the point.”
The above approach by some experts is
considered unfavorable in testing the discrimination
index, since it only takes into account some
participants (superior groups and lowers only), some
are excluded. Therefore, the second approach is to use
biserial point correlation (rpbis) which correlates
between the answers or the score of each question
with the total score. The correlation test results are as
follows.
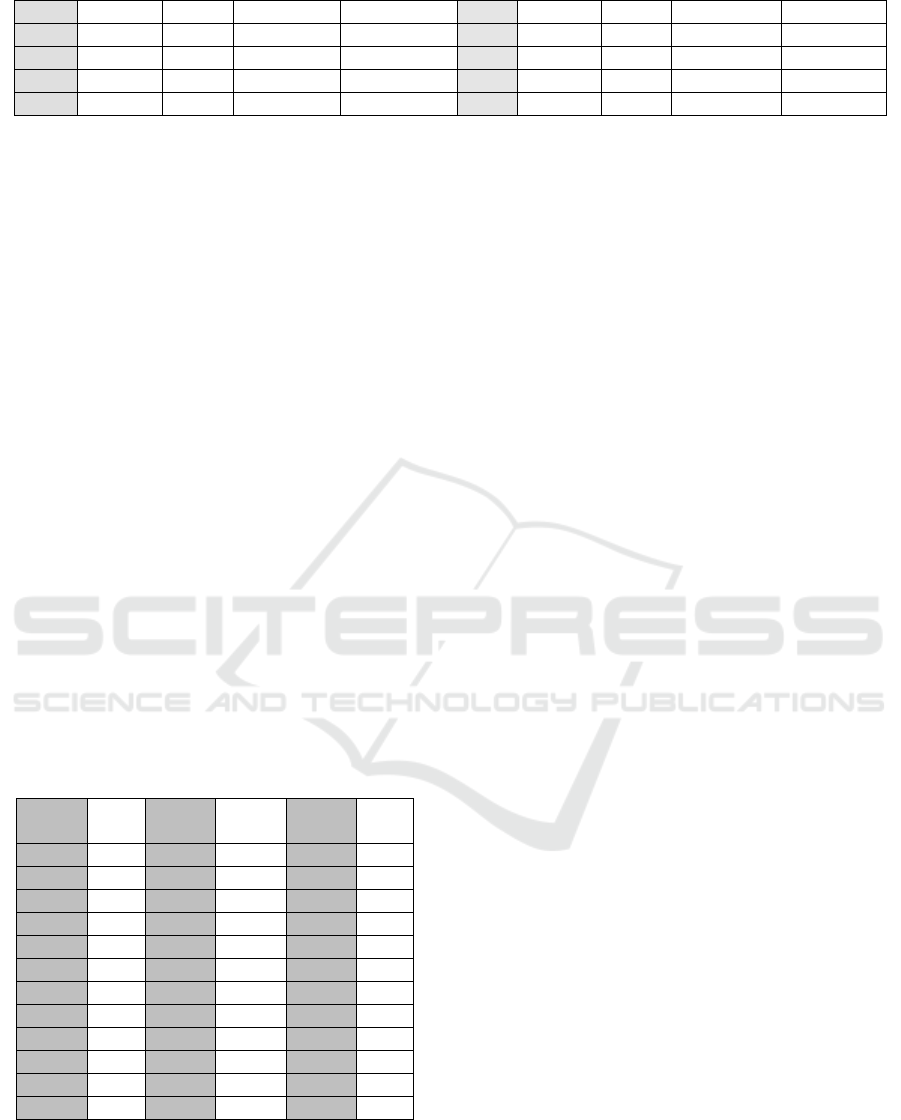
Table 3: The calculation of biserial point correlation
(discrimination index)
No
Item
rpbis
No
Item
r
pbis
No
Item
r
pbis
1
0.37
13
0.40
25
0.42
2
0.48
14
0.51
26
0.36
3
0.48
15
0.44
27
0.38
4
0.44
16
0.54
28
0.28
5
0.45
17
0.43
29
0.23
6
0.38
18
0.47
30
0.36
7
0.36
19
0.39
31
0.35
8
0.41
20
0.43
32
0.24
9
0.40
21
0.49
33
0.36
10
0.56
22
0.51
34
0.33
11
0.52
23
0.43
35
0.36
12
0.54
24
0.34
36
0.12
Based on the table 3, calculation of biserial point
correlation, it can be concluded that all questions have
sufficient discrimination index (rbis 0.30 and above),
except for 29, 32, 36, whose correlation index is
lower than 0.30. The same thing happened in Subino
research (1984), meaning that APM still has the same
ability as in 1984, not affected by the development of
society generally.
4.3 Distracter
The results of the analysis of the distractor on each
question (36 questions with each of the eight choices),
using the formula Index Distracter (IPc) from Karno
To (2003), it can be concluded that almost on each
question there is a very bad or bad. Very bad criteria
here are too many selectors selected by respondents
(over 200%, after all the wrong responders are
divided by the number of wrong choices / ideal choice
then divided by all voters, otherwise the percentage is
too small, below 25%). However, if using another
criterion (e.g. criterion of Izard, 1977) where a
distractor is said to be dwarf (not working) if the
distractor is never selected by the respondent at all.
By using this criterion, no distracter is found that
nobody has chosen (zero distributed). In other words,
there is no such degradable distractor, all the
distractors in all questions can be said to "work".
4.4 Discussion
Test results may be used to draw conclusions or
decisions, whether with respect to the individual
tested or in respect of the test instrument itself. If
related to the person tested, it will deal with the inner
person's attributes (inner conditions: talent quality,
intelligence level, and other psychological attributes)
and or learned learning competencies (Naglieri and
Goldstein, 2009), which function as predictors in
decision making (placement, diagnosis, etc.). If
associated with the instrument, it will show the
quality of the instrument (Nitko, 1996). In other
words, to make the right decisions, the data obtained
must be consistently depicted (valid), so that the
decision is fair and not wrong or biased (Crocker and
Algina, 1986: 377) , and to get data that actually
describes the individual being tested, the quality of
the test should be sufficient.
Referring to the results of the above study, it can
be concluded that the APM test - judging by the
quality of its items (discrimination, difficulty, and its
distracters) - has qualified as a good test. Therefore,
the results of the APM test can be used as the basis
for making decisions about the quality of one's
ICES 2017 - 1st International Conference on Educational Sciences
484

intelligence. The consequences must be kept in a
professional manner, so as not to be biased and the
quality changes, (Izard: 1977).
Related to the bias of the test, according to Hays
(2013: 62-63) there are two categories of bias sources,
namely (1) the bias associated with the test content is
referring to "inappropriate selection of test item or
general content coverage, and (2) response process
that refers to "situations when item elicit responses
not intended by the test, called a response set. One of
the causes of the bias that comes from the test itself is
the difficulty level of item difficulty (Crocker and
Algina, 1986: 388). Problems that are too difficult or
too easy so that everyone is wrong or everyone is
right, does not give any benefit to decision making
(Subino, 1987).
APM is a non-verbal test that is free from
impaired ability to use verbal language. Ravens
(2011: 8) says that "... APM is a nonverbal assessment
tool is designed to measure an individual's ability to
perceive and think clearly, make meaning out of
confusion and formulate new concepts when faced
with novel information". So this test is structured to
measure the ability to think clearly, which by Subino
(1984: 9) is said as the efficiency of intellectual work,
which will determine the success or failure of a
person in learning; which is demonstrated by learning
easily, quickly, and appropriately. Because doing this
test requires intellectual work efficiently, then people
who are carelessly clear results will be bad.
On the other hand this test is said to be free of
cultural influences, language-free; because it is in the
form of drawing design, in any region or region of
people reading or interpreting the image, so according
to the language in itself (Anastasi, 1988; Naglieri
2009). However Matsumoto (2008: 135-136) says
there is no free test from cultural influence
(intelligence tests were biased and did not accurately
measure the mental ability of people from different
cultures). It is further said that: "... There are ethnic
group differences in measured intelligence (although
the ethnic groups scoring low on the standard tests
change across time). The average score of some
minority groups in the United State are 12 to 15
percentage point lower than the average for European
Americans”. It does not mean that no one is good at
the group, but generally lower. The low achievement
of scores in minority groups may not be due to their
lack of potential but due to other factors that make
their potential un actualized. As in Indonesia, in some
schools students do not want to be invited to think
higher or lazy to face a more difficult problem, yet
nothing likes to say "dizzy". This is a culture that can
make scores in tests low, distractors become ugly, due
to the influence of poor ways of thinking. Therefore,
in the 2013 curriculum it is said that the very thing
that needs to be changed from the teachers is the
wrong mindset.
Based on Subino's research (1984: 241-242) the
questions on APM 90.7% contain the "g" factor,
which Freeman (1965) measured the logical
relationship of non-verbally stated things. To work on
these APM problems, a person is required to be able
to think in an integrated, abstract, and comparative
analysis. Such a pattern of thought is a show of
intellectual acts that must be done as efficiently as
possible (within a limited time). That's why APM is a
test that measures the efficiency of intellectual work.
The rest (9.3%) measures the "s" factor derived from
learning and experience. This means the model
questions that measure the factor "s" is, is a problem
found by the test in learning and everyday life.
To obtain complete information, what factors
influence the achievement of one's APM score,
Matsumoto and Juang (2008) suggests linking it to
school qualifications, age, ideals, home conditions
(family), sex, shelter, (number of siblings), and the
way of learning.
5 CONCLUSIONS
The results of the Ravens Advanced Progressive
Metrices (RAPM) intelligence measurement tool
have met the requirements of good tests. The results
showed that from the difficulty index, the problems
developed had a balanced percentage of items among
easy, moderate, and difficult questions; each question
has a good homogeneity index, the discrimination
index of each question is generally capable of
distinguishing between smart and unintelligent
people, and the choices of answers have functioned
well (no choice is never unselected). In the
discrimination index, RAPM still does not have a
perfect progressive differentiator.
After the requirements of a good test (metric) are
met (validity, differentiation, difficulty, and analysis
are analyzed) then the data obtained will be assured
of its validity, and the test can be used for decision
making. But on the other hand, the thing that will
make the scores obtained a "bias" in the interpretation
is a matter of norm. Therefore the next study is the
adjustment of norms with the sample groups, age, and
sex. As suggested by the Age, Colom, Rebollo, and
Escorial (2004).
REFERENCES
Abad, F., Colom, R., Rebollo, I., Escorial, S., 2004. Sex
Differential Item Functioning in Raven’s Advanced
Validation of Advanced Progressive Matrices as a Instrument Intelligence Test in Indonesian Cultural Perspective
485

Progressive Matrices: Evidence for Bias, Personality
and Individual Differences 3620041459-1470:
Pergamon.
Anastasi, A. 1988. Psychological Testing, Sixth Edition,
New York: Macmillan Publishing Company
Babcock, R. l., 1994. Analysis of Adult Age Differences on
Raven's Advanced Progressive Matrices Test, Journal
of Psychological and Aging, vol. 9 No.2, 303-314: The
American Psychological Association.
Brouwers, S. A., van de Vijver, Fons, van Hemer, D. A.
2009. Variation in Raven’s Progressive Matrices Scores
across Time and Place: Learning and Individual
Differences, 193 330-338.
Crocker, L., Algina, J., 1986. Introduction to Classical and
Modern Test Theory, New York: Holt, Rinehart, and
Winston Inc.
Drummond, R. J., Jones, K. D., 2010. Assessment
Procedures for Counselors and Helping Professionals,
7th Edition, Boston: Pearson
Ercole, J., 2009. "Labeling in the Classroom: Teacher
Expectations and their Effects on Students' Academic
Potential" 2009 Honors Scholar Theses. 98.
Hays, D. G. 2013. Assessment in Counseling: A Guide to
Use of Psychological Assessment Procedures. Fifth
edition. New York: Library of Congress Cataloging in
Publication Data
Izard, J. F. 1977. Construction and Analysis of Classroom
Tests. The Australian Council for Educational Research
Limited: Hawthorn, Victoria: Australia.
Kpolovie, P.J., Emekene, C.O. 2016 Item Response Theory
Validation of Advanced Progressive Matrices in
Nigeria, British Journal of Psychology Research, vol.4
No. 1 pp. 1-32.
Matsumoto, D., Juang, Linda, 2008, Cultural and
Psychology, Fouth Edition, Belmont: Thomson High
Education
Murphy, Kevin R., Davidshofer, Charles O. 1988.
Psychological Testing: Principle and Applicaations.
Fourt Edition. New York: Macmillan Publishing
Company.
Nitko, A. J., 1996, Educational Assessment of Student,
second edition, New Jersey: Merrill, an imprint of
Prentice Hall
Naglieri, J. A., Goldstein, S. 2009. Practitioners Guide To
Assessing Inteligence and Achievement. New Jersey:
John Wiley and Sons
Raven, J. C. 2000. The Raven’s Progressive Matrices:
Change and Stability over Culture and Time, Cognitive
Psychology 41, 1-48.
Raven, J.C. 2011. Raven’s Advanced Progressive
Matrices:International Technical Manual. U.K.:
Pearson. Inc. All rights reserved.
Richardson, K., Norgate, S.H. 2015, Does IQ Really Predict
Job Performance? Applied Developmental Science,
19:3 153-169.
Rimm, S. B. 2000.Why Bright Kids Get Poor Grade.
Mengapa Anak Pintar Memperoleh Nilai Buruk. alih
bahasa A. Mangunhardjana. Jakarta: PT. Grasindo
Shakeel, M.K., Gogkari, V.M. 2017, Measuring Fluid
Intelligence in Healthy Older Adhult, Journal of Aging
Research, Vol 2017, Article ID: 8514582, 6 page
Subino, H. 1984. Analisis terhadap Kecocokan APM bagi
Siswa-siswa Kelas I SMA Dikaitkan dengan Beberapa
Faktor yang Melatarbelakangi Kehidupannya.
Disertasi. Bandung: Sekolah Pasca Sarjana IKIP
Bandung.Tidakditerbitkan
Subino, H. 1987. Konstruksi dan Analisis Tes: Suatu Pengantar
Kepada Teori Tes dan Pengukuran. Jakarta: P2LPTK
Sukardi, D. K, Kusmawati, N. 2009. Analisis Tes Psikologis
Teori dan Praktek dalam Penyelenggaraan Layanan
Bimbingan dan Konseling di Sekolah. Jakarta:
RinekaCipta.
Sunarya, Y. 2015. Kontribusi Faktor Intelektual dan Non-
Intelektual terhadap Kesuksesan Belajar di SMA,
Disertasi, Universitas Pendidikan Indonesia
Suryabrata, S. 1999. Pengembangan Alat Ukur Psikologis.
Jakarta: Direktorat Jenderal Pendidikan Tinggi
Departemen Pendidikandan Kebudayaan.
Surya, M. 1983. Pengaruh Faktor-Faktor Non Intelektual
Terhadap Gejala Berprestasi Kurang. Jakarta:
Depdikbud. DirjenDikti
Wright, A. J., 2011. Conducting Psychological Assessment:
A Guide for Practitioners, New Jersey: John Wiley and
Sons, Inc.
ICES 2017 - 1st International Conference on Educational Sciences
486
