
Influence of Fatigue on Balance and Lower Limb Muscles Activity in
Flatfoot Children
Riza Adriyani
1
, Tommy Apriantono
1
, and Suprijanto Suprijanto
2
1
Sports Science Department, Postgraduate Programs, Institut Teknologi Bandung, Indonesia
2
Instrumentation and Control Research Group, Institut Teknologi Bandung, Indonesia
ariyaniriza@gmail.com
Keywords: Fatigue, foot posture, median frequency, static balance.
Abstract: Fatigue could lead to excessive eversion and affect static balance. This study was aimed to find out the
influence of foot posture and jumping fatiguing effect on static balance and muscle activity of lower limb
muscles. Methods: 19 elementary school children aged 9 to 11 years took part in this study. Of these all
children, 10 had normal foot and 9 had flatfoot which was classified by their foot posture. Foot posture was
measured based on arch index of footprint by a foot scanner. Surface electromyography (EMG) activity was
recorded from tibialis anterior, gastrocnemius medialis and peroneus longus muscles while participants were
standing on one leg barefoot with opened eyes. Results: Normal foot had arch index 0.25±0.01 whereas
flatfoot had 0.36±0.01. Statistical analysis showed that fatigue could influence static balance in flatfoot
children (p < 0.05). Based on electromiographic data, there were no significant differences on median
frequency of lower limb muscles between both groups. After fatigue, median frequency (MF) timing was
significantly different (p < 0.05) on tibialis anterior and peroneus longus. MF timing showed earlier in
flatfoot. Conclusion: Fatigue influenced static balance and tended to appear earlier on lower limb muscles in
flatfoot children.
1 INTRODUCTION
Plantar arch development is observed before the age
of six and then children will had characteristics
features of adult feet (Hennig et al., 1994). This
development affected by various factors such as
internal (age, sex, genetic) and external factors (age
at which closed shoe wearing begins, body
composition and physical activity level) (Halabachi
et al., 2013; Mortazavi et al., 2007). Most of the
flatfoot are flexible, asymptomatic and physiologic.
Early closed shoes wearing in children may lead to
flatfoot because it could influence foot motion and
ligament laxity which lead to lowering the arch
height (Abolarin et al., 2011). Furthermore, excessed
body weight on children also lead to the impairment
of foot functional status (Krul et al., 2009).
High impact sports need an efficient foot posture
for shock absorption, generating and transfering the
energy. Variations of foot posture could be at high
risk for overuse injuries after doing repetitive
athletic tasks (Queen et al., 2007). Flatfoot is at high
risk of ankle injury while participating in high
impact sports because of its high intensity and
frequent foot contacts with hard surface (Cain et al.,
2007). Flatfoot children will get muscle fatigue and
pain earlier on their lower extremity compared to
normal foot children because higher muscle activity
is needed to stabilize tarsal transversal and subtalar
joint to reduce load on medial longitudinal arch. If
muscles become fatigue, the injury risk may increase
due to increased strains and bending moments
because muscles cannot absorb high impact and fail
to protect bones from tension (Mosca V. S., 2010).
There is still controversy about physical
performances in flatfoot. Tudor et al found that static
balance performances was similar between flatfoot
and normal foot children (Tudor et al., 2009), but
another studies found poorer physical performances
in flatfoot compared to normal foot (Marginson et
al., 2005; Roohi et al., 2013). Several researches
have shown correlations between flatfoot and their
functional limitation while running and walking
mostly on adults. There has been no study to find out
fatigue’s effect on static balance and lower limb
muscles activity in children. Therefore, we would
like to know whether fatigue was the one factor that
influenced physical performances in flatfoot
Adriyani, R., Apriantono, T. and Suprijanto, S.
Influence of Fatigue on Balance and Lower Limb Muscles Activity in Flatfoot Children.
In Proceedings of the 2nd International Conference on Sports Science, Health and Physical Education (ICSSHPE 2017) - Volume 1, pages 5-11
ISBN: 978-989-758-317-9
Copyright © 2018 by SCITEPRESS – Science and Technology Publications, Lda. All rights reserved
5
children. We have hypothesized that fatigue will
influence static balance and lower limb muscles
activity in flatfoot compared to normal foot children.
2 METHODS
2.1 Participants
19 elementary school children aged 9 to 11 years
took part in this study. Of these all children, 10 had
normal foot (8 males and 2 females) and 9 had
flatfoot (5 males and 4 females) with unknown
pathologies were recruited to take part in this study
(Table 1).
Ethics approval was obtained from the
Polytechnic of Health, Ministry of Health, Research
Ethics Committee (ID:LB.02.1/3.1/0260/2015).
Details of the study procedure were presented, and
consent was obtained from parents before children
participated in the study.
2.2 Screening Protocol
Foot scanner was used to categorize foot posture.
Foot posture was classified using arch index as a
clinical measurement from footprint analysis with
AUTOCAD 2013 software. Each foot was placed on
foot scanner while participants were standing. Only
one foot from was included in the data analysis
where we categorized the “the flatter foot” into the
flatfoot group
To qualify for the flatfoot group, participants had
arch index greater than two standard deviations from
the mean values obtained for the normal foot group.
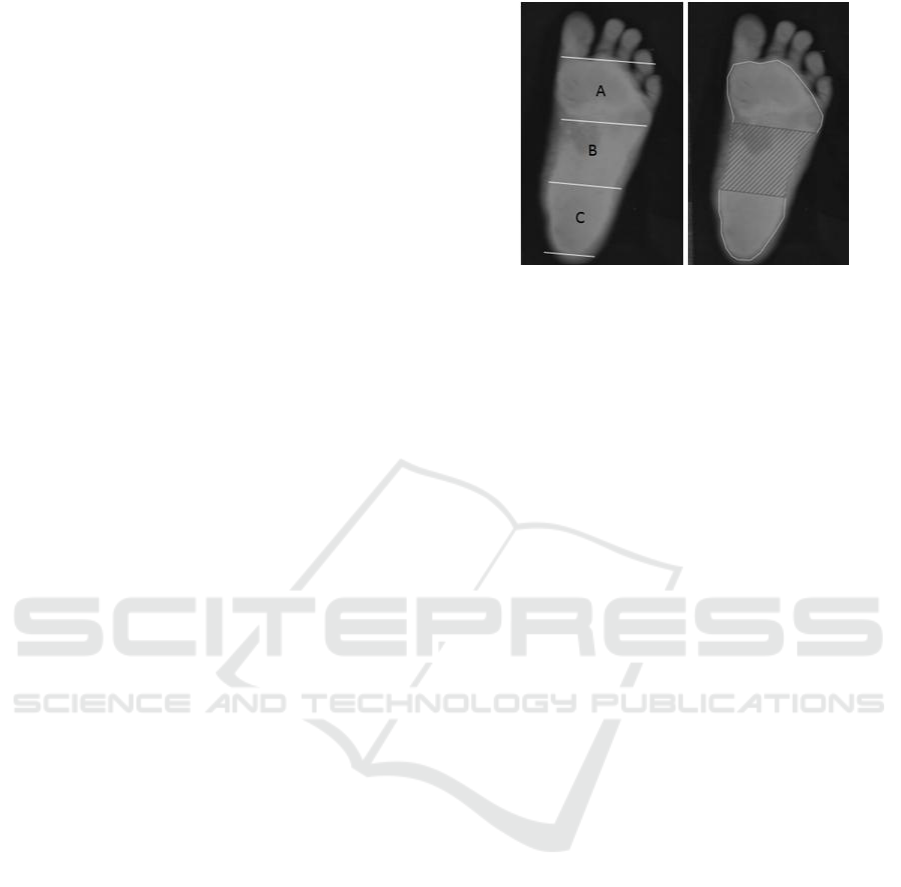
Figure 1 represents the arch index measurements
from the footprint. Based on the arch index, we
divided participants into flatfoot and normal foot
group.
Figure 1(a) Figure 1(b)
Figure 1: Footprint of flatfoot child where the length of the
foot (excluding the toes) is divided into equal thirds to
give three regions: A -- forefoot; B -- midfoot; and C --
heel. Arch index is then calculated by dividing the midfoot
region (B) by the entire footprint area (Arch index =
B/[A+B+C] (Figure.1a). We used AUTOCAD 2013
software to calculate the arch index (Figure.1b).
2.3 Experimental Protocol
All participants completed the entire protocol in a
single session. Pre fatigue data collection consisted
of measurements of body mass index, body fat
percentage, vertical jump test, static balance test,
and electromyographic (EMG) activity while
performing static balance test. Post fatigue data
collection consisted of vertical jump test, static
balance test, EMG activity while performing static
balance test. During trials, the participants were
instructed to perform static balance test and
electromyographic data was collected. Each test was
performed two times and separated by a 3 minutes
rest period. Only the best result will be included in
the statistical analysis.
2.3.1 Body Mass Index
Body height and body weight were measured using
ZT 120 health scale. The weight was recorded to the
nearest 0,1 kg and the height was also recorded to
the nearest 0,01 m. Body mass index was calculated
for each subject by dividing the weight by the square
of the height. We used WHO AnthroPlus software to
assess body mass index.
2.3.2 Body Fat Percentage
The measurement site was on triceps and calf at the
right part of the body using skinfold calliper. Test
was performed two times. The result was an average
ICSSHPE 2017 - 2nd International Conference on Sports Science, Health and Physical Education
6
values of these two trials. Slaughter Lohman
Formula was used to calculate body fat percentage.
Figure 2 (a) Figure 2 (b)
Figure 2: Measurement site of body fat percentage on
triceps (Figure. 2a) and calf (Figure. 2b).
2.3.3 Vertical Jump Test
This test was performed on vertical jump meter. The
task was to perform two maximal eccentric-
concentric jumps with hands held at the hips along
the test. A single jump started with straight legs
performing a natural flexion before the take off
phase. We only took the best results from two trials.
2.3.4 Static Balance Test
Participants performed single limb standing test
barefoot for 30 seconds with opened eyes. The non
support limb was held flexed 90
0
at the knee but not
contacting the supporting limb muscles while their
hands were placed on the hips. The goal of the test is
to stand on static position for maximum 30 seconds.
Weight shifting and/or equilibrium reactions in the
feet are acceptable. These timed trials should be
stopped if the supporting limb moves in a space or
the non support limb touches the support limb. The
result was the best performed of these two trials.
2.3.5 Electromyographic Activity
Tibialis anterior, gastrocnemius medialis and
peroneus longus muscles activity were recorded
using bioamplifier with the use of pediatric soft-
cloth electrodes which was more comfortable for
child skin. An inter-electrode distance was 10 mm.
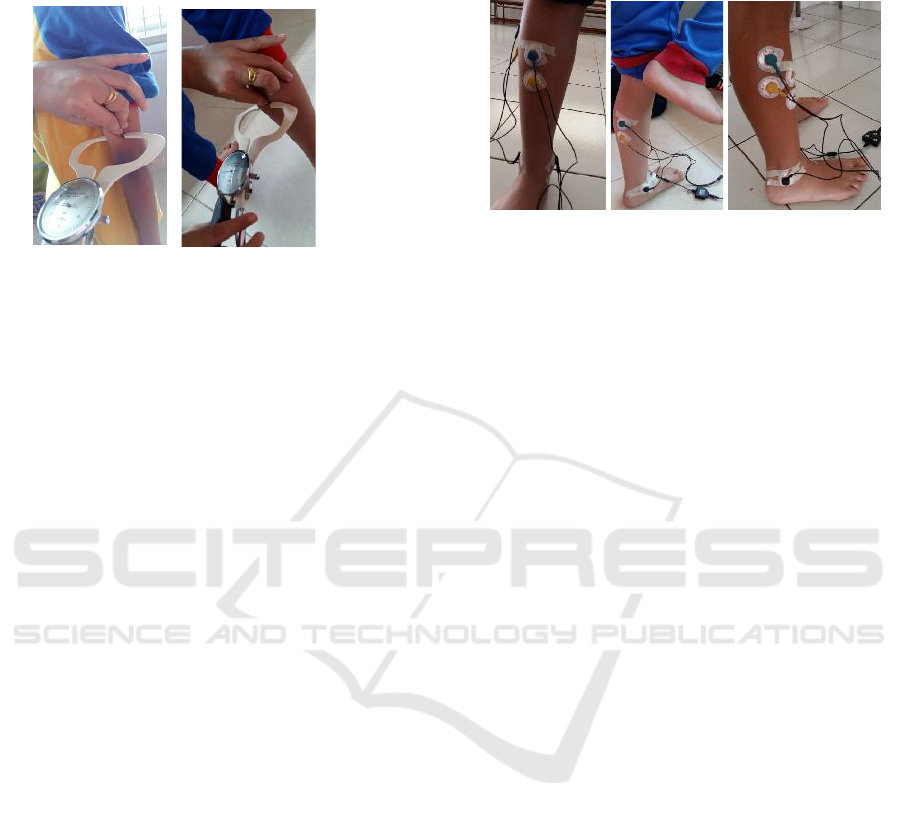
The placement of surface electrodes followed the
recommendation of SENIAM (www.seniam.org).
Reference electrodes for tibialis anterior and
gastrocnemius medialis were placed on malleolus
medial and reference electrode for peroneus longus
was placed on malleolus lateral (Figure 3).
Figure 3(a) Figure 3(b) Figure 3(c)
Figure 3: The placement of electrodes on tibialis anterior
(a) gastrocnemius medialis (b) and peroneus longus (c).
2.3.6 Fatigue Protocol
Participants completed plyometric jumping fatiguing
protocols (Marginson et al., 2005). Before testing,
each participant followed a standardized warm-up. It
consisted of five submaximal and five maximal
continuous jumps. After warming up, the
participants performed eight sets of 10 continuous
maximal plyometric jumps.
The participants stood with feet shoulder width
apart and hands on hips. They were asked to jump as
high as possible and each jump was performed as
fast as possible.
Each set of the 10 jumps was separated by one
minute rest period, in which the participant was still
walking around to reach fatigue’s effect.
2.3.7 EMG Data Processing
During the static balance test, raw EMG signal was
passed through a differential amplifier at a gain of
1000 with the sampling frequency of 2 kHz. A band
passed filter of 512 Hz for the surface electrodes.We
used three channels of 2048 samples/seconds for
each muscle recording.
Encoder samples the incoming signals, digitizes,
encodes, and transmits the sampled data to the TT-
USB interface unit.
A fiber optic cable was used for transmission to
the TT-USB, providing maximum freedom of
movement and electrical isolation. Myoscan sensor
connected each electrode set to EMG encoder.
The raw EMG signal of the selected lower limb
muscles between pre fatigue and post fatigue were
analysed every 2 seconds to get power spectrum
profile. Median frequency was used as a parameter
for muscle fatigue which divided power spectrum
Influence of Fatigue on Balance and Lower Limb Muscles Activity in Flatfoot Children
7

into two equal parts. Median frequency timing was
also analysed for each muscle.
2.3.8 Statistical Analysis
Shapiro wilk test was used for data distribution. The
statistical analysis was chosen based on
compatibility with the measure scale. We used a
parametric test or non parametric test which was
based on data distribution.
To show differences between pre fatigue and
post fatigue t-dependent tests were used, where
independent samples t-tests were used to show
differences between flatfoot and normal foot with p
value less than 0.05 considered significant.
3 RESULTS
Table 1: Participants Anthropometric and Foot Posture
Characteristics.
General
Anthopometric
Flatfoot
N=9
Normal
Foot
N=10
p
value
Gender Ratio
5/4
8/2
(Male/Female)
Age (Mean±SD)
Years
9.89 ±
0.60
10.10 ±
0.88
0.538
Height (Mean±SD)
Cm
134.06 ±
6.32
140.50 ±
9.7
0.108
Weight (Mean±SD)
Kg
33.11 ±
7.25
34.00 ±
8.46
0.810
BMI (Mean±SD)
Kg/m
2
18.26 ±
2.94
17.26 ±
4.48
0.579
Body Fat Percentage
(Mean±SD) %
28.38 ±
6.52
27.85±
6.12
0.855
Foot Posture
Characteristics
Arch Index
(Mean±SD)
0.36 ±
0.01
0.25 ±
0.01
0.000*
*Significantly different p value < 0.001
There were no significant differences for
anthropometric characteristics between flatfoot and
normal foot groups. Body composition (body mass
index and body fat percentage) between flatfoot and
normal foot was almost equal. However, foot
posture was shown significantly different (p < 0.05)
in both groups (Table 1).
Table 2: Physical Fitness Profile between Flatfoot and Normal Foot.
Physical fitness
Pre fatigue
p value
Post fatigue
p value
Flatfoot
Normal foot
Flatfoot
Normal foot
Static balance
(mean±SD) seconds
27.44 ± 4.61
29.80 ± 0.63
0.188
21.67 ± 8.66
29.10 ± 2.23
0.020*
Vertical Jump
(mean ± SD) cm
34.00 ± 6.8
29.00 ± 5.68
0.873
33.60 ± 3.59
29.60 ± 3.02
0.774
*Significantly different p value < 0.05
Based on physical fitness profile, there were
significant differences on static balance
performances between both groups at post fatigue
condition (p< 0.05) (Table 2).
Table 3: Median Frequency (MF) of Selected Lower Limb Muscles between Flatfoot and Normal Foot.
Lower limb muscles
Pre fatigue
p valueP
Post fatigue
p value
Flatfoot
Normal foot
Flatfoot
Normal foot
MF tibialis anterior
(Hz)
78.71 ± 23.31
90.77 ± 37.38
0.902
88.86± 45.50
99.86 ± 50.64
0.806
MF gastrocnemius
medialis (Hz)
90.12 ± 35.88
90.90 ± 23.09
0.327
91.35 ± 37.83
85.18 ± 30.16
0.870
MF peroneus longus
(Hz)
120.52 ± 38.60
98.57 ± 44.28
0.221
104.62 ± 39.83
110.73 ± 78.98
0.806
*Significantly different p value < 0.05
Decreased median frequency of lower limb
muscles (tibialis anterior, gastrocnemius medialis
and peroneus longus muscles) showed no
differences between both groups (Table 3).
ICSSHPE 2017 - 2nd International Conference on Sports Science, Health and Physical Education
8

Table 4: Median Frequency (MF) Timing of Selected Lower Limb Muscles between Flatfoot and Normal Foot.
Lower limb
muscles
Pre fatigue
p valueP
Post fatigue
p value
Flatfoot
Normal foot
Flatfoot
Normal foot
MF timing of
tibialis anterior
(seconds)
16.44 ± 10.52
10.8 ± 8.12
0.234
6.89 ± 5.57
14.0 ± 9.04
0.054*
MF timing of
gastrocnemius
medialis (seconds)
10.44 ± 8.11
17.2 ± 6.47
0.060
9.33 ± 7.07
14.2 ± 8.66
0.201
MF timing of
peroneus longus
(seconds)
14.44 ± 10.76
13.2 ± 9.24
0.790
5.78 ± 4.17
12.4 ± 7.7
0.033*
*Significantly different p value < 0.05
Median frequency timing of tibialis anterior,
gastrocnemius medialis and peroneus longus were
appeared earlier (at 6,9,5 seconds) in flatfoot
compared to normal foot children (at 14,14,12
seconds) at post fatigue. It showed significant
differences on median frequency timing of tibialis
anterior and peroneus longus (p<0.05) in flatfoot
compared to normal foot, but there were no
significant differences for gastrocnemius medialis
(Table 4).
4 DISCUSSION
Anthropometric characteristics were almost equal in
both groups. Flatfoot children were shorter than
normal foot children. We found that body mass
index and also body fat percentage had no
differences in both groups. These findings is in
contrast to another studies (Chang et al., 2010; Cetin
et al., 2011). In this study, there was no body size
effect on physical performances in both groups.
Prevalence of flatfoot is higher in males than in
females (Abolarin et al., 2011; Chang et al., 2010;
Ezema et al., 2014; Mickle et al., 2011; Wozniacka
et al., 2013), and it is also similar to findings of our
study.
Arch index of the participants was determined
with inclusion value for clinical measurements
(Murley et al., 2009). Arch index is most repeatable
and have a high correlation with arch height value
(Queen et al., 2007).
The arch index value of children was higher than
young adults in a previous study conducted by
Murley et.al (Murley et al., 2009). In this study, we
chose the “flatter foot” for flatfoot group to get the
best comparison with normal foot.
This study would like to find out the influence of
foot posture and fatigue on static balance and EMG
activity of selected lower limb muscles. At pre
fatigue condition, our findings were similar to Tudor
et.al (Tudor et al., 2009) which showed no
differences on physical performances such as static
balance and vertical jump between flatfoot and
normal foot children. In the other hand, several
researches (Roohi et al., 2013; Marginson et al.,
2005) showed poorer performances in flatfoot
children.
Our findings gave an explaination about the
controversial findings in static balance performances
between flatfoot and normal foot in previous studies.
We investigated the effect of fatigue on physical
performances in both groups. The results revealed
that fatigue was one factor which influenced static
balance in flatfoot children. Lack of stability in
flatfoot was in agreement with Tsai et.al (Tsai et al.,
2005) where flatfoot had greater displacement in
anterior posterior direction as a mechanism to their
poorer postural stability.
The fatigue protocol using plyometric jumping
fatiguing protocols (Marginson et al., 2005) could of
reach fatigue’s effect in both groups. It was shown
on significantly decreased vertical jump
performances between pre fatigue and post fatigue.
Muscle fatigue are measured through EMG
signal. Decreased median frequency and greater
percentage of maximum amplitude are the parameter
of fatigue condition on muscles. During static
balance trials, decreased median frequency of lower
limb muscles showed no differences between pre
fatigue and post fatigue in both groups. These
findings are in contrast to Murley et.al (Murley et
al., 2009) which showed a greater percentage of
maximum amplitude for tibialis anterior in flatfoot
compared to normal foot. This might be caused to
the fact that mean aged of these children were 10
years which were less competent at the task of
balancing on one limb (Mickle et al., 2011), so both
groups can’t maintain their balance well.
Influence of Fatigue on Balance and Lower Limb Muscles Activity in Flatfoot Children
9

However, median frequency timing of the
selected lower limb muscles were showed earlier in
flatfoot children. It gave the facts that flatfoot
children experienced fatigue earlier compared to
normal foot children. It seemed significant for
median frequency timing of tibialis anterior and
peroneus longus because they worked harder to
stabilize the subtalar joint. These findings is similar
with Neptune et al (Neptune et al., 1999) where
tibialis anterior and peroneus longus had to work
harder to limit excessive subtalar joint rotation in
order to prevent ankle injuries. Everted and
dorsiflexed foot will stretch the invertor muscles
(tibialis anterior) and plantarfleksor groups
(peroneus longus) during weight bearing position.
This study may have implications when choosing
an appropriate sport type for flatfoot children in
order to prevent earlier fatigue in flatfoot children
that might lead to injury because of the impairment
of static balance. These findings are in agreement
with the importance of strengthening exercise on
inversion muscles (tibialis anterior) and peroneus
longus in flatfoot children.
5 CONCLUSION
Fatigue influenced static balance and tended to
appear earlier on lower limb muscles in flatfoot
children. It should take into consideration when
flatfoot children get involved in high impact sports.
Further research might needed to investigate the
influence of foot posture and fatigue on static
balance in children over 11 years to get better
comparison because balance slowly improves until
10 years of age.
REFERENCES
Abolarin, T., Aiyegbusi, A., Tella, A., Akinbo, S., 2011.
Predictive factors for flatfoot: The role of age and
footwear in children in urban and rural
communities in South West Nigeria. The Foot, 21.
p. 188–192.
Cain, L. E., Nicholson, L. L., Adams, R. D., Burns, J.,
2007. Foot morphology and foot/ankle injury in indoor
football. Journal of Science and Medicine in Sport, 10.
p. 311-319.
Cetin, A., Sevil, S., Karaoglu, L., Yucekaya, B., 2011.
Prevalence of flatfoot among elementary school
students, in rural and urban areas and at suburbs in
Anatolia. Eur J Orthop Surg Traumatol, 21. p. 327-
331.
Chang, J. H., Wang, S. H., Kuo, C. L, Shen, H. C., Hong,
Y. W., Li, L. C., 2010. Prevalence of flexible flatfoot
in Taiwanese school-aged children in relation to
obesity, gender, and age. Eur J Pediatr, 169. p. 447–
452.
Ezema, C. I., Abaraogu, U. O., Okafor, G. O., 2014. Flat
foot and associated factors among primary school
children: A cross-sectional study. Hong Kong
Physiotherapy Journal, 32. p. 13-20.
Halabchi, F., Mazaheri, R., Mirshahi, M., Abbasian, L.,
2013. Pediatric flexible flatfoot; clinical aspects and
algorithmic approach. Iran J Pediatr, 23. p. 247-260.
Hennig, E. M., Staats, A., Rosenbaum, D., 1994. Plantar
pressure distribution patterns of young school children
in comparison to adults. Foot ankle Int, 15. p. 35-40.
Krul, M., Van der Wouden, J. C., Schellevis, F. G.,
Suijlekom, L. W. A., Koes, B. W., 2009.
Musculoskeletal problems in overweight and obese
children. Annals of Family Medicine,7.
Marginson, V., Rowlands, A. V., Gleeson, N. P., Eston R.
G., 2005. Comparison of the symptoms of exercise-
induced muscle damage after an initial and repeated
bout of plyometric exercise in men and boys. J Appl
Physiol, 99. p. 1174 –1181.
Mickle, K. J., Cliff, D. P., Munro, B. J, Okely, A. D.,
Steele, J. R., 2011. Relationship between plantar
pressures, physical activity and sedentariness among
preschool children. Journal of Science and Medicine
in Sport, 14. p. 36–41.
Mickle, K. J., Munro, B. J., Steele, J.,R., 2011. Gender and
age affect balance performance in primary school aged
children. Journal of Science and Medicine in Sport,
14, p. 243-248.
Murley, G. S., Menz, H. B., Landorf, K. B., 2009. A
protocol for classifying normal- and flat-arched foot
posture for research studies using clinical and
radiographic measurements. Journal of Foot and
Ankle Research, 2.
Murley, G. S., Menz, H. B., Landorf, K. B., 2009. Foot
posture influences the electromyographic activity of
selected lower limb muscles during gait. Journal of
Foot and Ankle Research, 2(35).
Mortazavi, S. M., Espandar, R., Baghdadi, T., 2007.
Flatfoot in children: how to approach. Iran J Ped, 17.
p. 163-170.
Mosca, V. S., 2010. Flexible flatfoot in children and
adolescents. J Child Orthop, 4. p. 107–121.
Neptune, R. R., Wright, I. C., Van Den Bogert, A. J.,
1999. Muscle coordination and function during cutting
movement, Medical Science Sports Exercise, 31(2). p.
294-302.
Queen, R. M., Mall, N. A., Hardaker, W. M., Nunley, J.
A., 2007. Describing the medial longitudinal arch
using footprint indices and a clinical grading system.
Foot Ankle Int, 28. p. 456-462.
Roohi, B.,N., Hedayati, S., Aghayari, A., 2013. The effect
of flexible flat-footedness on selected physical fitness
factors in female students aged 14 to 17 years. Journal
Of Human Sport & Exercise, 8. p. 788-796.
ICSSHPE 2017 - 2nd International Conference on Sports Science, Health and Physical Education
10

Tsai, L. C., Yu, B., Mercer, V. S., Gross, M. T., 2006.
Comparison of different structural foot types for
measures of standing postural control. Journal of
Orthopaedics and Sports Physical Therapy, 36(12). p.
942-953.
Tudor, A., Ruzic, L., Sestan, B., Sirola, L., Prpic, T., 2009.
Flat-Footedness is not a disadvantage for athletic
performance in children aged 11 to 15 years.
Pediatric, 123. p. e386-e391.
Wozniacka, R., Bac, A., Matsuik, S., Szcygiel, E., Ciszek,
E., 2013. Body weight and the medial longitudinal
foot arch:high-arched foot, a hidden problem. Eur J
Pediatr, 172. p. 683-691.
Influence of Fatigue on Balance and Lower Limb Muscles Activity in Flatfoot Children
11
