
Application GIS to Analyse Crime Risk in Bandung
Moh Dede, Iwan Setiawan and Asep Mulyadi
Universitas Pendidikan Indonesia, Jalan Dr. Setiabudhi no. 229, Bandung
desa96@student.upi.edu, iwansetiawan@upi.edu
Keywords: Crime, GIS, Security.
Abstract: This study aims to determine various factors are affected crime occurrence and discover crime risk distribution
in Bandung using geographic information system (GIS) technology. It is to achieve suitable action against
crime for mutual security. As quantitative research, the correlation of each factor is obtained from statistical
test, then a decile rule used to know the value distribution. Eastman equation require score and weight from
the correlation coefficient and value distribution for overlay analysis using GIS software to result crime risk
distribution in Bandung. Correlation test identified that historical crime accidents, public facilities, and
residence domination are most influence crime occurs, because crime needs suitable condition like place,
time, and target. The resulted map of crime risk distribution shows 39.02 and 16.69 percent or more than half
area of Bandung has very high and high risk. Based on the analysis, crime risk area agglomerate in the western
and central of city are known as central business district. In addition, the temporal pattern of crime risk
increase at 18.00 to 24.00 pm who coverage almost three-fifths area of the city when citizen activity is highly.
1 INTRODUCTION
Application geographic information system (GIS) as
a technology has grown in various scientific fields.
SIG is able to prove itself as efficient and effective
system in managing various spatial data and
information, so a new information can be obtained
according to user needs (Getis et. al., 2000). Crime as
a pathological social and spatial phenomenon
requires appropriate prevention with information
technology to reduce the intensity, e.g. to mapping
crime risk distribution using GIS (Eman et al., 2013).
As a largest metropolitan in Indonesia, during 2014 ̶
2015 there are 9024 crime cases that occurred in
Bandung, it listed the city as highest crime region in
West Java Province (Bandung Police Dept., 2016).
To response crime threat in Bandung, GIS have a role
to determining crime risk locations through
geospatial and geo-processing analyses based on
various environmental and social factors are
influence crime action in the region (Wing and
Tynon, 2006).
Crime study using GIS has developed in several
countries as part of internal security operations. In
United States and Australia, crime analysis using GIS
raises a term crime mapping, i.e. as spatial analysis
processes of crime to obtain information about crime
patterns, trends, and dynamics relating to location,
time, and target or victim (Levine, 2006). Application
GIS to analyse crime in a region gives the
consequence that any spatial analysis of crime should
use quantitative approach (Ratcliffe, 2010).
Previous studies about GIS in crime analysis were
exercised by some researchers. Balogun et al. (2014)
developed crime hotspots, areas deficient of security
outfit, areas of overlap and areas requiring constant
police patrol in Benin City using buffering analysis.
Then, Olajuyigbe et al. (2016) revealed a transport
route cutting through Akure metropolis is prone to
crime activity using neighbourhood and statistical
analyses with GIS. Other it study demonstrated a
relationship between the property crime rate with
household income and poverty in Malaysia using
Likelihood Ratio Statistic (LRS) and Space-Time
Normal Mixture Models by Zakaria and Rahman
(2016).
Different from previous studies who only reveal
some social and environmental factors using
statistics, geo-statistics, and range analysis such as
neighbourhood, LRS, and buffering analysis. This
study uses statistical analysis result as input data for
overlay analysis, so it will generate new information
based on crime factors. Whereas, this study aims to
determine various factors are affected crime
occurrence and discover crime risk distribution in
Bandung using GIS. The scope of factors are limited
Dede, M., Setiawan, I. and Mulyadi, A.
Application GIS to Analyse Crime Risk in Bandung.
In Proceedings of the 2nd International Conference on Sociology Education (ICSE 2017) - Volume 1, pages 597-602
ISBN: 978-989-758-316-2
Copyright © 2018 by SCITEPRESS – Science and Technology Publications, Lda. All rights reserved
597
to eight essential variables from Stark (1987),
Breetzke (2010), and FBI (2012).
Analysis about crime risk distribution in Bandung
purposed to know a correlation between historical
crime accidents, public facilities, residence
domination, road network, security posts, land use,
population density, and poverty distribution with
crime action. so spatial nor temporal patterns of crime
risk in the city can be obtained by overlay analysis
using GIS. Correlation analysis using inferential
statistics method is suitable with data characteristics
and overlay analysis used is union to get all
information (Raju, 2013). Based on the analysis,
information about center of Bandung has very highly
crime risk status. Then, region has far away from
center and east of the city crime risk is decreasing.
2 LITERATUR REVIEW
2.1 Crime and Geography
Crime is an act that violates the rules or laws who
prevailing in society and harms other persons, each
violation has consequences such as penalty sanctions
or other actions from law authorities (Buikhuisen,
1985). In the study of geography, crime phenomenon
discusses on geography of crime as a part of human
geography. It was born because each crime events are
related by space, time, human activity, and pattern
(Evans and Herbert, 2014). According to Stark
(1987), FBI (2012), dan Breetzke (2010), there are
several essential factors that cause a location to be
risk of crime acts, such as (1) historical crime, (2)
public facilities, (3) residence domination, (4) road
network, (5) security posts, (6) land use, (7)
population density, and (8) poverty distribution.
2.2 GIS on Crime Analyse
Geographic Information System (GIS) is a designed
system to capture, store, manipulate, analyse,
organize and display all types of geographical (geo-
spatial) data of a region data be new information for
decision making (Setiawan, 2010). GIS can be used
as a tool in analysing and making decision in the
security field, especially to mapping and crime
analysis (Butorac and Marinović, 2017).
In some countries such as Australia, Canada, and
the United States, spatial analysis of crime using GIS
generally uses hotspots, statistics, and geo-statistics
model (Ferreira, et. al., 2012). In Indonesia, the study
of crime analysis using GIS generally only input data
and serve information about crime sites, both
conventional and web-based GIS (Maulana, 2016).
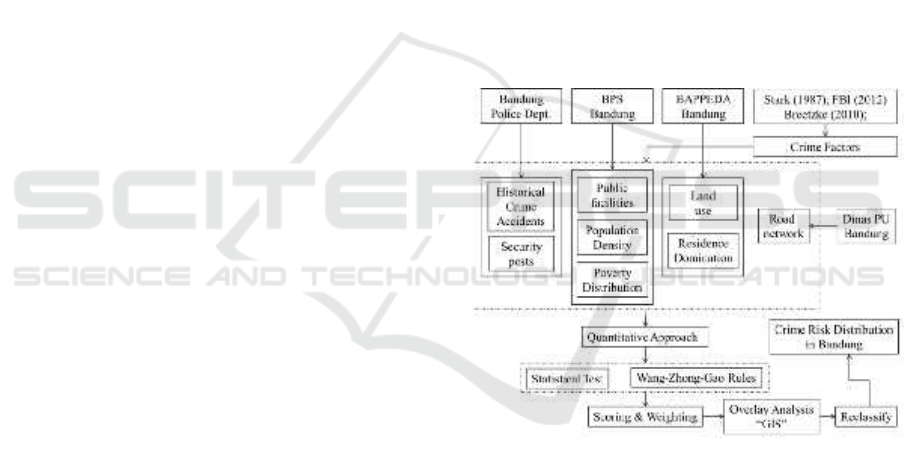
3 METODHS
Values for various factors are affect the distribution
of crime in Bandung obtained by correlation analysis
as a part of inferential statistics. The coefficient result
is used as a value to weighting all factors and
determining potential crime risk locations through
overlay analysis on GIS software (Raju, 2013).
Each factor is determined by the correlation value
with crime distribution using correlation analysis –
Pearson Product Moment Correlation formula (if the
data is normally distributed) or Spearman Rank
Correlation (if the data is not normal distribution) –
to resulting some value are used as a weight. For
scoring or classifying scores in each factor using the
decile rule (Chen, 2014). in detail the research
schema and data acquisition presented in Figure 1.
Figure 1: Research schema and data acquisition.
4 RESULTS AND DISCUSSION
4.1 Factors are Influence Crime in
Bandung
In this study, each of the factors that influence crime
is studied in the quantitative approach. For a first
factor is historical crime accidents, obtained from
crime locations relationship in 2014 and 2015. Based
on the analysis, it is known that the historical crime
accidents have correlation reach 0.947 which
indicates very high trend of crime occurred in the
same place. This further confirms that crime tends to
ICSE 2017 - 2nd International Conference on Sociology Education
598

be concentrated in certain places even near spaces
with highly crime risk (Newton and Felson, 2015).
In this study, public facilities in Bandung as a
second factor are limited to public work and space
aspects such as famous places of worship, shopping
centers, entertainment and tourism spot, health
centers, transportation train and bus station, airport
infrastructure, and educational places are often the
center of people's activities (Batta et. al., 2014).
Highly influence between public facilities
distribution and crime in Bandung reach 0.827. it is
means that attraction and open access to facilities for
public give an opportunity crime action occurring
(White, 1999).
To ensure the influence of human activities in
space with crime is used residential land allocation in
each sub-district as a third factor based on settlement-
land ratio. In Bandung, it ratio in each sub-district
reach 68 to 98 percent in the western and central parts
who shown a residence domination as urban
characteristic with the correlation reaches 0.6. This
condition causes urban residences have many ideal
targets for crime offenders (Sayafzadeh and Hassani,
2014).
Road networks becomes the fourth factor, because
it have main roles for human physical connectivity.
The influence of road network to crime in Bandung
reaches 0.51 or medium, the existence is often used
by criminals to staging street or near road crimes.
Beside it, road network also facilitates security
personnels to patrol (Summers and Johnson, 2017).
The next factor is the distribution of security
Polri and TNI posts, Inequality the distribution
causes the correlation with crime reaches 0.493 or
medium. Existence of security posts should decrease
opportunities for crime, it presence means that
security personnels are always ready to maintain
security can reduce fear of crime, so that its existence
is used as a fifth factor related to crime in Bandung
(Weisburd and Eck, 2004).
Based on assumption that a crime requires
location suitability which is generally interpreted as
land use, it is manifestation of environmental
management by human as part of life empowerments
decide it as the sixth factor who related to crime. In
Bandung, correlation between land use and crime
reach 0,209 or low, only residential land use type who
can reaches of 0.6 or medium. Whereas for others
land use have negative correlation, such as moor, rice
field, empty land, forest, plantation, and concrete land
with value between -0.169 to -0.48. In addition, based
on the results of chi-square test found that crime
probability for each land use is not the same. It means
confirming about crime risk tends occur in one type
of land use i.e. residential land. Sypion-Dutkowska
and Leitner (2017) said that crime trends occur
settlement as suitable places.
Various modus operandi of urban crime generally
targeting the public goods, so population density
becomes the seventh factor. Correlation analysis
result show the relationship between population
density and crime in Bandung reached 0.126 or very
low. The Highest urban population density and very
low correlation with crime is indicates daily mobility
of peoples is very high. Thus the population density
is tend changing, but agglomerate around central
business district (Hartman, 1950).
Finally, crime incidence is often associated with
poverty distribution in a region, especially in urban
area (Gümüş, 2003). In Bandung the correlation is
only 0.035 or very low. This means that the poverty
distribution is not able to justify an area in Bandung
be vulnerable, thus it reinforcing that crime relate to
suitable targets as a person or object as particularly
attractive that are seen by the offender (Clarke and
Felson, 1979).
4.2 Crime Risk Distribution in
Bandung
Determining the crime risk distribution in Bandung
begins with scoring and weighting any factors which
related with crime. Uniforming the score can use
descriptive statistic method, especially decile rule
(Furqon, 2013). Whereas, each weight value is
obtained from correlation analysis will be uniformed
use Xiaodan et. al. (2010) model as shown in equation
1.
Weight
i
=
X
i - X
min
X
max - X
min
×5
(1)
Crime Risk= ∑ (score X weight)
(2)
The results of the equation 1 and decile rule are
used as input for overlay analysis using GIS software
(see table 2). Especially for land use, scoring is
obtained from correlation value between land use and
crime. Furthermore, the data in table 1 transform be
crime risk value using Eastman method as in equation
3 (Riad et. al., 2011). The result of overlay analysis
should be reclassify using quantile method to
minimizing data deviation (Furqon, 2013), thus
produce map of crime risk distribution in Bandung
can be done.
Application GIS to Analyse Crime Risk in Bandung
599
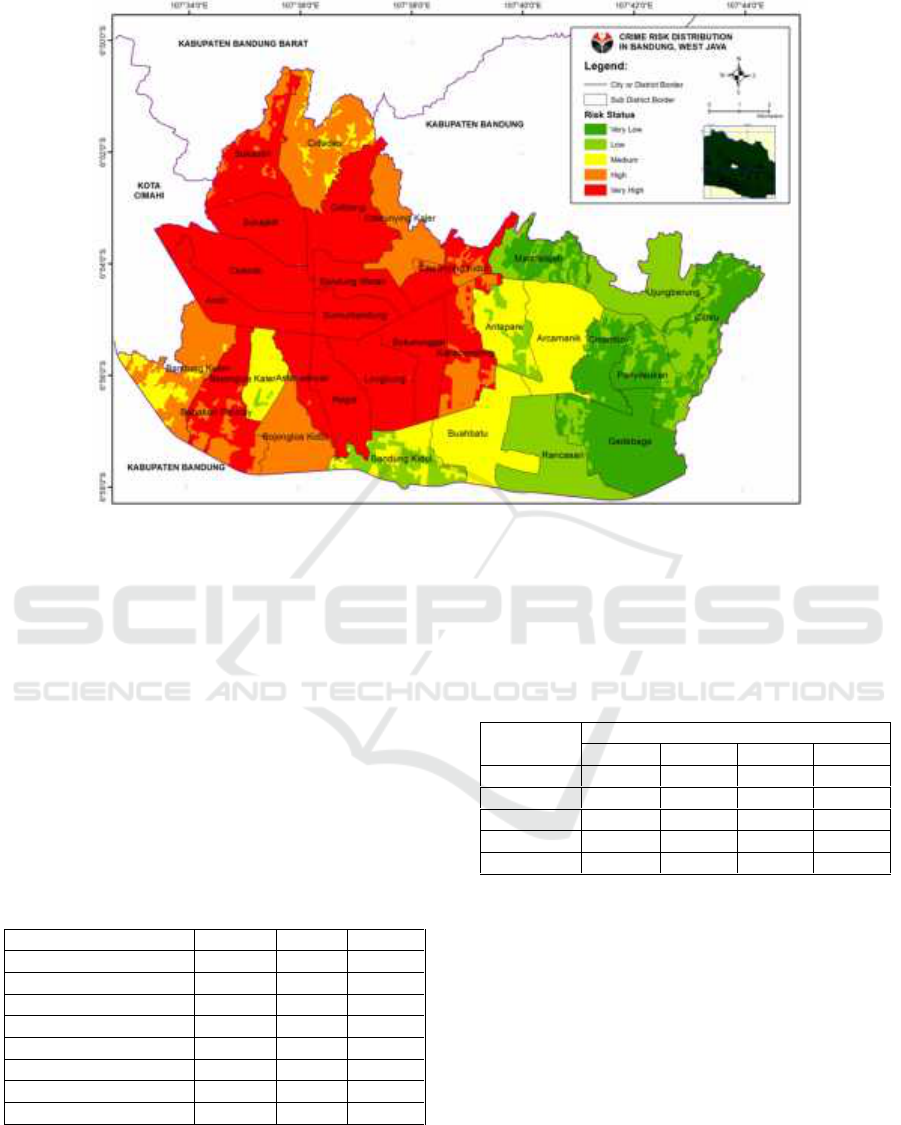
Figure 2: Crime risk distribution in Bandung.
Figure 2 shows the information about very high
crime risk level in the western and central Bandung
with 65.50 km
2
area. Uniquely, the region is
surrounded by areas with high levels of crime risk
with 28.02 km2. When combined, the 55.72 percent
of city area or 93.52 km
2
have a status as prone to
crime. The crime risk distribution in western and
central Bandung as a center of growth is a normal
phenomenon (Schuler, 2004). However, crime risk
coverage which over half the city requires special
handling, such as placement new security posts in any
location, because it is easily factor than others
(Weisburd and Eck, 2004).
Table 2: Scoring and weighting various factors of crime.
Factors
Score
R
Weight
Historical Crime
1 – 5
0.947
5.0
Public facilities
1 – 5
0,827
4.3
Residence domination
1 – 5
0.600
3.1
Road network
1 – 5
0.515
2.6
Security posts
1 – 5
0.493
2.5
Land use
1 – 5
0.209
1.0
Population Density
1 – 5
0.126
0.5
Poverty Distribution
1 – 5
0.035
0.0
Crime risk distribution has a decrease trend
towards the east, from Figure 2 it is known that some
sub-districts in eastern Bandung such as Mandalajati,
Gedebage, Panyileukan, Cinambo, and Cibiru are
areas with low and very low crime risk status. This
condition occurs due to the suitability of location and
target for crime offenders is very minimal (Evans and
Herbert, 2014).
Table 3: Dynamics of crime clock in Bandung.
Crime
Risk
Area and Time (km
2
and 24 system)
00 – 06
06 - 12
12 – 18
18 – 24
Very low
22,07
22,66
22,66
22,66
Low
26,24
26,01
24,36
24,36
Medium
24,84
30,79
24,35
24,35
High
29,06
24,02
30,71
30,71
Very High
65,64
64,37
65,76
65,76
In addition, through GIS the temporal pattern of
crime risk distribution in Bandung can be determined
based on crime clock data into four time from
Bandung Police Dept. (2016). From the table 3.
highest crime risk occurs at 18.00 - 24.00 GMT + 7.
In this time Bandung have high and very high crime
risk status reaches 96, 47 km
2
or 57.48 percent of the
city. This happens because at the time, Bandung
people's activity mostly located in the streets, public
spaces, and in a state of tired so that seen by the actors
as suitable targets (Felson and Poulsen, 2003).
ICSE 2017 - 2nd International Conference on Sociology Education
600

5 CONCLUSIONS
Various factors such historical crime, public
facilities, residence domination, road network,
security posts, land use, population density, and
poverty distribution have correlation with crime in
Bandung. Using of geographic information systems
(GIS) indicates that the highest risk areas agglomerate
in central and western Bandung, so it has worry crime
risk condition. In addition, it also found that toward
the east, crime risk in Bandung decreased to a very
low level. For the temporal pattern shows areas with
high crime and very high risk increasing at 18.00
24.00 GMT+7, it cover almost three-fifths of
Bandung. This condition requires seriously efforts to
reduce crime risk as part of mutual security in
Bandung.
ACKNOWLEDGEMENTS
Special thanks for Unit of Criminal Investigation at
Bandung Police Dept. who give chance to observe
and some advice on this research for us. At least, for
our friends (the 2014’s squad of Geography
Education UPI) on GIS course, especially for defence
and security field and M. A. Widiawaty.
REFERENCES
Balogun, T. F., Okeke, H., Chukwukere, C., I., 2014. Crime
mapping in Nigeria using GIS. Journal of Geographic
Information System, 2014(6), 453-466.
Bandung Police Dept., 2016, Data tindak pidana tahun
2015, Unpublished, Bandung.
Batta, R., Lejeune, M., Prasad, S., 2014. Public facility
location using dispersion, population, and equity
criteria. European Journal of Operational Research,
234(3), 819-829.
Breetzke, G. D., 2010. A socio-structural analysis of crime
in the city of Tshwane, South Africa. South African
Journal of Science, 106 (11), 1-7.
Buikhuisen, W., Bontekoe, E. H. M., Plas-Korenhoff, C.,
1985. Characteristics of criminals: the privileged
offender. International Journal of Law and Psychiatry,
7, 301-313.
Butorac, K., Marinović, J., 2017. Geography of crime and
geographic information systems. Journal of Forensic
Science and Criminal Investigation, 2(4), 1-7.
Chen, J., 2014. GIS-based multi-criteria analysis for land
use suitability assessment in City of Regina.
Environmental Systems Research 43(13), 1-10.
Cohen, L., Felson, M., Social change and crime rate trends:
a routine activity approach. American Sociological
Review, 44(4), 588–608.
Eman, K., Györkös, J., Lukman, K., Meško, G., 2013.
Crime mapping for the purpose of policing in Slovenia
- recent developments. Journal of Criminal
Investigation and Criminology, 64(3), 287-308.
Evans, D. J., Herbert, D. T., 2014. The geography of crime.
Routledge, New York.
Felson, M., Poulsen, E., 2003. Simple indicators of crime
by time of day. International Journal of Forecasting,
19(2003): 595–601.
Ferreira, J., João, P., Martins, J., 2012. GIS for crime
analysis - geography for predictive models. The
Electronic Journal Information Systems Evaluation,
15(1), 26-49.
Furqon, 2013, Statistika terapan untuk penelitian, Alfabeta,
Bandung.
Getis, A., Drummy, P., Gartin, J., Gorr, W., Harries, K.,
Rogerson, P., Stoe, D., Wrigth, R., 2000. Geographic
information science and crime analysis. URISA
Journal, 12 (2), 7-14.
Hartman, G. W., 1950. The central business district - a
study in urban geography. Economic Geography, 26(4),
237-244.
Levine, N., 2006. Crime mapping and the crime stat
program. Geographical Analysis, 38(2006), 41–56.
Maulana, F. I., Prihatmanto, A. S., Kim, C. S., 2016. Design
and implementation the concept of crowdsourcing on a
web portal crime. In Proceeding 6th International
Annual Engineering Seminar (InAES), 51-55.
Newton, A., Felson, M., 2015. Crime patterns in time and
space: the dynamics of crime opportunities in urban
areas. Crime Science, 4(11), 1-5.
Olajuyigbe, A., Omole, K., Bayode, T., Adenigba, A.,
2016. Crime mapping and analysis in the core area of
Akure, Nigeria. Journal of Remote Sensing and GIS,
5(178), 1-7.
Raju, P. L. N., 2013. Spatial data analysis. Satellite Remote
Sensing and GIS Applications in Agricultural
Meteorology, September (2013), 151-174.
Riad, P. H. S., Billib, M., Hassan, A. A., Salam, M. A., El-
Din, M. N., 2011, Application of the overlay weighted
model and Boolean logic to determine the best locations
for artificial recharge of groundwater. Journal of Urban
and Environmental Engineering, 5(2), 57-66.
Ratcliffe, J., 2010. Crime mapping: spatial and temporal
challenges. In A.R. Piquero and D. Weisburd (eds.),
Handbook of Quantitative Criminology, Springer
Science and Business Media, LLC.
Application GIS to Analyse Crime Risk in Bandung
601

Sayafzadeh, A., Hassani, M. J., 2014. The effects of land
use in urban crime commitment in the unofficial
settlement of Islam Abad, Zanjan. International
Journal of Academic Research in Business and Social
Sciences, 4(1), 474-489.
Schuller, N.,2004, Urban growth and community safety:
developing the impact assessment approach for crime
and disorder. Safer Communities, 3(4), 4-14.
Setiawan, I., 2010. Dasar-dasar sistem informasi geografis,
Buana Nusantara, Bandung.
Stark, R., 1987. Deviant places: a theory of the ecology of
crime. Criminology, 25(4), 893-909.
Summers, L., Johnson, S. D., 2017. Does the configuration
of the street network influence where outdoor serious
violence takes place? using space syntax to test crime
pattern theory. Journal of Quantitative Criminology,
33(2), 397-420.
Sypion-Dutkowska, N., Leitner, M., 2017. Land use
influencing the spatial distribution of urban crime: a
case study of Szczecin, Poland. ISPRS International
Journal of Geo-Information, 6(74), 1-23.
Weisburd, D., Eck, J., 2004. What can police do to reduce
crime, disorder and fear?. The Annals of the American
Academy of Political and Social Science, 593, 42-65.
White, R., 1999. Public spaces, social planning and crime
prevention. Urban Policy and Research, 17(4), 301-
308.
Wing, M. G., Tynon, J., 2006. Crime mapping and spatial
analysis in national forests. Journal of Forestry,
September (2006), 293-298.
Xiaodan, W. Xianghao, Z., Pan, G., 2010, A GIS-based
decision support system for regional eco-security
assessment and its application on the Tibetian Plateau.
Journal of Environmental Management, 91(2010),
1981-1990.
Zakaria, S., Rahman, N. A., 2016. The mapping of spatial
patterns of property crime in Malaysia: normal mixture
model approach. Journal of Business and Social
Development, 4(1), 1-11.
ICSE 2017 - 2nd International Conference on Sociology Education
602
