
SPICE: Superpixel Classification for Cell Detection and Counting
Oman Maga˜na-Tellez
1,2
, Michalis Vrigkas
2
, Christophoros Nikou
2
and Ioannis A. Kakadiaris
1,2
1
Department of Biomedical Engineering, University of Houston, Houston, TX 77004, U.S.A.
2
Computational Biomedicine Lab, Department of Computer Science, University of Houston, Houston, TX 77004, U.S.A.
Keywords:
Superpixel, Histological, Cell Detection, Cell Quantification, Random Forests.
Abstract:
An algorithm for the localization and counting of cells in histopathological images is presented. The algorithm
relies on the presegmentation of an image into a number of superpixels followed by two random forests for
classification. The fi rst r andom forest determines i f there are any cells in the superpixels at its input and the
second random forest provides the number of cells i n the respective superpixel. The algorithm is evaluated on
a bone marrow histopathological dataset. We argue that a single random forest is not sufficient to detect all the
cells in the image while a cascade of classifiers achieves higher accuracy. The r esults compare favorably with
the state of the art but with a lower computational cost.
1 INTRODUCTION
Histopathological ima ge analysis plays an imp ortant
role in the diagn osis of numerous pathologies ranging
from infec tious diseases to ca ncer (Oguz et al., 2016).
However, the traditional method for analyzing histo-
pathological images is a te dious and time-consuming
task given the typically large number of cells con-
tained in the image as well as the numerous images
to b e analyzed, which can lead to considerable inter-
observer variability as well as irreproducible results
(Andrio n et al., 1995; Ismail et al., 1989). There-
fore, the demand for computer-aided analysis is high
(Demir and Yener, 2005; Zhang et al., 2014) and has
seen an increased effort in research during the previ-
ous decades. A mong the m a jor difficulties in the ap-
plication of image analysis methods to cell images are
the non-u niform staining, blurring due to defocussing,
and the existence of overlapping cells (Demir and Ye-
ner, 2005).
There are m ethods designed for estimating the lo-
cation of the cells in the image (Kainz et al., 2015;
Zhang et al., 2014). These algorithms use different
techniques such as a score map with the probability of
location or an arbitrary image segmentation throu gh
correlation clustering. On the other hand, the methods
in (Benali et al., 2003; Sjostrom et al., 1999) quantify
the number of cells; the first method uses a clustering
followed by a binarization of the image and the se-
cond method uses a three layer neural network fed by
structural information. Kainz et al. overcame one of
the main issues in histopathological images, the dif-
ferentiation of ce lls from background structures, by
using a probability sco re map to indicate where a cell
is more likely to be located (Kainz et al., 2015). Even
though this method exhibited good results, the inter-
ference of u ndesired structures is still present. Mor e-
over, the need for definin g a threshold for the distance
between a true cell location and the response from a
trained classifier is also an importa nt issue.
In this p a per, the SPICE (SuperPIxel classifica-
tion for Cell dEtec tion and countin g) algorthm is
proposed, which is an algor ithm for the localization
and quantificatio n (total number) of cells in histo-
logical images. Our method uses a superpixel pre-
segmentation of the image a nd a sequence o f random
forests for classification. The first random forest is a
binary classifier w hich determines if the superpixel at
its inpu t contains any cells. A second random forest,
which is a multiclass classifier, deter mines how many
cells are present at the superpixels provided by the
same pre-segmentation of the image. Both classifiers
can work independently. However, the experimental
evaluation indicated that more accura te results can be
obtained if they are applied sequentially. An ad van-
tage of SPICE is the use of superpixels in the segmen-
tation, since it provides the extracted features with a
more compact and more representative modeling of
the c ells (e.g., using the color and the shape of the su-
perpixels). Also, we demonstrate that for the learning
stage, a low computa tional cost is capable of giving
a high detection accuracy, which is favorably c ompa-
Magaña-Tellez, O., Vrigkas, M., Nikou, C. and Kakadiaris, I.
SPICE: Superpixel Classification for Cell Detection and Counting.
DOI: 10.5220/0006508304850490
In Proceedings of the 13th International Joint Conference on Computer Vision, Imaging and Computer Graphics Theory and Applications (VISIGRAPP 2018) - Volume 4: VISAPP, pages
485-490
ISBN: 978-989-758-290-5
Copyright © 2018 by SCITEPRESS – Science and Technology Publications, Lda. All rights reserved
485
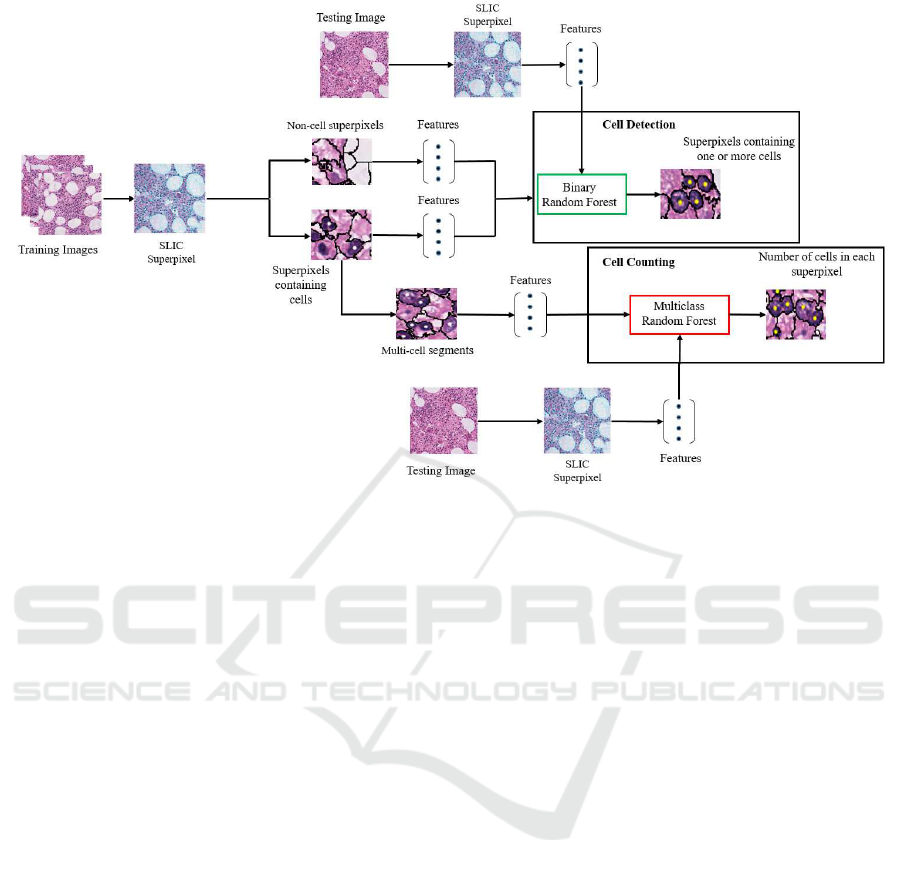
Figure 1: Depiction of SPICE, detailing the training and the testing stages for both cell detection and cell counting.
red with state-of- the-art methods (Kainz et al., 2015)
using the same dataset.
2 CELL DETECTION AND
COUNTING
Histological images are acquired by first o btaining a
tissue sample from the patient, then the sample is de-
hydrated and encased in paraffin in order to preserve
the tissue. Finally, a staining is applied to the sam-
ple in or der to highlight the structures of interest. The
most common stain used is Hematoxilin and Eosin
(H&E).
Classification algorithms for cell de te ction on his-
tological images commonly use a sliding window
over the image in order to extract features from it. Ho-
wever, this c an lead to several issues to be addressed
such as the increase in computationa l cost, the need
for determinate the size of the window and the even-
tual misclassifications at the borders o f the im age.
The m ethod pr oposed herein is based on the segmen-
tation of the image into superpixels. Each superpixel
is represented by a feature vector which is then for-
warded to a random forest classifier. The outline o f
the proposed method is summarize d in Fig. 1 .
In the first step of SPICE, the image is divided
into perceptually meaningful regions. This is a chie-
ved using the SLIC superpixel segmentation algo-
rithm (Ac hanta et al., 2010), an algorithm that clus-
ters pixels in the combin ed five-dimensional color
(CIELAB) and location featu res to efficiently gene-
rate compact, nearly uniform segments. We decided
to use the SLI C algo rithm since it is considered one o f
the fastest, state-of-th e-art algorithms (Achanta et al.,
2012) and it only needs the number of superp ixels as
parameter. The pre-segmentation of the image into
superpixels, reduces significantly the computational
cost and time of SPICE, by eliminating the tedious
process of sliding a window through the image to
obtain the sections for f eature extraction. The super-
pixel segments aggregate regions with similar charac-
teristics which facilitates the feature extraction ta sk.
Also, by organizing the image into similar regions
there is a higher probability that an entire cell or a
cluster of cells is contained in a single segment. The
number of superpixel segments is selected a c cording
to the size of the image and the size o f the cells. Se-
lecting a large number of segments in a small image
can cause the cells to be p artitioned into multiple seg-
ments. On the contrary, selecting a small number of
segments may lea d to superpixels containing both cell
and background information .
For the training step, a number of features are ex-
tracted for each superpixel to represent the underlined
segment. The fe atures we used were the following:
RGB intensity channels, mag nitude of oriented gra-
dients, first and second oriented gradients, LUV in -
tensity channels a nd histogram o f oriented gradients.
For every superpixel, the mean and the standard devi-
ation of the respective features are computed, except
VISAPP 2018 - International Conference on Computer Vision Theory and Applications
486

Algorithm 1: SPICE: Training for cell detection
and counting.
Input : N Images, Cell center c oordinates
Output: Detection and Counting Random
Forests
1 for All Images in Set do
2 Segment the image using the SLIC
superpixel alg orithm (Achanta et al. ,
2012).
3 Extract a 31-dimensional feature vector
for each superpixel.
4 Train the binary random forest for cell
detection.
5 Train the multiclass random forest for cell
counting.
6 end
for the histogram of oriented gradients, where a 9-
dimensional vector of the gradient orientations weig-
hted by their amplitudes is computed. We decided to
use the me an and standard deviation of the features to
have a more robust representation of the structure and
color of the cell compared to the backgro und or ot-
her undesired structures. The concatenation of these
features yields a 31-dimensional feature vecto r.
We decided to use the RGB channels for the co-
lor information of the cell, since H&E stains the c ell
nucleus with blue co lor and the cytoplasm with pink
color, therefore it is straightforward to have the blue
color as a feature for the pixels to indicate a high pro-
bability of ce ll presence. The gradient information
obtained by SPICE is used for the representation of
the shape information of the cell. The LUV chann els,
such as the RGB channels, provide informa tion of the
color of cells and the backgroun d with the advantage
that these fe atures are device (micr oscope) indepen-
dent and they may not be modified.
The cell detection algorithm is a binary random
forest classifier that determines if the superpixel at its
input contains any cells or background. At this point,
the num ber of cells in the segment does not play any
major role, since we are focusing only on the presence
or absence of cells in the image. Therefor e , the next
step of the algorithm consists in determining the num-
ber of cells in each superpixel. A mu lti- class random
forest classifier is employed using the number of cells
present in the segment as the corresponding label. We
decided to lim it the number of classes to four, in or-
der to avoid the potential problem of unbalanced data,
since it is relatively rare to have more than three cells
clustered in the same superpixel. The overall proce-
dure for training and testing is summarized in Algo-
rithms 1 and 2, respectively.
Algorithm 2: SPICE: Testing for cell location and
counting.
Input : An image
Output: Locations of cell centers and
number of cells
1 Segment the image using the SLIC sup erpixel
algorithm (Acha nta et al. , 2012).
2 Extract a 31-dimensional feature vector for
each superpixel.
3 Apply the feature vector s to the binary
random forest to indicate the presence of
cells in a su perpixel.
4 Apply the feature vector s to the multi-class
random forest to obtain the number of cells
in a superpixel.
3 EXPERIMENTAL RESULTS
The algorithm was evaluated on the dataset intro du-
ced in (Kainz et al., 2015) . The dataset consists of 11
images o f 1 , 200 × 1, 200 pixels of healthy bone mar-
row from eight patien ts and their respec tive ground
truth image. Based on the size of images of the da-
taset and the exp ected cell sizes, we segmented th e
images into 1, 000 superpixels.
We performed a set of experiments to te st the im-
pact of the number of superpixels in the image. We
performed a number of experiments with both a small
as well as a large number of segments. The num-
ber of segments plays a crucial role for the quan-
tification of ce lls, as selecting a small number of
segments would result in increased false positives,
while a large number of segments would reduce con-
siderably the detection of cells in the image. Ba-
sed on the bo ne marrow cell image dataset (Kainz
et al., 2015) , we selected the number of superpixels
by cross-validation and set it to the value of 1, 0 00 as
this pre-segmentation provides a detection rate closer
to the g round truth for the validation set (Fig. 2). Ne-
vertheless, this para meter has to be cross-validated in
the case of a different type of cell images. This is per-
haps the caveat of the method but by performin g this
cross validation we can ensure that the number of seg-
ments will give to the classifier the strongest features.
The number of classes in the multi-class random
forest was set to four, which represents the presence
of 0, 1, 2, and 3 or more cells in a superpixel segment.
Using four labels han dles the issue of unbalanced data
in the training step of the algorithm as the dataset in
(Kainz et al., 2015) contains too few cell clusters with
more than four cells. Moreover, in the second stage,
we also had a label of zero cells in order to include
SPICE: Superpixel Classification for Cell Detection and Counting
487
250 500 750 1000 1250 1500 1750 2000 2250 2500
0
200
400
600
800
1000
1200
Number of SLIC Segments
Number of Detected Cells
(Average)
Detected Cells
Ground Truth
Figure 2: Impact of the number of superpixels i n the quan-
tification of cells.
10
−4
10
−3
10
−2
10
−1
10
0
0
0.1
0.2
0.3
0.4
0.5
0.6
0.7
0.8
0.9
1
False Positive Rate (log scale)
True Positive Rate
SPICE (single RF)
SPICE (cascaded RF)
(a)
10
−3
10
−2
10
−1
10
0
0
0.1
0.2
0.3
0.4
0.5
0.6
0.7
0.8
0.9
1
False Positive Rate (log scale)
True Positive Rate
SPICE (cascaded RF)
SPICE (single RF)
(b)
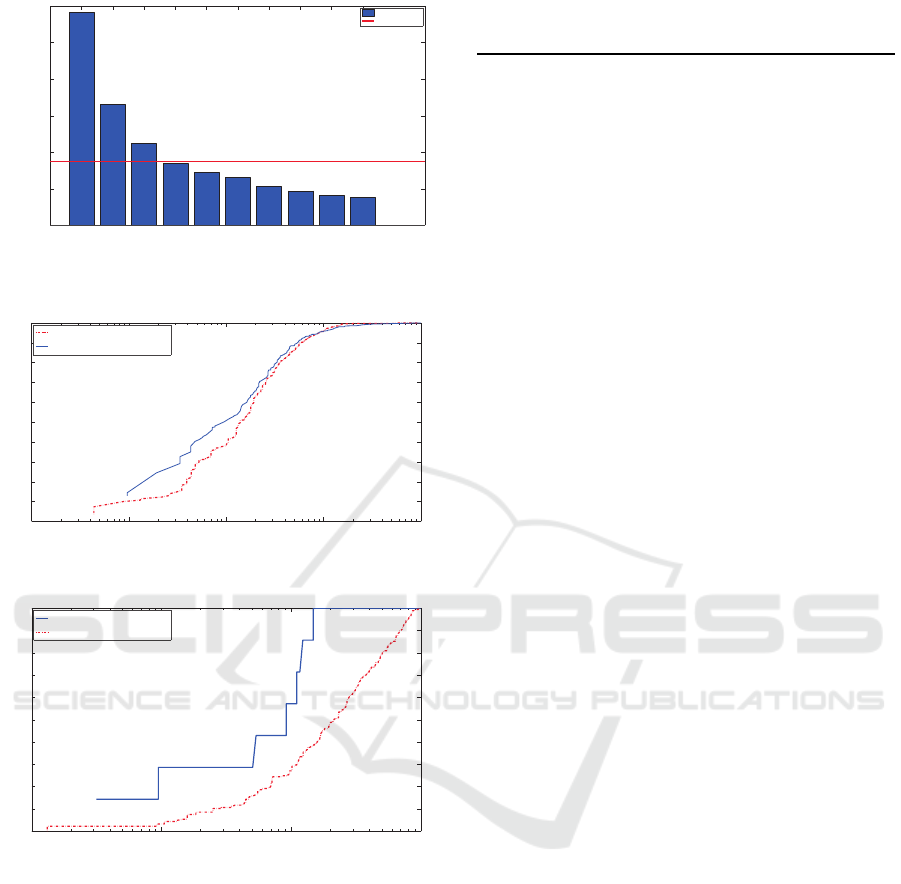
Figure 3: ROC curves of (a) the binary classifier and (b)
multi-class classifier of SPICE with a single and cascaded
random forest. The curve for the single random forest in
(a) was generated by comparing its final classification result
in a ”hit or miss” sense, without taking into account the
number of cells detected.
backgr ound superpixels that could have been missed
by the first classifier. Learning th e background label
using this additional random forest improves the ro-
bustness of the algorithm.
In the second set of exper iments, we examined the
consistency of the method with respect to the num-
ber of trees in the ra ndom forests. In order to com -
pare the classifiers more efficiently the area u nder the
curve (AUC) is used as a score for their performance
Table 1: Area under the ROC curve.
Classifier SPICE-CRF Kainz et al. SPICE-SRF
Cell Detect. 97.34% 90.5% 97.29%
Cell Count. 93.67% N/A 71.43%
(Fawcett, 2006). A 3-fold cross validation was em-
ployed to determine the number of trees in both clas-
sifiers. The results indicated that varying the number
of trees be twe en 50, 150 and 20 0 tre es yields similar
areas under the ROC curve (AUC), namely 97.21%,
97.27% and 97.27% respectively. From this experi-
ment, we concluded that a relatively low number of
trees is sufficient to obtain a high classification accu-
racy as increasing the number of trees does not have
a significan t impact on the outcome of the method.
Therefore, for a faster performance and less compu-
tational power we decided to use 50 trees in the next
experiments.
An important question arising from SPICE is why
one has to apply two random forests sequentially
instead o f a single one that would do th e same classi-
fication. To clarify this issue, the SPICE algorithm is
compare d with its variant which uses a single random
forest that classifies the superpixels directly with re-
spect to the number of cells they contain. The ROC
curves are shown in Fig. 3. Fig ure 3a shows the ROC
curve for the bin ary classifier. The blue cur ve corre-
sponds to the performance of the d etection classifier
of SPICE using a cascaded random forest while th e
red curve is the same c la ssifier but in a single random
forest configuration. The curve for the single classi-
fier is g enerated by the cells detected at its output in
a binary (”hit or miss”) sense. Since th ere is only a
single stage, these curves a re relatively similar. Ho-
wever, the difference is clear in Fig. 3b wh ere the
multi-class random forest applied after the first binar y
random f orest outperforms the straightforward classi-
fication of the image. This happens because classifi-
cation errors from the previous stage are carried over
and affect deeply the mu lti- class cla ssification.
The experiment proved that SPICE is capable of
rivaling the state-of-the- art method for cell detection.
The algorithm is capable of finding the cells in the su-
perpixel segments of the image with a high accuracy
and c reates a window around them to indicate the re-
sults. Figure 4 illustrates representative results of ce ll
detection using the proposed SPICE algorithm.
In the last set of experiments the SPICE algorithm
is compar ed with the algorithm developed in (Kainz
et al., 2015) for the loca liza tion of cells in the imag e .
The respective ROC curves are depicted in Fig. 5 a nd
the overall ac curacies are shown in Table 1. Since the
method presented in (Kainz et al., 2015) is only a cell
localization algorithm, this experiment concerns only
the localization and not the number of cells.
VISAPP 2018 - International Conference on Computer Vision Theory and Applications
488
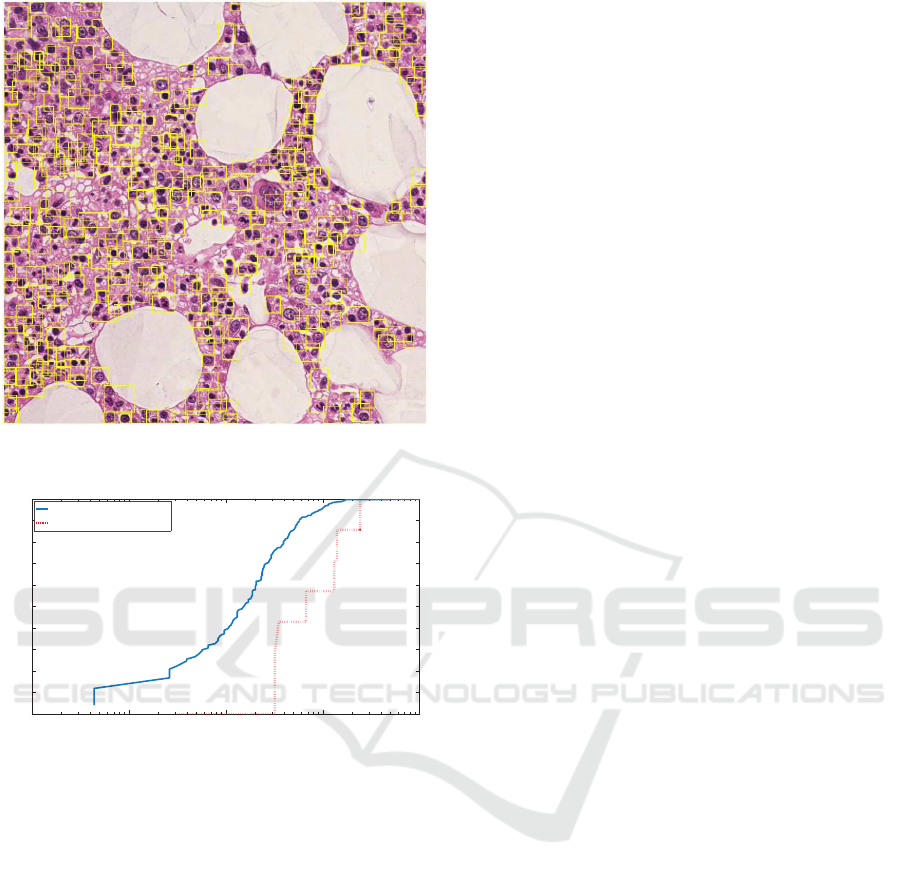
Figure 4: Representative result of SPICE cell detection on
an image of the database presented in (Kainz et al., 2015).
10
−4
10
−3
10
−2
10
−1
10
0
0
0.1
0.2
0.3
0.4
0.5
0.6
0.7
0.8
0.9
1
False Positive Rate (log scale)
True Positive Rate
SPICE (cascaded RF)
Kainz et al., 2015
Figure 5: Comparison between the SPICE algorithm and
the method presented in (Kainz et al., 2015).
Despite its success and good performance, the
proposed approach has one limitation th a t is related
on how the number of the superpixels for the segmen-
tation of the images are selected. This is now perfor-
med by heuristic cross-validation and typically set to
1, 000. Although this has to be a djusted for every new
type of image by performing cross-validation to esti-
mate the number of superpixels, we can ensur e that
the different segments will give to the classifier repre-
sentative features.
The goal of the propo sed me thod is to detect iso-
lated cells in an image and obtain their features for
better and stronger classification of bone marrow his-
topathological ima ges. An interesting and possible
extension o f this work would be in hematological di-
seases a nd more particularly in the analysis of 2D im-
munotherapy images (Rosas-Taraco et al., 201 1; ?) or
in d e te cting cells in Pap smear images (Plissiti et al.,
2015), where superpixels can a lso be u sed so that each
image can be tessellated into approxim a te ly equally
sized subregions, presenting homogeneous intensity
characteristics. How ever, different types of images
may exhibit different properties because cells may be
highly overlapping or the staining process may be dif-
ferent. T his implies that a different set of features may
need to be extracted for these type of image s. Regard-
less of the type of the features that may be used for
each image, the SPICE algorithm is general and can
easily be adapted to detect and localize cells in such
types of images.
4 CONCLUSION
A method for cell detection and quantification in his-
tological images that uses a superpixel segmentation
along with a two stage random fo rest classification is
presented. The method was successfully evaluated in
terms of AUC and favorably compared to a state-of-
the-art algorithm for cell detection. The main advan-
tage of the proposed method is that it provides a flex-
ible way for the simultaneous detection and co unting
of cells in histopathological images using a ca scade
of classifiers. The r esults indicated that the proposed
SPICE algorithm amelior a te s the classification accu-
racy by approximately 7% with respect to the state of
the art (Kain z et al., 2015). As future work, we plan
to extend the algorithm to detec t 3D cells, where the
difficulty c onsists in determining the appropriate fea-
tures.
ACKNOWLEDGMENTS
This work was fund e d in part by the Mexican Na-
tional Council for Scienc e and Technology (CONA-
CYT) scholarship, 668902, by th e European Com-
mission (H2020 -MSCA-IF-2014) No. under grant
agreement No. 656094, and by the UH Hugh Roy and
Lillie Cranz Cullen Endowment Fund. All statements
of fact, opinion or conclusions contained herein are
those of the authors and should not be construed as
representin g the official views or policies of the spon-
sors.
REFERENCES
Achanta, R., Shaji, A., Smith, K., Lucchi, A., Fua, P., and
Susstrunk, S. (2010). SLIC superpixels. Technical
Report 149300, EPFL, Lausanne, Switzerland.
Achanta, R., Shaji, A., Smith, K., Lucchi, A., Fua, P., and
Susstrunk, S. (2012). SLIC superpixels compared to
SPICE: Superpixel Classification for Cell Detection and Counting
489

state-of-the-art superpixel methods. IEEE Transacti-
ons on Pattern Analysis and Machine Intelligence,
34(11):2274–2282.
Andrion, A., Magnani, C., Betta, P., Donna, A., Mollo, F.,
Scelsi, M., Bernardi, P., Botta, M., and Terracini, B.
(1995). Malignant mesothelioma of the pleura: Inte-
robserver variability. Journal of Clinical Pathology,
48(9):856–860.
Benali, A., Leefken, I., Eysel, U., and Weiler, E. (2003). A
computerized image analysis system for quantitative
analysis of cells in histological brain sections. Journal
of Neuroscience Methods, 125(1):33–43.
Demir, C. and Yener, B. (2005). Automated cancer diagno-
sis based on histopathological images: A systematic
survey. Technical Report TR-05-09, Rensselaer Poly-
technic Institute, Troy, NY.
Fawcett, T. (2006). An introduction to ROC analysis. Pat-
tern Recognition Letters, 27(8):861–874.
Ismail, S., Colclough, A., Dinnen, J., Eakins, D., Evans, D.,
Gradwell, E., Sullivan, J., Summerell, J., and New-
combe, R. (1989). Observer variation in histopatholo-
gical diagnosis and grading of cervical intraepithelial
neoplasia. British Medical Journal, 298(6675):707–
710.
Kainz, P., Urschler, M., Schulter, S., Wohlhart, P., and Le-
petit, V. (2015). You should use regression to de-
tect cells. In Proc. Medical Image Computing and
Computer-Assisted Intervention, pages 276–283, Mu-
nich, Germany.
Oguz, O., Akbas, C., Mallah, M., Tasdemir, K., Guzelcan,
E., Muenzenmayer, C., Wittenberg, T., Uner, A., Ce-
tin, A., and Atalay, R. (2016). Mixture of learners for
cancer stem cell detection using CD13 and H&E stai-
ned images. In Proc. SPIE Medical Imaging, pages
97910Y–1–97910Y–16, San Diego, CA.
Plissiti, M. E., Vrigkas, M., and Nikou, C. (2015). Seg-
mentation of cell clusters in Pap smear images using
intensity variation between superpixels. In Proc. 22
nd
International Conference on Systems, Signals and
Image Processing, pages 184–187, London, UK.
Rosas-Taraco, A., Higgins, D., S´anchez-Campillo, J., Lee,
E., Orme, I., and Gonz´alez-Juarrero, M. (2011). Lo-
cal pulmonary immunotherapy with siR NA targe-
ting TGFβ1 enhances antimicrobial capacity in my-
cobacterium tuberculosis infected mice. Tuberculosis,
91(1):98–106.
Sjostrom, P., Frydel, B., and Wahlberg, L. (1999). Artificial
neural network-aided image analysis system for cell
counting. Cytometry, 36:18–26.
Zhang, C., Yarkony, J., and Hamprecht, F. (2014). Cell de-
tection and segmentation using correlation cl ustering.
In Proc. Medical Image Computing and Computer-
Assisted Intervention, pages 9–16, Boston, MA.
VISAPP 2018 - International Conference on Computer Vision Theory and Applications
490
