
The Effect of Marketing Imperfection Variables on Production in the
Context of Brazilian Agriculture
Geraldo da Silva e Souza and Eliane Gonçalves Gomes
Embrapa, Secretaria de Gestão e Desenvolvimento Institucional – SGI,
Parque Estação Biológica, Av. W3 Norte Final, 70770-901, Brasília, DF, Brazil
Keywords: Stochastic Frontier, Endogeneity, Market Imperfections, Agricultural Census.
Abstract: In the context of the Brazilian agriculture it is of importance for policy makers the assessment of the effect
on production of variables related to market imperfections. Market imperfection or asymmetry occurs when
farmers are subjected to different market conditions depending on their size or their importance on overall
state production. Relatively large rich farmers obtain lower input prices and may sell their production at
lower prices making competition harder for small farmers. Market imperfections are typically associated
with infrastructure, environment control requirements and the presence of technical assistance. In this
article, at county level and using agricultural census data, we estimate the elasticities of these variables on
production by maximum likelihood methods. We show that all these variables affect production
significantly. Technological inputs dominate the production response, followed by labor and land.
Environment control has a positive effect on production, as well as technical assistance. The logistics of
production mostly affects technical efficiency. The proportion of forested areas has a negative elasticity. We
also test technical assistance for endogeneity.
1 INTRODUCTION
The dataset of the Brazilian agricultural census of
2006 has been extensively studied, with primarily
interest in topics related to production economy. A
typical example of this literature is Helfand et al.
(2015). An instance analyzing regional aspects of
the 2006 census can be seen in Alves et al. (2017).
The Brazilian agricultural census of 2006
indicated a high concentration of production in the
agricultural sector. See Alves et al. (2013) for
details. In fact, the agriculture modernization in the
recent past left out 3.9 million rural establishments,
of a total of 4.4 million. Only five hundred thousand,
11.4% of the total, produced 87% of the total
production value in 2006. These facts motivate
studies identifying factors of importance for public
policies leading to productive inclusion in
agriculture in Brazil. Proper policies would increase
the rural gross domestic product significantly and
simultaneously reduce rural income concentration.
Some studies in this topic are Alves et al. (2013),
Ney and Hoffman (2008, 2009), Ferreira and Souza
(2007) and Neder and Silva (2004).
Market imperfections are the main cause
inhibiting the access of farmers to technology and,
therefore, to productive inclusion. This concept is
discussed in Alves and Souza (2015). Market
imperfections are the result of asymmetry in credit
for production, infrastructure, information
availability, rural extension and technical assistance,
among others.
Market imperfections are typically unfavorable
to the small production. The lack of physical
infrastructure and education make it difficult the
rural extension to fulffill its role and, therefore, the
proper access to technology. Another point to be
emphasized is related to the imperfection of the
production markets. Souza et al. (2017) highlight
that small farmers sell their products at lower values
and buy inputs at higher prices. The larger producers
are able to negotiate better input and output prices
and the existence of these different prices also
characterizes a market imperfection. The
unfavorable negotiation may lead to higher prices
for the adoption of better technologies and, thus,
lead to difficulties to achieve higher economic
efficiency.
Souza, G. and Gomes, E.
The Effect of Marketing Imperfection Variables on Production in the Context of Brazilian Agriculture.
DOI: 10.5220/0006509300150020
In Proceedings of the 7th International Conference on Operations Research and Enterprise Systems (ICORES 2018), pages 15-20
ISBN: 978-989-758-285-1
Copyright © 2018 by SCITEPRESS – Science and Technology Publications, Lda. All rights reser ved
15

Our contribution to this literature is the
identification, on a county basis, of a set of
covariates representing proxies to infrastructure,
environmental aspects and technical assistance,
potentially related to market imperfections affecting
production and the technical efficiency of
production. The analysis is based on maximum
likelihood estimation under endogeneity, assuming a
stochastic frontier defined by a normal-half normal
combination, where technical assistance is
endogenous and infrastructure aspects affects the
inefficiency component of the model.
2 DATA
The main data source for this paper is the Brazilian
agricultural census of 2006 (IBGE, 2012a). We also
used variables computed from the demographic
census of 2010 and from other official sources of
information. We follow the approach of Souza et al.
(2013, 2017) in the definition of production and
contextual variables.
Production (inputs and output) is defined using
monetary values. The output variable is the value of
production and the inputs are expenses on labor,
land and technological inputs, which includes
machinery, improvements in the farm, equipment
rental, value of permanent crops, value of animals,
value of forests in the establishment, value of seeds,
value of salt and fodder, value of medication,
fertilizers, manure, pesticides, expenses with fuel,
electricity, storage, services provided, raw materials,
incubation of eggs and other expenses. Value of
permanent crops, forests, machinery, improvements
on the farm, animals and equipment rental were
depreciated at a rate of 6 percent a year (machines –
15 years, planted forests – 20 years, permanent
cultures – 15 years, improvements – 50 years,
animals – 5 years). Farm data from the agricultural
census were aggregated to form totals for each
county. A total of 4,965 counties (almost 90% of the
total) provided valid data for our analysis.
The contextual variables we chose are a
performance county index of social development,
the proportion of farmers who received technical
assistance, the proportion of non-degraded areas and
the proportion of forested areas.
The index of social development reflects the
level of well-being, favored by factors such as the
availability of water and electric energy in the rural
residences, level of education, health and poverty in
the rural households. It was computed as a weighted
average of normalized ranks of the following
variables: education (illiteracy rate), poverty index,
average gross per capita income of rural households,
proportion of farms with access to electricity and
water, index of basic education, index of
performance of the public health system and
vulnerability of children up to 5 years old. These
indicators were obtained from the Brazilian
demographic census 2010 (IBGE, 2012b), from the
Brazilian agricultural census 2006 (IBGE, 2012a),
and from the databases of the National Institute of
Research and Educational Studies (INEP), referring
to education in 2009 (INEP, 2012), and of the
Ministry of Health 2011 data (Ministério da Saúde,
2011). The social score was computed using the
ranks of these measurements, weighted by the
relative multiple correlation coefficient. We see
these contextual variables as proxies to market
imperfections
3 METHODOLOGY
Our approach to assess production and efficiency of
production follows along the lines of Karakaplan
and Kutlu (2013) and Karakaplan (2017). The
structural model for our application is defined by (1)
for county i, where techassist is assumed
endogenous and
i
y
is the log of gross income.
tindependen ,
exp
,0~
,0~
loglog
loglog
loglog
87
2
2
2
65
43
210
ii
iui
uii
i
ii
ii
ii
iii
uv
socialbb
Nu
Nv
uv
techassistbndareasb
forestbtechinputsb
landblaborbby
(1)
Endogeneity in this context means correlation of
the endogenous variable with
i
v
. This assumption
invalidates the classic stochastic frontier analysis. A
convenient approach is to use two stage least squares
or general method of moments (GMM), as suggested
in Amsler et al. (2016). Karakaplan and Kutlu
(2013) suggest the use of instrumental variables in a
context of maximum likelihood estimation,
resembling classical frontier analysis. In our
application we follow this approach and the
instruments considered for techassist are the
exogenous variables plus a demographic indicator.
ICORES 2018 - 7th International Conference on Operations Research and Enterprise Systems
16

The instrumental variable regression is presented in
(2).
iii
ii
iii
demodndareasd
forestdtechinputsd
landdlaborddtechassist
65
43
210
log
loglog
loglog
(2)
We assume the variance-covariance matrix of the
error term of this regression to be of the form
I
2
.
Let
be the correlation between
i
and
i
v
.
Endogeneity means
0
. We assume (3).
2
1
,
0
0
~
~
N
vv
i
i
i
i
(3)
Using a Cholesky decomposition we may write
(4), leading to the new frontier equation (5).
i
i
i
i
wv
~
~
1
01
~
2
(4)
ii
ii
ii
ii
iii
ww
uw
techassistbndareasb
forestbtechinputsb
landblaborbby
~
1
~
loglog
loglog
loglog
2
i
65
43
210
(5)
The component
i
~
is the correction term for
bias. The test of
0
is an endogeneity test. The
model is estimated by maximum likelihood. The
likelihood function is given by (6), as stated in
Karakaplan (2017).
2
ln2ln
ln
2
ln2ln
log
1
1
22
1
22
n
i
n
i
i
n
i
Si
ii
SiiSi
e
e
L
(6)
In (6),
uii
and
222
uiSi
.
i
e
is
defined as in (7).
i6
5
43
210
~
log
log
loglog
loglog
i
i
ii
ii
ii
techassistb
ndareasb
forestbtechinputsb
landblaborbb
ye
(7)
4 STATISTICAL RESULTS
The results of the maximum likelihood estimation
described above applied to our dataset led to the
statistical inference results reported in Table 1.
We see that the endogeneity effect is not
statistically significant. Technological inputs
dominate the production function, followed by labor
and land. See Table 2 for the relative elasticity
results, with the corresponding standard errors. This
result has strong implications for technology
diffusion in the Brazilian agriculture. Producers who
are not able to use technological inputs will not be
productive and will be very likely inefficient. This is
a clear message for public policies related to
agricultural extension. An effort must be made to
reduce market imperfections to increase productive
inclusion, particularly for small farmers. From Table
2 we see that the technology shows decreasing
returns to scale, fact that allows net income
maximization.
Technical assistance, non-degraded areas and
proportion of forested areas are all statistically
significant (Table 1). The former act favoring
production and the latter has a negative effect. The
direct implication is that caring for the environment
will cost more for production in the short run. Here
we see the importance of the rural extension and
public policies, both envisaging adding value to
forest preservation. As far as rural development
indicators are concerned, we see environment as
closely related to technology. The non endogeneity
of technical assistance is an important fact, since it
allows the use of this variable in regressions, as in
Souza et al. (2013, 2017a).
Table 3 shows 5-number summaries for technical
efficiency. Figure 1 shows the corresponding box
plots for the efficiency measurements. Efficiency
differs significantly by region. The social indicator
affects positively technical efficiency, as reported in
Table 1. Regions that are to benefit the most with
improvements in the social indicators are the North
and Northeast. This is clear from Figure 1, where
efficiencies in the Northern and Northeastern
regions are dominated by the corresponding
measurements in the other regions. We notice that
efficiency is a monotone increasing function of the
social indicator.
Although technical assistance has a positive
overall effect (Table 1), as already pointed out by
Souza et al. (2017b), on a regional basis, technical
assistance is not reaching properly the Northern and
Northeastern regions. Issues of infrastructure and
market imperfections are very likely affecting the
The Effect of Marketing Imperfection Variables on Production in the Context of Brazilian Agriculture
17

majority of rural producers, inhibiting the proper use
of technology. The fact observed in Souza et al
(2017b) is that income concentration is highly
correlated with efficiency in all regions, indicating
that technology concentrates income in the rural
Brazil.
Table 1: Maximum likelihood estimation results.
Coefficient
Standard error
z
P>|z|
[95% Confidence interval]
Frontier – y
log(labor)
0,23115
0,011531
200,04
0,000
0,208536
0,253738
log(land)
0,09003
0,013968
60,45
0,000
0,062653
0,117406
log(techinputs)
0,45581
0,021104
210,60
0,000
0,414446
0,497173
forest
-0,12398
0,032878
-30,77
0,000
-0,188420
-0,059540
ndareas
0,25014
0,036281
60,89
0,000
0,179030
0,321249
techassist
0,56781
0,140459
40,04
0,000
0,292514
0,843105
constant
20,7368
0,104023
260,31
0,000
20,532930
20,940690
Instruments – techassist
demographic
-0,12634
0,028992
-40,36
0,000
-0,18316
-0,069520
log(labor)
-0,02131
0,003139
-60,79
0,000
-0,027470
-0,015160
log(land)
0,00791
0,003929
20,01
0,044
0,000207
0,015606
log(techinputs)
0,07774
0,004742
160,39
0,000
0,068443
0,087031
forest
0,02043
0,009285
20,20
0,028
0,002227
0,038624
ndareas
0,08650
0,008944
90,67
0,000
0,068967
0,104026
social
0,65907
0,015642
420,14
0,000
0,628409
0,689723
constant
-0,44813
0,023053
-190,44
0,000
-0,493310
-0,402940
2
ln
u
social
-20,1779
0,737983
-20,95
0,003
-30,6243
-0,73147
constant
-20,4784
0,762352
-30,25
0,001
-30,9726
-0,98419
2
ln
w
constant
-0,9899
0,027306
-360,25
0
-10,0434
-0,93638
Endogeneity Test (
0
)
Ho: Correction for endogeneity is not necessary.
Ha: There is endogeneity in the model and correction is needed.
2
(1) = 1.75
Prob >
2
= 0.1858
Result: Cannot reject Ho at 10% level.
Table 2: Relative elasticities.
Item
Relative elasticity
Standard error
Labor
0.297
0.016
Land
0.116
0.018
Technology
0.587
0.022
Returns to Scale
0.777
0.014
ICORES 2018 - 7th International Conference on Operations Research and Enterprise Systems
18
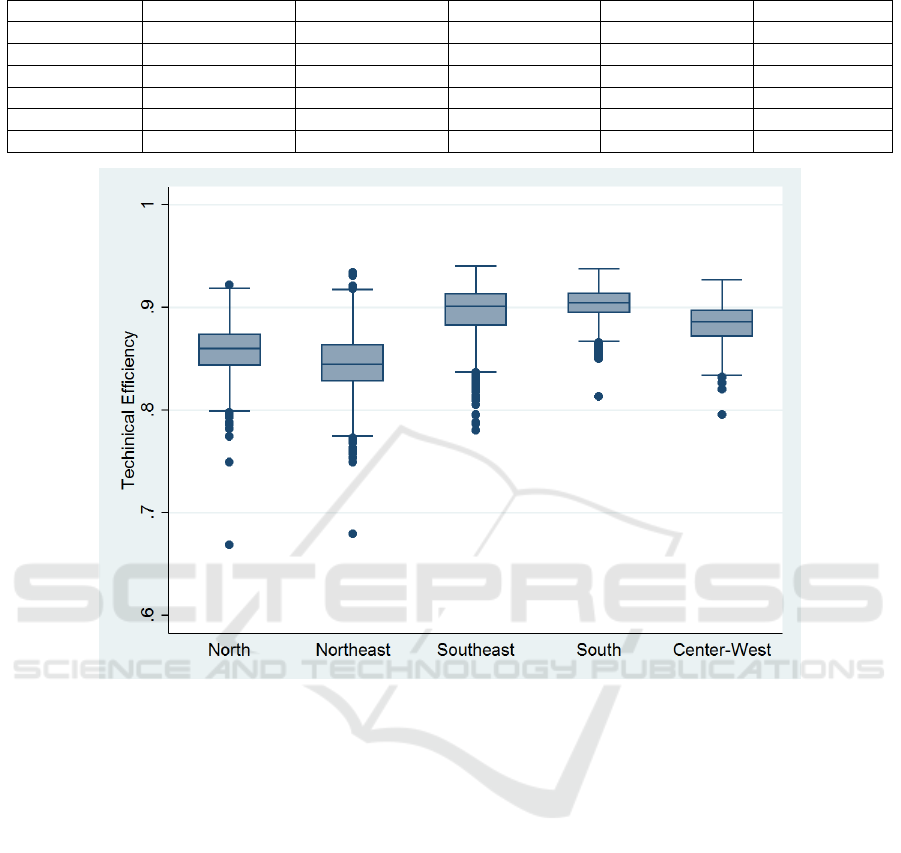
Table 3: Technical efficiency – 5-number summary.
Region
Min
Q1
Median
Q3
Max
All
0,669
0,851
0,883
0,905
0,941
North
0,669
0,843
0,860
0,874
0,922
Northeast
0,679
0,828
0,845
0,864
0,934
Southeast
0,780
0,882
0,901
0,913
0,941
South
0,813
0,895
0,905
0,914
0,938
Center-west
0,795
0,872
0,886
0,897
0,927
Figure 1: Box-plots of technical efficiency by region.
5 CONCLUDING REMARKS
We fitted a stochastic frontier under endogeneity to
county data using the Brazilian agricultural census
of 2006 – the last available. The objective of this
study, besides assessing input elasticities, was to
investigate effects of market imperfection variables
on production. Market imperfections come from
different realities in production experienced by small
and large farmers. They relate to infrastructure, level
of education, access to credit, implying in different
input and output prices for small and large farmers.
The presence of imbalances in market imperfection
makes it harder for rural extension and technical
assistance to promote productive inclusion.
For public policy decision making it is of
importance the identification of component
elasticities to guide rural governmental assistance.
This is critical to reduce poverty in the fields and to
increase production. We conclude that technology is
the main input factor to increase income in rural
Brazil. The social indicator is the key variable to
reduce inefficiency. The indicator is relatively too
low for the Northern and Northeastern regions.
Values are less than half of the corresponding values
of other regions. Public policies should be oriented
to improve this indicator particularly in these
regions. This means to improve infrastructure,
education and health. These are overall issues to be
handled both by the regional and national
governments.
Technology is knowledge created by research
and applied by producers through production
systems. Mimicking other studies, it seems that only
a few farmers are able to develop production
systems that benefit from technology. Small scale
agriculture needs to be reassessed and refocused, by
means of public policies, to be able to access
technology and become profitable.
The Effect of Marketing Imperfection Variables on Production in the Context of Brazilian Agriculture
19

Rural extension and technical assistance have a
direct positive effect on income. Improvement of the
social indicator will tend to facilitate the access of
technical assistance creating, this way, a synergic
positive effect on income.
Environment in our study was measured in two
ways: non-degraded areas and the proportion of
forested areas. Keeping non-degraded areas relates
to technology and has a positive impact on
production. On the other hand, keeping a relative
large area of uncultivated land in the farm will have
a negative effect on income. Extension and technical
assistance may be the key factor to extract value
from forests and properly preserve these areas.
REFERENCES
Alves, E., Souza, G.S., 2015. Pequenos estabelecimentos
em termos de área também enriquecem? Pedras e
tropeços. Revista de Política Agrícola 24:7–21.
Alves, E., Souza, G.S., Marra, R., 2017, Uma viagem
pelas regiões e estados guiada pelo Censo
Agropecuário 2006. Revista de Política Agrícola
26:113–150.
Alves, E., Souza, G.S., Rocha, D.P., 2013. Desigualdade
nos campos sob a ótica do censo agropecuário 2006.
Revista de Política Agrícola 22:67–75.
Amsler, C., Prokhorov, A., Schmidt, P., 2016.
Endogeneity in stochastic frontier models. Journal of
Econometrics 190: 280–288.
Ferreira, C.R., Souza, S.C.I., 2007. As aposentadorias e
pensões e a concentração dos rendimentos
domiciliares per capita no Brasil e na sua área rural:
1981 a 2003. Revista de Economia e Sociologia Rural,
45(4):985–1011.
Helfand, S.M., Moreira, A.R.B., Bresnyan, Jr, E.E., 2015.
Agricultural Productivity and Family Farms in Brazil:
Creating opportunities and closing gaps. Available at
https://economics.ucr.edu/people/faculty/helfand/Helfa
nd%20Ag%20Productivity%20and%20Family%20Far
ms%20in%20Brazil%202015.pdf. Accessed 25 Oct
2017.
IBGE, 2012a. Censo Agropecuário 2006. Available at
http://www.ibge.gov.br/home/estatistica/economia/agr
opecuaria/censoagro/. Accessed 24 Jan 2012.
IBGE, 2012b. Censo Demográfico 2010.
http://censo2010.ibge.gov.br/. Acessed 24 Jan 2012.
INEP, 2012. Nota Técnica do Índice de Desenvolvimento
da Educação Básica. http://ideb.inep.gov.br/
resultado/. Accessed 24 Jan 2012.
Karakaplan, M.U., 2017. Fitting endogenous stochastic
frontier models in Stata. The Stata Journal 17(1):39–
55.
Karakaplan, M.U., Kutlu, L., 2013. Handling endogeneity
in stochastic frontier analysis. Available at
http://www.mukarakaplan.com/Karakaplan%20-
%20EndoSFA.pdf Accessed 10 March 2017.
Ministério da Saúde, 2011. IDSUS – Índice de
Desempenho do SUS. Ano 1.
http://portal.saude.gov.br/. Acessed 2 March 2012.
Neder, H.D., Silva, J.L.M., 2004. Pobreza e distribuição
de renda em áreas rurais: uma abordagem de
inferência. Revista de Economia e Sociologia Rural,
42(3):469-486.
Ney, M.G., Hoffmann, R., 2008. A contribuição das
atividades agrícolas e não-agrícolas para a
desigualdade de renda no Brasil rural. Economia
Aplicada, 12(3):365-393.
Ney, M.G., Hoffmann, R., 2009. Educação, concentração
fundiária e desigualdade de rendimentos no meio rural
brasileiro. Revista de Economia e Sociologia Rural,
47(1):147–181.
Souza, G.S., Gomes, E.G., Alves, E.R.A., 2017a.
Conditional FDH efficiency to assess performance
factors for Brazilian agriculture. Pesquisa Operacional
37:93–106.
Souza, G.S., Gomes, E.G., Alves, E.R.A., 2017b. Market
imperfections and income concentration: Global and
regional perspectives on Brazilian agricultural
production performance. Proceedings of the 21st
IFORS Triennial Conference. Quebec, 222–222.
Souza, G.S., Gomes, E.G., Alves, E.R.A., Magalhães, E.,
Rocha, D.P., 2013. Um modelo de produção para a
agricultura brasileira e a importância da pesquisa da
Embrapa. In: Alves, E.R.A., Souza, G.S., Gomes, E.G.
(eds.). Contribuição da Embrapa para o
desenvolvimento da agricultura no Brasil, p. 49–86.
ICORES 2018 - 7th International Conference on Operations Research and Enterprise Systems
20
