
A New Technique for Phase Shift Measurements based on Amplitude
Estimations
Tatiana Yakovleva
Federal Research Center “Computer Science and Control” of Russian Academy of Sciences, Vavilova st., Moscow, Russia
Keywords: Phase Shift Measurement, Quasi-Harmonic Signal, Rice Distribution, Signal Sampling, Signal Processing
Algorithms.
Abstract: The paper presents a new original technique for the accurate real time measuring of the phase shift between
two quasi-harmonic optical signals based upon the estimation of amplitudes of the both initial quasi-
harmonic signals and the third signal that is formed by summation the first two ones. The required phase
difference is then calculated as an angle of a triangle formed by the reconstructed undistorted signals’
amplitudes values. An important peculiarity of the proposed technique consists in the fact that the phase
data are obtained as a result of the amplitude measurements only what significantly decreases the demands
to the measuring equipment. For the amplitude values estimation the methods of the Rician data analysis are
proposed to be applied. The paper provides both the mathematical substantiation of the technique and its
computer simulation results. The elaborated method is meaningful for various applied tasks to be solved in
numerous ranging and communication systems.
1 INTRODUCTION
The accurate measuring of two signals’ phase
difference is one of the most important problems in
various fields of science and technology, such as
radio-physics, optics, radiolocation, radio-
navigation, etc. Such measurements are in the use at
distance measurements, in ranging systems, at
determining the object’s geometrical parameters, at
non-destructive control and in many other applied
tasks (Kinkulkin, Rubtsov, Fabrik, 1979; Chmykh,
1993; Smirnov, Kucherov, 2004).
The problem of measuring the phase difference
has been investigated for a long time and many
various methods for its solving have been
elaborated. These methods include the phase
compensation technique, the transformation of the
time interval into the voltage (Chmykh, 1993), the
digital technique of accounting the number of pulses
(Webster, 2004; Mahmud, 1989), the phase
measuring method accompanied by the frequency
transform (Chmykh, 1993; Webster, 2004), the
correlation methods (Chmykh, 1993; Webster, 2004;
Liang, Duan, Yeh, Luo, 2012), the Fourier
transformation technique with the further extraction
of the phase component (Webster, 2004; Mahmud,
1989, Mahmud,1990), the least square adjustment
method with the data fitting for a sinus-shaped
signal (Sedlacek, Krumpholc, 2005).
A number of existing phase measuring methods a-
priori use a harmonic signal model (Kinkulkin,
Rubtsov, Fabrik, 1979), i.e. imply the constant
amplitude’s value, what does not correspond to the
real circumstances. In practice we normally have the
so-called quasi-harmonic signal that is characterized
by the random variations of the signal’s amplitude
due to the Gaussian noise. Such amplitude’s
variation is a serious obstacle for the accurate phase
measuring (Chmykh, 1993; Ignat'ev, Nikitin,
Yushanov, 2010). A number of various parametric
techniques have been proposed for the signal’s phase
measurements (Ignat'ev, Nikitin, Yushanov, 2013;
Ramos, Serra, 2008; Hing, Cheung So, Zhenhua,
Zhou, 2013), which imply the calculation of rather a
big number of the signals’ parameters and normally
demand a significant volume of computational
resources.
The original method of the signals’ phase
difference measuring elaborated in the present paper
differs in principle from the methods of the prior art
as it is based entirely upon measuring and
processing the amplitude values only.
Yakovleva, T.
A New Technique for Phase Shift Measurements based on Amplitude Estimations.
DOI: 10.5220/0006516201250129
In Proceedings of the 6th International Conference on Photonics, Optics and Laser Technology (PHOTOPTICS 2018), pages 125-129
ISBN: 978-989-758-286-8
Copyright © 2018 by SCITEPRESS – Science and Technology Publications, Lda. All rights reserved
125

2 THE PROBLEM SETTING AND
BASIC DEFINITIONS
In order to consider the phase difference between
two quasi-harmonic signals let us clarify the
concepts to be used. In practice an inevitable noise
influence results in the random variations of the
signal’s amplitude. Therefore the quasi-harmonic, or
quasi-sinusoidal signal is to be considered instead of
a sine-shaped signal. In each moment of time
t
a
signal to be analyzed can be presented as follows:
( ) ( ) sinx t R t t t
(1)
where
is the common frequency,
()Rt
is the
signal’s amplitude, or envelope that randomly varies
due to the Gaussian noise influence, and
t
is the
phase shift that also changes randomly in time under
the noise influence. Normally the signal contains
also the slowly changing additive “white” Gaussian
noise. It can be filtered and its presence is not
critical for measuring the phase
t
. To ensure
the convenient graphical representation we’ll
consider the signal (1) in a complex plane (as a
complex value) denoting it as
St
:
( ) ( ) exp
exp
S t R t i t t
s t i t
(2)
For measuring the signals’ phases we’ll analyze
the “slow” signal’s component
( ) ( ) exps t R t i t
. Let us denote the
initial, undistorted complex signal as vector
0
,AA
. It is characterized by a determined
amplitude value
A
and a phase
0
. The signal’s
propagation through any medium is inevitably
accompanied by its noising, namely – the initial
signal’s real
0
cosA
and imaginary
0
sinA
parts are independently varied by a lot of random
noise components. Let us denote by
,rr
a
noise component that is superimposed on the initial
signal
A
. The components
,
xy
rr
of the noise
vector
r
are independent and obey the normal
distribution:
0
xy
rr
,
2 2 2
xy
rr
, where
2
is a noise dispersion value. Obviously the
amplitude
r
and the phase
are distributed as
follows: amplitude
r
obeys the Rayleigh
distribution, while the noise components’ phase
is distributed uniformly in interval (0,
2
).
We’ll denote by vector
,RR
the resulting
signal that is formed by summing the initial signal
A
and noise
r
:
R A r
. The real and
imaginary parts of
R
can be written as follows:
0
0
cos cos cos ;
sin sin sin
R A r
R A r
(3)
The statistical distribution of amplitude
R
and
phase
of resulting signal
R
is determined by
their joint distribution function (Rytov, 1976) that
can be calculated from (3).
2
22
2
1
,
2
1
exp 2 cos
2
W R dRd
A R AR a RdRd
(4)
As one can see from (4), the distributions of the
resulting signal’s amplitude
R
and its phase
are
not independent, and phase
as distinct from phase
is not a uniformly distributed value.
Having integrated (4) by
between the limits
from 0 to
2
one can obtain an expressions for the
distribution function for amplitude
R
of resulting
signal
R A r
:
2 2 2
2
0
/2
0
22
,
R
RA
W R dR dR W R d
RdR RA
Ie
(5)
At obtaining (5) an integral representation for the
modified Bessel function has been used
(Abramowitz and Stegun, 1964):
2
cos
0
0
1
2
zt
I z e dt
. From (5) it follows that
PHOTOPTICS 2018 - 6th International Conference on Photonics, Optics and Laser Technology
126
amplitude
R
obeys to the Rice distribution with
parameters
2
,A
(
2
is the Gaussian noise
dispersion value). So, the influence of noise can be
mathematically described as “blurring” the initial
signal’s vector
А
of amplitude
A
so that its
amplitude becomes a random value
RR
that
obeys the Rice distribution.
3 ESSENCE OF THE PROPOSED
TECHNIQUE
The mathematical problem to be solved consists in
measuring the phase shift between two quasi-
harmonic signals that are propagating in different
channels. The task consists in measuring these
signals’ phase difference as an indicator of the
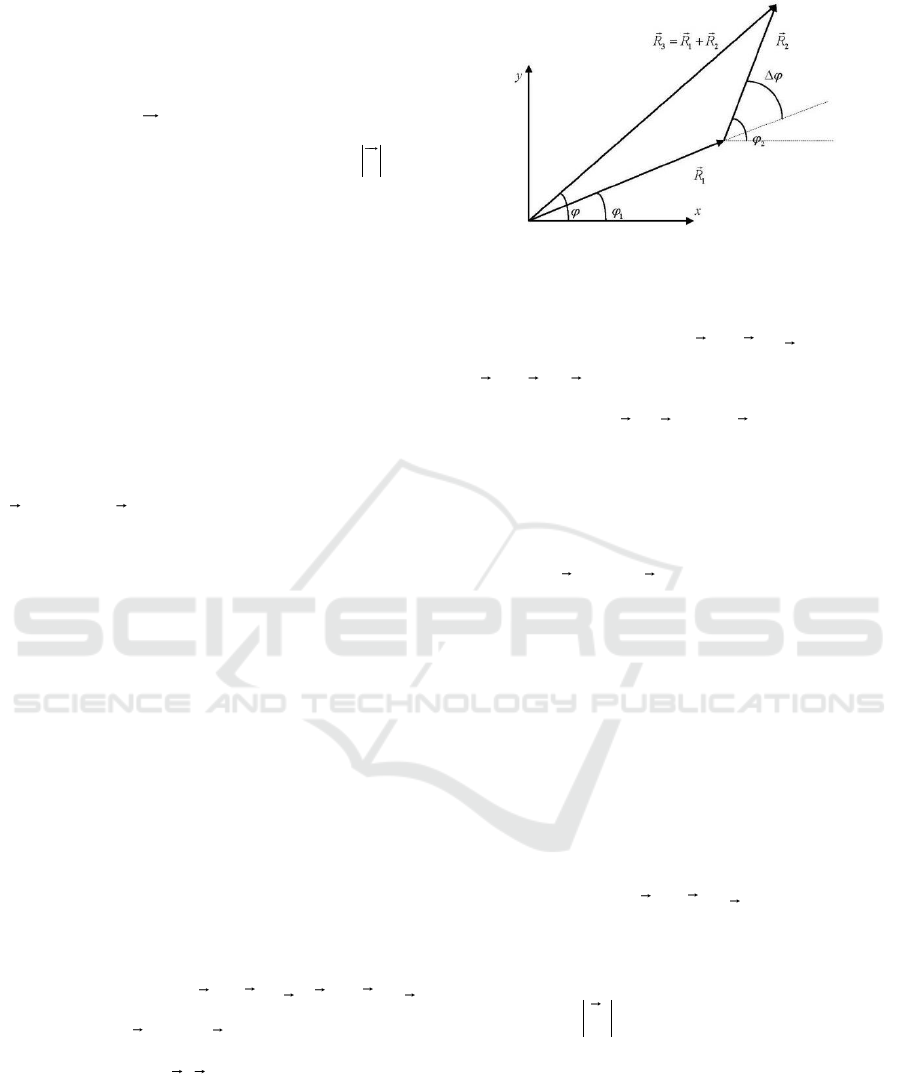
object or the process to be studied. We can present
these signals as the following vectors:
1 1 1 2 2 2
, , ,R R R R
as illustrated in Fig.1.
The values of quasi-harmonic signals’
amplitudes
1
R
and
2
R
obey the Rice distribution
with parameters (
2
1
,A
), and (
2
2
,A
), where
1
A
and
2
A
are the initial, undistorted signals’
amplitudes,
2
is the Gaussian noise dispersion. It
is natural to suppose that such a dispersion value is
the same for the both channels by which the two
signals are propagating, although the mathematical
analysis provided below can be easily generalized
for a case of different dispersion values. In the
further calculations we’ll use a-priori knowledge
that the phase difference
21
between
the considered signals is unambiguously determined
by the physical properties of the object or the
process being studied.
The noised signals to be measured can be put
down as follows:
1 1 1
,R A r
2 2 2
R A r
,
where vectors
1
A
and
2
A
denote the two initial,
undistorted signals,
12
,rr
- the noise vectors, each
of them being characteristic for a corresponding
channel of the signal propagation. The phase
difference
between the two signals is equal to
an angle between the corresponding vectors.
Figure 1: Illustration of the signals to be analysed.
Let us introduce the third vector that is equal to
the sum of the two signals being analyzed. We
denote it as vector
3 3 3
R A r
, where
3 1 2
A A A
- the sum of the first two undistorted
signals. Vectors
1
R
,
2
R
and
3
R
form a triangle,
and the phase difference between the two signals can
be determined from this triangle on the basis of the
triangle sides’ values, i.e. the signals amplitudes’
values.
Obviously, the sought for phase difference
between
1
A
and
2
A
could be most precisely
calculated if we would be able to “freeze” the
triangle at the undistorted, noise-free state. However,
the inevitable noise distorts each vector
independently and the amplitudes measured in each
moment of time would provide a false, distorted
value for the sought for phase shift, whereas the
required phase shift may be correctly found only
from the triangle formed by the initial, undistorted
amplitudes:
1 2 3
,,A A A
. As it has been shown above
the signals’ amplitudes obey the Rice distribution
with the Rician parameters (
2
,
i
A
),
1,2i
. As
for the third signal
3 3 3
R A r
, its amplitude can
be shown to obey the Rice distribution as well. The
parameters of this distribution are:
2
3
,2A
,
where
33
AA
. As the amplitudes measured in
samples provide the distorted data for the lengths of
the triangle sides, they need to be processed in such
a way that would allow getting the undistorted
values
1 2 3
,,A A A
. This means that we have to
determine the corresponding Rician parameters’
values.
The so-called two-parameter methods elaborated
in (Yakovleva, Kulberg, 2013; Yakovleva, Kulberg,
A New Technique for Phase Shift Measurements based on Amplitude Estimations
127

2014; Yakovleva, 2014; Yakovleva, 2015) allow an
accurate estimating of both the signal
, 1,2,3
i
Ai
and noise (
2
) parameters based
upon the sampled measurements. In other words, by
means of calculating the initial, undistorted values of
the three signals’ amplitudes we would “freeze” the
picture as a noise-free one and thus calculate the
needed phase difference value just on the basis of
geometrical considerations by the formula:
222
3 1 2
12
arccos
2
AAA
AA
(6)
Below some results of the numerical simulation of
the proposed technique are presented. Table 1
demonstrates the dependence of the absolute error
modulus
calc
err
at calculating the
sought for signal’s phase shift upon a number of
parameters such as the sample length, the signal-to-
noise ratio, etc. The denotations are as follows:
calc
- the phase shift calculated according to the
above algorithm,
- the real phase shift (at the
numerical experiment illustrated by Table 1 the
value of the real phase shift was equal to 1,318),
12
0,5( )/SNR A A
- the value that
characterizes the signal-to-noise ratio,
n
- the
number of measurements in a sample.
Table 1 presents the results of the technique’s
numerical simulation, i.e. the calculated values of
the absolute error modulus are provided, at
averaging by
3
10
av
N
measurements.
Table 1: Numerically calculated magnitude of the absolute
error modulus
calc
err
as dependent on the
signal-to-noise ratio
SNR
and the sample length.
n
.
SNR=10
2
SNR=0.25 10
3
SNR=0.5 10
3
SNR=10
3
n=8
4
4,2 10
4
1,4 10
5
5,8 10
5
1,2 10
n=16
4
1,8 10
4
0,9 10
5
4,9 10
5
1,0 10
4 CONCLUSIONS
The paper presents an original technique of
measuring the phase difference between two quasi-
harmonic optical signals based upon the statistical
processing of the amplitudes values of the following
three signals: the two compared signals and their
sum. The theoretical consideration of the problem is
provided. The amplitudes of the three signals to be
analyzed are shown to obey the Rice statistical
distribution. The algorithm of the proposed
technique implementation consists in the joint
reconstruction of the undistorted signals’ amplitudes
against the noise background. Therefore the sough
for phase shift is obtained as a result of the
amplitude measurements only what significantly
decreases the demands to the equipment and
simplifies the realization of the proposed method in
a wide circle of applied tasks to be solved in
numerous ranging and communication systems. The
digital experiments confirm the theoretical
conclusions on the feasibility and efficiency of the
proposed technique.
The work was funded by RFBR according to the
research project № 17-07-00064.
REFERENCES
Kinkulkin, I. E., Rubtsov, V. D., Fabrik, M. A. 1979. The
Phase Method of Coordinates’ Determination,
Moscow. Sov. Radio, 160p.
Chmykh, M. K. 1993. Digital Phase Meter, Moscow, Radio
i svyaz', 184p.
Smirnov, V. N., Kucherov, M. V. 2004. Broadband digital
phasemeter, Voprosy radioelektroniki, vol.1, pp. 33-
41.
Webster, J. G. (Ed.), 2004. Electrical Measurement,
Signal Processing, and Displays, Boca Raton: CRC
Press, 320p.
Mahmud, S. M. 1989. Error analysis of digital phase
measurement of distorted waves, IEEE Trans. on
Instrumentation and Measurement, vol. 38, N 1, pp. 6-
9.
Liang, Y. R., Duan, H. Z., Yeh, H. C., Luo, J. 2012.
Fundamental limits on the digital phase measurement
method based on cross-correlation analysis, Rev. Sci.
Instrum., vol. 83, N 9, 095119.
Mahmud, S. M. 1990. High precision phase measurement
using reduced sine and cosine tables, IEEE Trans. on
Instrumentation and Measurement, vol. 39, N 1, pp.
56-50.
Mahmud, S. M. 1989. High precision phase measurement
using adaptive sampling, IEEE Trans. on
Instrumentation and Measurement, vol. 38, N 5, pp.
954–960.
Sedlacek, M., Krumpholc, M. 2005. Digital measurement
of phase difference - a comparative study DSP
algorithms, Metrology and Measurement Systems, vol.
XII, N 4, pp. 427–449.
Ignat'ev, V. K., Nikitin, A.V., Yushanov, S.V. 2010.
Parametric analysis of oscillations with slowly varying
PHOTOPTICS 2018 - 6th International Conference on Photonics, Optics and Laser Technology
128

frequency, Radiophysics and quantum electronics, vol.
53, N 2, pp. 132-145.
Ignat'ev, V. K., Nikitin, A.V., Yushanov, S.V. 2013.
Measurement of the quasi-harmonic signals’ phase
shift, Numerical Methods and Programming, vol. 4,
pp. 424-431.
Ramos, Pedro M, Serra, Antonio Cruz. 2008. A new sine-
fitting algorithm for accurate amplitude and phase
measurements in two channel acquisition systems,
Science Direct Measurement, vol. 41, pp. 135–143.
Hing, Cheung So and Zhenhua, Zhou, 2013. Two accurate
phase-difference estimators for dual-channel sine-
wave model, EURASIP Journal on Advances in
Signal Processing, vol. 122, pp. 1-10.
Rytov, S. M. 1976. Introduction into Statistical Radio-
physics, part 1. Random Processe, Moscow. Nauka,
494p.
Abramowitz, M., Stegun, I. A. 1964. Handbook of
Mathematical Functions with Formulas, Graphs and
Mathematical Tables, Applied Mathematics Series 55.
Washington D.C., USA, 1046p.
Yakovleva, Tatiana V., Kulberg, Nicolas S. 2013. Noise
and Signal Estimation in MRI: Two-Parametric
Analysis of Rice-Distributed Data by Means of the
Maximum Likelihood Approach, American Journal of
Theoretical and Applied Statistics, vol. 2, N 3, pp. 67-
79.
Yakovleva, T. V., Kulberg, N. S. 2014. Methods of
Mathematical Statistics in Two-Parameter Analysis of
Rician Signals, Doklady Mathematics, vol. 90, N 3,
pp. 1-5.
Yakovleva, T. V. 2014. Review of MRI processing
techniques and elaboration of a new two-parametric
method of moments, Computer Research and
Modeling, vol. 6, N 2, pp. 231-244.
Yakovleva, T. V. 2015. A Theory of Signal Processing at
the Rice Distribution, Dorodnicyn Computing Centre,
RAS, Moscow, 268p.
A New Technique for Phase Shift Measurements based on Amplitude Estimations
129
