
Robust Remote Heart Rate Determination for E-Rehabilitation
A Method that Overcomes Motion and Intensity Artefacts
Christian Wiede, Jingting Sun, Julia Richter and Gangolf Hirtz
Department of Electrical Engineering and Information Technology,
Chemnitz University of Technology, Reichenhainer Str. 70, 09126 Chemnitz, Germany
Keywords:
Remote Heart Rate Determination, rPPG, Vital Parameters, E-Rehabilitation.
Abstract:
Due to an increasing demand for post-surgical rehabilitations, the need for e-rehabilitation is continuously
rising. At this point, a continuous monitoring of vital parameters, such as the heart rate, could improve the
efficiency assessment of training exercises by measuring a patient’s physical condition. This study proposes
a robust method to remotely determine a person’s heart rate with an RGB camera. In this approach, we used
an individual and situation depending skin colour determination in combination with an accurate tracking.
Furthermore, our method was evaluated by means of twelve different scenarios with 117 videos. Altogether,
the results show that this method performed accurately and robustly for e-rehabilitation applications.
1 INTRODUCTION
In recent years, the number of rehabilitation as a part
of post-surgical care is continuously rising. Especi-
ally for surgeries of the musculoskeletal system, re-
habilitation is a key factor for recovering. In order to
prevent too light training or over-training a continu-
ous monitoring of the patient is necessary. One pos-
sibility to evaluate a person’s physical condition is to
measure his or her vital parameters, such as the heart
rate, the respiration rate or the oxygen saturation. In
this work, we focus on the remote determination of
the heart rate by means of an RGB camera.
This contact-less working principle has the advan-
tage that the patients are not required to wear addi-
tional devices during the training, which is inconve-
nient for the patients and, in addition to that, increases
the effort for the rehabilitation centres. Furthermore,
more significant information about the patient’s reha-
bilitation performance can be obtained. For example,
a sudden change of a patient’s physical condition can
be detected by monitoring the heart rate. In that case,
the training can be stopped and medical personnel can
be informed. Afterwards the training intensity can be
adapted.
However, e-rehabilitation is not the only applica-
tion field of remote heart rate determination. In the
field of ambient assisted living (AAL) such a remote
heart rate determination could contribute to a long-
term observation of the health status and assure a fast
response time in cases of emergencies. Furthermore,
such as system can also be applied for monitoring a
driver’s well-being in the context of autonomous dri-
ving and take control in emergency cases, e. g. a heart
attack.
For remote heart rate determination there exist
two general principles, which are intensity based met-
hods, such as proposed by Poh et al. (Poh et al.,
2010), and motion-based methods proposed by Ba-
lakrishnan (Balakrishnan et al., 2013). There are en-
hanced approaches as well, which combine the advan-
tages of both principles (Wiede et al., 2016b). Howe-
ver, these methods encounter problems with motion
and intensity artefacts, which poses challenges with
regard to the application in e-rehabilitation: When a
person moves during an exercise, the determined he-
art rate will be less accurate due to motion artefacts.
Similarly, intensity artefacts, such as reflections and
shadows, reduce the accuracy as well. In order to
overcome these issues, we propose a robust, remote
heart rate determination algorithm with an accurate
pixel tracking and a situation and person dependent
skin colour model. A database with reference data
was recorded for the evaluation of this method.
This work is structured as follows: In Sect. 2, the
related work in the field of remote heart rate determi-
nation is outlined and the research gap is highlighted.
Based on this, our new method, which overcomes in-
tensity and motion artefacts, is presented in Sect. 3.
This is followed by the experimental results with a
Wiede, C., Sun, J., Richter, J. and Hirtz, G.
Robust Remote Heart Rate Determination for E-Rehabilitation - A Method that Overcomes Motion and Intensity Artefacts.
DOI: 10.5220/0006537504910500
In Proceedings of the 13th International Joint Conference on Computer Vision, Imaging and Computer Graphics Theory and Applications (VISIGRAPP 2018) - Volume 4: VISAPP, pages
491-500
ISBN: 978-989-758-290-5
Copyright © 2018 by SCITEPRESS – Science and Technology Publications, Lda. All rights reserved
491

variety of evaluated scenarios in Sect. 4, which is ac-
companied by a discussion. Finally, we summarise
our findings and outline future work.
2 RELATED WORK
The development of e-rehabilitation systems is conti-
nuously rising because of a higher demand and a lack
of personnel resources. With the release of the Mi-
crosoft Kinect, cost-effective depth sensors became
affordable and e-rehabilitation applications that em-
ploy the Kinect made its breakthrough. In the last
years, several Kinect-based e-rehabilitation systems
were developed, such as proposed by Su et al. (Su
et al., 2014) or Gal et al. (Gal et al., 2015). Howe-
ver, to date there is no study that evaluates a patient’s
performance during exercises based on remotely de-
termined vital parameters.
There are four main vital parameters, i. e. heart
rate, respiration rate, oxygen saturation and blood
pressure. In this study, we focus on remote heart
rate determination by means of optical sensors using
principles of photoplethysmography (PPG). In clini-
cal environments, the heart rate is normally obtai-
ned by electrocardiography (ECG) or pulse oxime-
ters. The basics of PPG were first described by Hertz-
man and Spealman (Hertzman and Spealman, 1937).
They measured the volumetric changes of the blood
flow with an optical sensor. The light that transmits
through thin body parts, such as fingers or earlobes, is
received by an optical sensor (Allen, 2007). This met-
hod is called transmissive PPG. Next to transmissive
PPG, there exists the reflective PPG as well, which
measures the light reflected from a tissue. Due to
the reflection, the signal-to-noise ratio (SNR) for this
method is decreased by a factor of ten compared to
the transmissive PPG. Still, for both of these met-
hods, sensors have to be attached to the body. In
order to overcome this issue, Humphreys et al. de-
veloped a first concept for remote photoplethysmo-
graphy (rPPG) (Humphreys et al., 2005). This was
followed by first experiments in the infrared spectrum
(Garbey et al., 2007) and the visible light spectrum
(Verkruysse et al., 2008).
In 2007, Verkruysse et al. recorded probands a
with small distance to an RGB camera. These pro-
bands were instructed not to move during the recor-
dings in order to avoid motion artefacts. They de-
tected a region of interest (ROI) within a face, per-
fomed a spatial averaging of the colour channels and
determined the heart rate with the Fast Fourier Trans-
form (FFT). This method was followed by the first au-
tomated approach by Poh et al. (Poh et al., 2010; Poh
et al., 2011). They used an automated face detection
and an independent component analysis (ICA). In or-
der to increase the speed, Lewandoska et al. (Lewan-
dowska et al., 2011) suggested to use a principal com-
ponent analysis (PCA) instead of an ICA. Further
works proposed to improve these methods by using
temporal filters (van Gastel et al., 2014), autoregres-
sive models (Tarassenko et al., 2014) or an adaptive
filtering (Wiede et al., 2016a). All these approaches
belong to the group of methods called intensity-based
methods.
A different group of approaches are the so-called
motion-based methods, which were first proposed by
Balakrishnan et al. (Balakrishnan et al., 2013). They
made use of small head motions caused by the he-
art bump triggered blood flow. By using several dis-
tinctive feature points in the person’s face, small head
motions can be tracked over time with a Kanade-
Lucas-Tomasi (KLT) point tracker. After that, a PCA
determined the principal components of the trajecto-
ries of the points. At last, the heart rate was obtained
by using a peak detection.
As outlined by Wiede et al. (Wiede et al., 2016b),
intensity- and motion-based methods have different
advantages and disadvantages. Intensity-based met-
hods are less sensitive to motion artefacts, whereas the
motion-based methods suffer from fast motions. This
is because the motion artefacts and the heart bump in-
duced motion signal share the same frequency bands.
In contrast to that, motion-based methods are less
prone to illumination artefacts, such as reflections and
shadows. The ratio-based method exploits these facts
by using an intensity-based method when less inten-
sity artefacts occur and a motion-based method when
less motion artefacts are present (Wiede et al., 2016b).
Consequently, the ratio-based method can not com-
pletely eliminate such artefacts, because it only choo-
ses the method with the smallest amount of artefacts.
Thus, the main problems originate from the under-
lying sources of artefacts. If these sources can be re-
duced or eliminated, the accuracy will increase signi-
ficantly. For that, we propose an intensity-based met-
hod, which can overcome the motion artefacts by an
accurate tracking and which significantly reduces in-
tensity artefacts with a skin colour model.
3 METHODS
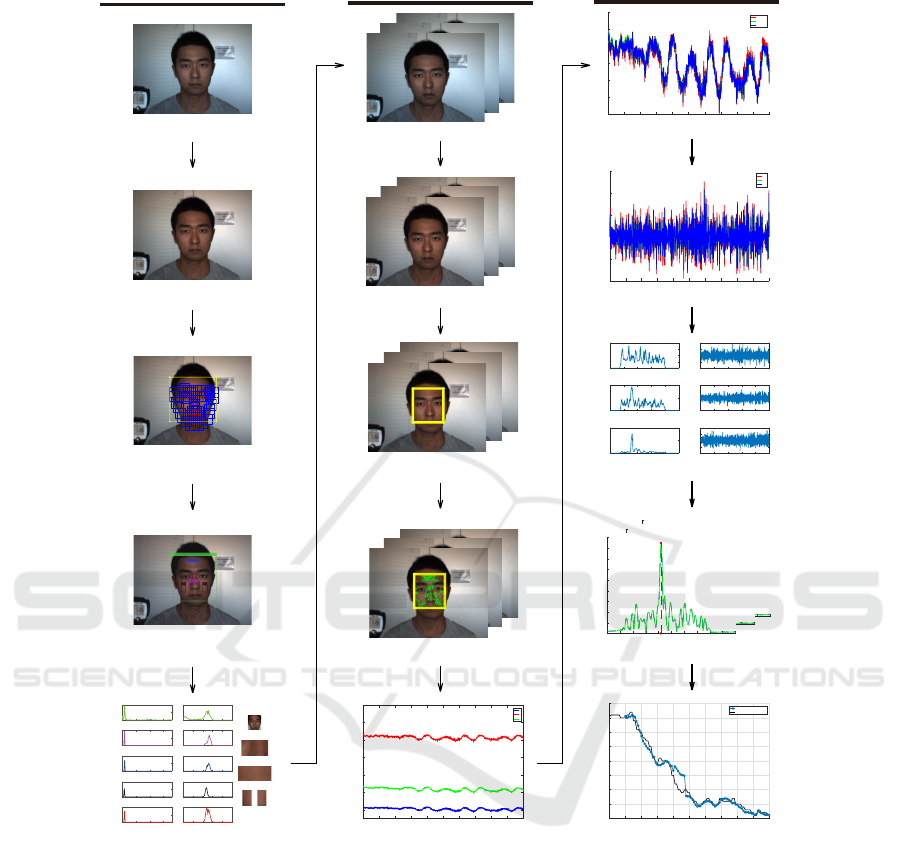
3.1 Overview
The major steps for the proposed robust remote he-
art rate determination are shown in Figure 1. After
acquiring an RGB image, white balancing was app-
VISAPP 2018 - International Conference on Computer Vision Theory and Applications
492
Skin Colour Determination
(1) Fetch first video frame
(2) White balance parameter estimation
(3) Face detection and alignment
(4) ROIs selection
0 100 200 300
0
5000
10000
(a) face Hue
020406080100
0
5000
10000
(b) face Saturation
face
0 100 200 300
0
200
400
(c) midface Hue
020406080100
0
200
400
(d) midface Saturation
midface
0 100 200 300
0
500
1000
(e) forehead Hue
020406080100
0
500
1000
(f) forehead Saturation
forehead
0 100 200 300
0
500
1000
(g) cheek Hue
020406080100
0
500
1000
(h) cheek Saturation
cheek left
0 100 200 300
0
1000
2000
(i) combined Hue
020406080100
0
500
1000
(j) combined Saturation
cheek right
(5) Skin colour estimation
Tracking and Skin Pixel Selection
(6) Input video frames
(7) Auto white balancing and smoothing
(8) Face tracking
(9) Skin pixels selection
(10) Signal extraction
0102030405060708090 100
time
50
60
70
80
90
100
110
magnitude
R
G
B
Time Signal Processing
(12) Coarse bandpass filtering
(13) Independent component analysis
(14) Signal separation & Adaptive heart rate extraction
(15) Output signal
0102030405060708090 100
time
-3
-2
-1
0
1
2
3
magnitude
nomarlized R
nomarlized G
nomarlized B
0102030405060708090 100
time
-1
-0.5
0
0.5
1
1.5
magnitude
BP R
BP G
BP B
012345
Frequency
0
0.2
0.4
0.6
PSD
PSD of ICA Component 1
020406080 100
Time
-4
-2
0
2
4
Magnitude
ICA Component 1
012345
Frequency
0
0.5
1
PSD
PSD of ICA Component 2
020406080 100
Time
-5
0
5
Magnitude
ICA Component 2
012345
Frequency
0
2
4
PSD
PSD of ICA Component 3
020406080 100
Time
-4
-2
0
2
4
Magnitude
ICA Component 3
0 0.5 1 1.5 2 2.5 3 3.5 4 4.5 5
Frequency
0
5
10
15
20
25
30
35
40
45
PSD
0 0.5 1 1.5 2 2.5 3 3.5 4 4.5 5
Frequency
0
5
10
15
20
25
30
35
40
45
PSD
0 0.5 1 1.5 2 2.5 3 3.5 4 4.5 5
Frequency
0
5
10
15
20
25
30
35
40
45
PSD
0 100 200 300 400 500 600 700 800 900 1000
Frame
90
95
100
105
110
115
120
125
130
HR in BPM
estimation,mean:102.5036, rmse:1.9489
reference,mean:104.87
(11) Signal normalization
Figure 1: Overview of the proposed remote heart rate determination algorithm.
lied to obtain real world colours. In the first frame of
the video, a face detection and alignment was carried
out. Based on this, different ROI within the face were
sampled and used to determine a proband’s individual
skin colour model. In the subsequent frames, we ap-
plied an auto white balancing, a face tracking, a skin
pixel selection and a time signal extraction. This time
signal was normalised and bandpass filtered. An ICA
determined its independent components and the heart
rate was obtained by means of a frequency analysis.
An adaptive filtering assured a stable heart rate over
time.
3.2 Skin Colour Determination
Due to the fact that different persons have different
skin colours and the lighting conditions depend on the
location, an individual skin colour model is necessary.
For that, the first frame in the video was analysed and
the parameters for the skin colour model were deter-
mined.
In a first step, a white balancing was applied to ad-
just the colours of the images by scaling and shifting
the intensities in such a way that real white surfaces
are finally represented by equally distributed RGB va-
lues. With that preprocessing, a bluish white or a yel-
lowish white, for example, can be corrected. We im-
Robust Remote Heart Rate Determination for E-Rehabilitation - A Method that Overcomes Motion and Intensity Artefacts
493

plemented a fast auto white balancing algorithm pro-
posed by Garud et al. (Garud et al., 2014), which is
based on the source illuminant values [ι
r
,ι
g
,ι
b
]. The
correlated colour temperature (CCT) is given and the
gain factors κ and the offset values τ can be determi-
ned. The gain factors are defined as follows:
κ
r
=
ι
g
ι
r
, (1a)
κ
g
= 1 , (1b)
κ
b
=
ι
g
ι
b
, (1c)
where κ
r
, κ
g
and κ
b
are the gain factors for the red,
the green and the blue colour channel respectively.
The offset values are calculated as:
τ
r
= max(1,
CCT − CCT
ref
100
) · (κ
r
− 1) , (2a)
τ
g
= 0 , (2b)
τ
b
= max(1,
CCT
ref
− CCT
100
) · (κ
b
− 1) , (2c)
where CCT
ref
denotes the CCT of the canonical illu-
minant.
With these factors, the white balanced colour
channels R
wb
, G
wb
and B
wb
can be determined by the
following equation:
R
wb
G
wb
B
wb
=
κ
r
0 0
0 κ
g
0
0 0 κ
b
·
R
G
B
+
τ
r
τ
g
τ
b
(3)
R, G and B are the original intensity values.
In the next step, the person’s face was detected in
the image. A common approach for this is the Viola
and Jones face detector (Viola and Jones, 2004). Ho-
wever, this approach is not accurate enough for this
application so that the face detector by Zhu and Ra-
manan (Zhu and Ramanan, 2012) was used instead.
This detector provides 68 facial landmarks in real-
world cluttered images. The provided bounding box
is very robustly located around the face. However, we
had to adjust the bounding box for our requirements
to include the forehead region and to exclude the neck
region. For that purpose, the bounding box was en-
larged at the left and the right boundary by 10 %, at
the upper boundary by 30 % and reduced at the lower
boundary by 10 %.
For the skin colour model, there are regions in the
face that are certainly skin pixels and not covered by
hair or other interfering objects. Under the condition
that the face was frontally captured, the regions of the
forehead, the two cheeks and the nose were selected
by their relative positions with regard to the total face
bounding box. One selection of these ROIs is shown
in Figure 2. These four ROIs were taken for the fol-
lowing skin colour estimation.
Figure 2: ROIs of the face regions selected for the skin co-
lour model, i. e. forehead, nose and the two cheeks.
The RGB colour space is not suited for determi-
ning a skin colour model, because the distribution of
the skin pixels does not follow any linear or concen-
trated coherency. Therefore, a conversion to a diffe-
rent colour space that separates brightness and chro-
minance is necessary. The HSV colour space contai-
ning the hue H, the saturation S and the value V is
convenient for this task. In accordance with the con-
version rules from Smith (Smith, 1978), the bright-
ness value V can be calculated by:
V = max(R, G, B) . (4)
The auxiliary variable C, which stands for the chroma
value, can be determined as follows:
C = V − min(R, G, B) . (5)
With these values the saturation S can be calculated
by:
S =
0, if V = 0 ,
C
V
, otherwise .
(6)
The hue H is given by:
H =
undefined, if C = 0 ,
60
◦
· (
G−B
C
), if V = R ,
60
◦
· (
B−R
C
+ 2), if V = G ,
60
◦
· (
R−G
C
+ 4), if V = B .
(7)
The HSV colour space represents a cylindrical co-
lour space. For the further consideration of the skin
pixels, the hue-saturation-plane is relevant. In order to
define a region in this plane, which represents the skin
colour of a certain person, thresholds for the hue and
the saturation have to be determined. At this point,
an adaption has to be made for the hue: Red is the
dominant colour of the face. Since the hue values for
the red pixels are in a range around zero, the hue H
was shifted by 120 degrees, as shown in the following
equation:
H
∗
=
H + 240
◦
, if H ≤ 120
◦
H − 120
◦
, otherwise.
(8)
VISAPP 2018 - International Conference on Computer Vision Theory and Applications
494
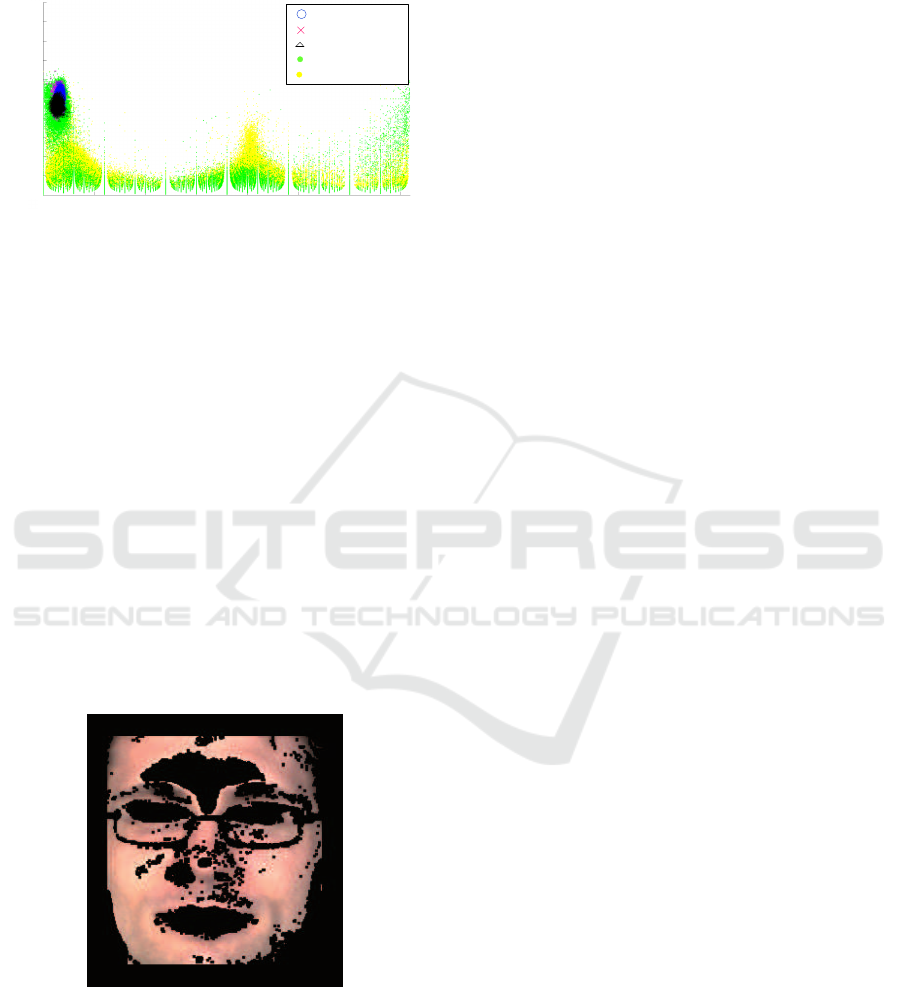
As shown in Figure 3, the values for hue and sa-
turation of the previously defined ROIs are located in
the same area.
Hue in °
50 100 150 200
250
300
350
Saturation in
%
0
10
20
30
40
50
60
70
80
90
100
Forehead
Nose region
Cheeks
Face rest
Image rest
Figure 3: Illustration of the ROI pixels in the shifted hue-
saturation-plane in comparison to other pixels in the image
and the face.
According to the overall human skin model, with red
as the dominant color, the threshold values for the
shifted hue H
∗
and the saturation S are as follows:
H
∗
∈ [186
◦
, 294
◦
]
S ∈ [20 %, 100 %]
(9)
In our work, however, we applied different thres-
holds depending on the person’s specific skin colour
and the lighting conditions. In Figure 4, the selected
skin pixels that were chosen according to the adapted
thresholds defined in Equation 10 are shown.
H
∗
∈ [252
◦
, 259
◦
]
S ∈ [45 %, 56 %]
(10)
It can be seen that regions of the eyes, hairs, lips,
glasses, nostrils, shadows and reflections do not be-
long the skin colour model.
Figure 4: Skin pixels that were selected with specific hue
and saturation thresholds within the face bounding box. Un-
selected pixels are masked with black.
3.3 Tracking and Skin Pixel Selection
Once the skin colour model was determined based on
the first frame, a continuous tracking of the face boun-
ding box and a skin pixel selection were conducted
during the following frame sequence. The tracking is
necessary to be invariant against different motion ar-
tefacts. Our tracking method is based on the optical
flow principle. The optical flow method estimates the
motion between two consecutive frames at the time
t and t + ∆t. This results in the general optical flow
equation:
I
x
V
x
+ I
y
V
y
= −I
t
, (11)
where I
x
, I
y
and I
t
are the partial derivatives of the
image at the position (x, y) on time t, V
x
,V
y
are the x
and y components of the velocity or the optical flow
of I(x, y, t). This equation contains two unknowns and
cannot be solved directly. A solution for this is the
KLT tracking algorithm (Tomasi and Kanade, 1991).
It followed the assumption that the motion is constant
in a local neighbourhood of an image patch. For n
different patterns in the image, we obtain n equations:
I
x
(p
1
)V
x
+ I
y
(p
1
)V
y
= −I
t
(p
1
) ,
I
x
(p
2
)V
x
+ I
y
(p
2
)V
y
= −I
t
(p
2
) ,
.
.
.
I
x
(p
n
)V
x
+ I
y
(p
n
)V
y
= −I
t
(p
n
) ,
(12)
where p
1
, p
2
, . . . , p
n
are the pixels inside the image
patch. These equations can be written in matrix form
Av = b, where:
A =
I
x
(p
1
) I
y
(p
1
)
I
x
(p
2
) I
y
(p
2
)
.
.
.
.
.
.
I
x
(p
n
) I
y
(p
n
)
, (13a)
v =
V
x
V
y
, (13b)
b =
−I
t
(p
1
)
−I
t
(p
2
)
.
.
.
−I
t
(p
n
)
. (13c)
That equation system can be solved by the least squa-
res principle:
A
T
Av = A
T
b. (14)
As a feature, the minimum Eigenvalue features
proposed by Shi and Tomasi (Shi and Tomasi, 1993)
were selected, because they came up with a large ro-
bustness. However, because of projective distortions
in the image region of the face, feature points can
vanish over time. A solution is to re-detect a sub-
ject’s face. For that, we used the normalised pixel
difference (NPD) face detector proposed by Liao et
al. (Liao et al., 2016). The face detector learns NPD
features by a classifier with a quadratic tree structure
Robust Remote Heart Rate Determination for E-Rehabilitation - A Method that Overcomes Motion and Intensity Artefacts
495

with a depth of eight. Should the NPD detector fail to
detect a subject’s face, the KLT tracker is able to track
the pixel for a while.
The 2-D geometric transform from one frame to
the next frame can be estimated by using the trac-
ked pixels and can be applied in the same manner to
the face bounding box to follow the head motion. By
combining the NPD face detector and 2-D geometric
transform estimation, the subject’s face region can be
accurately tracked even in case of complex head mo-
tions.
Assuming that the lighting conditions do not
change completely from the first frame on, the skin
colour model can be applied for the total frame se-
quence. In the tracked face bounding box, all pixels
that match the thresholds of the skin colour model
were selected. In order to improve the reliability of
the skin pixel selection, a distance threshold D was
defined. For every skin pixel, the distance to the clo-
sest non-skin pixel was calculated. If this distance
was smaller than D, this skin pixel was rejected. This
procedure is equivalent to an erosion.
For the time signal extraction, all remaining skin
pixels were taken into consideration. They were
averaged for each frame for all three colour channels
R, G and B. Please note that we operate in the dis-
crete time domain and use n instead of the continuous
variable t.
¯
R(n) =
1
L
L
∑
l=1
R
l
(n) (15a)
¯
G(n) =
1
L
L
∑
l=1
G
l
(n) (15b)
¯
B(n) =
1
L
L
∑
l=1
B
l
(n) (15c)
R
l
, G
l
and B
l
denote the l
th
selected skin pixel in
the frame and L is the number of all selected skin
pixels in this frame.
¯
R(n),
¯
G(n) and
¯
B(n) represent
the mean value of the facial skin colour for a certain
frame n. As a result, we obtained a time varying sig-
nal for the skin colour.
3.4 Time Signal Processing
In order to remove remaining noise sources, the co-
lour time varying signal has to be further processed
to increase the SNR and to obtain a robust heart rate
signal.
The first step of the time signal processing was
to normalise the signal to attain a zero mean and a
standard deviation of one:
ˆ
R(n) =
1
σ
R
(
¯
R(n) − µ
R
) , (16a)
ˆ
G(n) =
1
σ
G
(
¯
G(n) − µ
G
) , (16b)
ˆ
B(n) =
1
σ
B
(
¯
B(n) − µ
B
) , (16c)
where
ˆ
R,
ˆ
G and
ˆ
B refer to the normalised colour
channels. µ
C
is the mean value and σ
C
is the stan-
dard deviation of the corresponding colour channel
C ∈ {R, G, B}:
µ
C
=
1
N
N
∑
n=1
¯
C(n) , (17)
σ
C
=
s
1
N
N
∑
n=1
(
¯
C(n) − µ
C
)
2
, (18)
where
¯
C(n) represents the original colour channels
and N is the sequence length of the colour signal for
a single channel.
This was followed by a bandpass filter BP, which
excludes implausible frequencies, see Equation 19.
The frequencies lower than 0.7 Hz and higher than
4 Hz were cut off. For this implementation, an FIR
filter with an order of 128 was chosen to ensure a con-
stant group delay. The filtered colur channels are then
denoted as R
BP
, G
BP
and B
BP
.
R
BP
(n) = BP(n) ∗
ˆ
R(n) (19a)
G
BP
(n) = BP(n) ∗
ˆ
G(n) (19b)
B
BP
(n) = BP(n) ∗
ˆ
B(n) (19c)
Even now, the three filtered colour channels can
still contain noise sources. In order to separate the
wanted pulse signal from the noise sources, a decom-
position of the colour channels by an ICA was app-
lied. The goal is to determine three new independent
components IC
1
, IC
2
and IC
3
:
R
BP
(n)
G
BP
(n)
B
BP
(n)
=
a
1,1
a
1,2
a
1,3
a
2,1
a
2,2
a
2,3
a
3,1
a
3,2
a
3,3
·
IC
1
(n)
IC
2
(n)
IC
3
(n)
. (20)
In our implementation, we used the FastICA approach
of Hyvrinen (Hyv
¨
arinen, 1999).
In the next step, the independent component that
contains the wanted signal should be selected for the
further processing. We assume that the independent
component with the highest periodicity p is most li-
kely the one that contains the pulse signal. The peri-
odicity p of a signal is defined as as the ratio between
VISAPP 2018 - International Conference on Computer Vision Theory and Applications
496

the accumulated coefficients in a range of 0.05 Hz
around the dominant frequency f
d
and the accumula-
ted coefficients of the total power spectrum, see Equa-
tion 21. f
s
is the sampling frequency.
p =
∑
f
d
+0.025
f
d
−0.025
ˆ
S
av
xx
(k)
∑
f
s
0
ˆ
S
av
xx
(k)
(21)
In order to calculate p, the spectrum of each inde-
pendent component has to be obtained. One possibi-
lity to do this is by the Welch’s estimate of the power
spectrum density (PSD)
ˆ
S
av
xx
(k):
ˆ
S
av
xx
(k) =
1
N
N
∑
n=1
ˆ
P
n
(k). (22)
Thereby,
ˆ
P
n
(k) denotes the periodogram and k is
the discrete iterator in the frequency domain instead
of the continuous variable f . The periodogram uses a
hamming window for each segment.
After having selecting the best independent com-
ponent IC
i
, this component was split into segments of
10 s with an overlap of 90 % of the segments. This
small segment size guarantees a flexibility when the
heart rate changes rapidly, for example during a trai-
ning exercise. The dominant frequency f
FFT
for each
segment k was determined by calculating the FFT for
this segment and by determining the maximum in the
spectrum:
f
FFT
(k) = max(
|
FFT(IC
i
)
|
). (23)
In presence of strong motion artefacts, other high
peaks can appear in the spectrum. They can be mis-
interpreted as the real heart rate signal. In order to
avoid this, an adaptive filtering is introduced. We
assume that the heart rate does not change by more
than 15 BPM (0.25 Hz) between two adjacent fra-
mes. The mean value of the estimated heart rates in
the two previous segments was defined as the guide
frequency f
gui
. As shown in Figure 5, only the part
of the spectrum for which applies f
gui
± 0.25 Hz was
taken into consideration for the final heart rate HR. To
obtain the final heart rate in beats per minute (BPM),
the frequency f
FFT
has to be multiplied by 60:
HR(k) = f
FFT
(k) · 60 [BPM]. (24)
4 RESULTS AND DISCUSSION
4.1 Setting
As a basis for our evaluation, we created a database
of eleven probands with 117 different videos in to-
tal. The probands are of different gender, age and
0 1 2 3 4
5
0
20
40
60
Frequency in Hz
Spectrum of IC
i
f
gui
± 0.25 Hz
HR
HR
ref
f
gui
Figure 5: For the adaptive filtering, only frequency peaks
that are in the range of f
gui
± 0.25 Hz were considered. f
gui
represents the guide frequency, HR the selected heart rate
and HR
ref
the corresponding reference heart rate.
skin colour to guarantee a high variability. In total,
twelve different scenarios were considered: Starting
from a control scenario without any noise sources, we
recorded scenarios with illumination artefacts caused
by a lighting source placed above the face or placed
at one side of the face, which results in different kinds
of shadows. Moreover, the probands had to perform
different motions to obtain scenarios with translations
and rotations of the head (pitch, yaw and roll), scaling
as well as non-rigid movements to represent motion
artefacts. Furthermore, we combined motion artefacts
and intensity artefacts in one scenario. In order to ge-
nerate videos with a varying heart rate, which is na-
tural in the context of rehabilitation exercises, videos
after sport and during cycling exercises were made.
For all recordings, an industrial camera, i. e. an Al-
lied Manta G201c, was chosen. The automatic expo-
sure time control and the automatic white balancing
were disabled in order not to influence the measure-
ments. The video sequences had a length of 1,000 fra-
mes and were recorded with a fixed frame rate of
10 FPS.
A Polar FT1 heart rate monitor was used as a re-
ference system. This system measures the heart rate
by means of a chest strap and displays it. This display
was visible in all recorded videos, so that a reference
value for the heart rate could be obtained for every
frame.
4.2 Accuracy
The evaluation criterion that we have chosen for
the accuracy analysis is the root-mean-square error
(RMSE) for a sequence m, see Equation 25.
RMSE
m
=
s
1
N
N
∑
n=1
|
HR(n) − HR
ref
(n)
|
2
(25)
Robust Remote Heart Rate Determination for E-Rehabilitation - A Method that Overcomes Motion and Intensity Artefacts
497

In this equation, HR is the estimated heart rate and
HR
ref
the reference heart rate. For the single scena-
rios, we calculated the mean value RMSE of all se-
quences M.
RMSE =
1
M
M
∑
m=1
RMSE
m
(26)
Every video consist of 91 segments, which results in
10,647 evaluated segments in total for 117 videos.
This outlines the extent of the data base and its sta-
tistical relevance.
In Table 1, the results for the single scenarios are
presented. As expected, the control scenario without
any challenges shows the best RMSE with 1.19 BPM.
Since the error of the reference system can be quan-
tified with ±1 BPM, this result proves to be of high
quality.
The scenarios with illumination artefacts show
shadows and reflection. This causes the RMSE to in-
crease up to 1.38 BPM for the side illumination and
1.48 BPM for the upper illumination, which is still
accurate. Solely occuring illumination artefacts do
not show a large impact on the proposed algorithm.
While the determined heart rate for translation can
be rated as accurate as well, the error is increasing for
the scaling and rotation scenarios. This can be ex-
plained by a more challenging tracking and therefore
larger changes in the size of the bounding box. The
non-rigid movements show the largest RMSE for the
motion scenarios with 2.46 BPM. This is logical: due
to the change of the shape of the face, which is a re-
sult of speaking and facial expressions, the size and
the location of the bounding box is influenced.
When motion and illumination artefacts are com-
bined in one scenario, the RMSE increases up to
2.92 BPM. The scenarios after the sport and during
the cycling showed an increased RMSE of 1.53 BPM
and 2.11 BPM. Especially the heart rate determination
during the cycling is very challenging because of its
periodically motions. However, all scenarios showed
an RMSE below 3 BPM, which seems to be accurate
for the use case e-rehabilitation.
4.3 Robustness
For the evaluation, not only mean values of a com-
plete sequence, such as the RMSE, are relevant. It is
also of high importance that the differences between
the estimated heart rate and the reference heart rate
are not too high for single segments. This criterion
is referred to as robustness. In Figure 6, for example,
the reference heart rate and the estimated heart rate
are shown in one plot for a video after the sport. It
can be seen that the estimated heart rate is very close
Table 1: RMSE for all scenarios in BPM.
Evaluated Scenario RMSE
Control 1.19
Upper illumination 1.49
Side illumination 1.38
Translation 1.36
Yaw 1.70
Pitch 1.93
Roll 1.86
Scaling 1.81
Non-rigid motion 2.46
Motion and illumination 2.93
After sport 1.53
During cycling 2.11
to the reference heart rate for the majority of the seg-
ments. For some segments, however, this difference
is slightly higher.
0 200 400
600
800 1,000
90
100
110
120
130
Frame number n
HR in BPM
HR
HR
ref
Figure 6: Comparison of the computed heart rate (blue dots)
and the reference heart rate (black curve) after a sport exer-
cise.
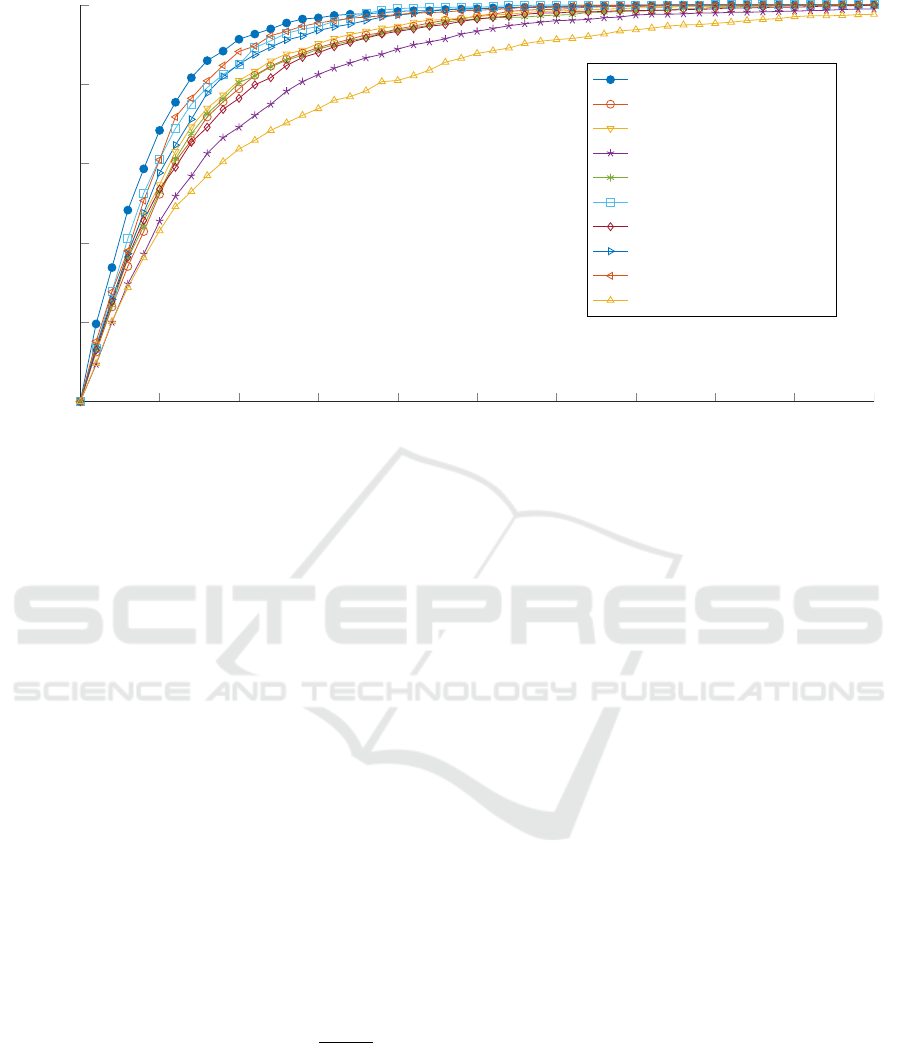
In order to perform a more detailed analysis of
the single differences, the amount of segments Φ that
have a difference d below a certain value is plotted
over the difference using all scenarios, as shown in
Figure 7. The difference d is calculated as follows:
d(φ) = HR(φ) − HR
ref
(φ). (27)
phi denotes the segment number.
In Figure 7, it can be seen that 98.3 % of the seg-
ments in the control sequences have a difference be-
low 4 BPM, for example. For the upper illumina-
tion 97 % and the side illumination 97.5 % of the
segments have a difference smaller than 4 BPM. For
the rigid motion 93.3 % and for the non-rigid moti-
ons 88.8 % of the segments show a maximum diffe-
rence of 4 BPM. In the case where strong motions
and intensity artefacts occur together, this rate drops
VISAPP 2018 - International Conference on Computer Vision Theory and Applications
498
0 1 2 3 4
5 6
7 8 9 10
0
20
40
60
80
100
Difference d between estimated HR and reference HR in BMP
Amount of segments Φ in %
Control
Scaling
Yaw
Non-rigid motion
Roll
Translation
Pitch
Upper illumination
Side illumination
Motion and illumination
Figure 7: The overall results are visualised. The y-axis indicates how many percent of the measured data points show a better
performance than certain difference in BPM.
to 80.9 %. If all scenarios are considered, we determi-
ned that 90 % of the segments have a difference that
is smaller than 4 BPM. This robustness is regarded
as sufficient for the field of e-rehabilitation. In this
application, it is not of high importance whether the
heart rate at a certain time is exactly 120 BPM or 122
BPM, for example. The detection of relative changes
or the velocity of heart rate changes within or after an
exercise is more important.
5 CONCLUSIONS
In this study, we presented a new method for remote
heart rate determination, which is robust against in-
tensity and motion artefacts. This method consist of
an accurate tracking and an individual, situation de-
pending skin colour determination. That is accompa-
nied by a bandpass filtering, an ICA and a frequency
determination.
For the evaluation, the accuracy was calculated by
means of a reference system. With an RMSE below
3 BPM, this method provides a good basis for an ap-
plication in e-rehabilitation. Even in the scenarios du-
ring sport activities, this method demonstrated robus-
tness.
In future, we plan to evaluate this method in a field
study in rehabilitation facilities. Furthermore, we in-
tend to extent the algorithms for the use of thermal
cameras. Finally, it is planned to evaluate this method
in other application fields, such as AAL or driver’s
monitoring.
ACKNOWLEDGEMENTS
This project is funded by the European Social Fund
(ESF). We thank all volunteers who took part in the
recordings.
REFERENCES
Allen, J. (2007). Photoplethysmography and its application
in clinical physiological measurement. Physiological
Measurement, 28(3):R1–R39.
Balakrishnan, G., Durand, F., and Guttag, J. (2013). De-
tecting Pulse from Head Motions in Video. In Com-
puter Vision and Pattern Recognition (CVPR), 2013
IEEE Conference on, pages 3430–3437.
Gal, N., Andrei, D., Neme, D. I., Ndan, E., and Stoicu-
Tivadar, V. (2015). A Kinect based intelligent e-
rehabilitation system in physical therapy. Digital He-
althcare Empowering Europeans, pages 489–493.
Garbey, M., Sun, N., Merla, A., and Pavlidis, I. (2007).
Contact-Free Measurement of Cardiac Pulse Based on
the Analysis of Thermal Imagery. Biomedical Engi-
neering, IEEE Transactions on, 54(8):1418–1426.
Garud, H., Ray, A. K., Mahadevappa, M., Chatterjee, J., and
Mandal, S. (2014). A fast auto white balance scheme
for digital pathology. In 2014 IEEE-EMBS Internati-
Robust Remote Heart Rate Determination for E-Rehabilitation - A Method that Overcomes Motion and Intensity Artefacts
499

onal Conference on Biomedical and Health Informa-
tics, BHI 2014, pages 153–156.
Hertzman, A. B. and Spealman, C. R. (1937). Observations
on the finger volume pulse recorded photoelectrically.
American Journal of Physiology, 119:334–335.
Humphreys, K., Markham, C., and Ward, T. (2005). A
CMOS camera-based system for clinical photoplet-
hysmographic applications. In Proceedings of SPIE,
volume 5823, pages 88–95.
Hyv
¨
arinen, A. (1999). Fast and robust fixed-point algo-
rithms for independent component analysis. Neural
Networks, IEEE Transactions on, 10(3):626–634.
Lewandowska, M., Ruminski, J., Kocejko, T., and Nowak,
J. (2011). Measuring pulse rate with a webcam -
a non-contact method for evaluating cardiac activity.
In Computer Science and Information Systems (Fe-
dCSIS), 2011 Federated Conference on, pages 405–
410.
Liao, S., Jain, A. K., and Li, S. Z. (2016). A Fast and Accu-
rate Unconstrained Face Detector. IEEE Transacti-
ons on Pattern Analysis and Machine Intelligence,
38(2):211–223.
Poh, M.-Z., McDuff, D., and Picard, R. (2010). Non-
contact, automated cardiac pulse measurements using
video imaging and blind source separation. Optics Ex-
press, 18(10):10762–10774.
Poh, M.-Z., McDuff, D., and Picard, R. (2011). Advan-
cements in Noncontact, Multiparameter Physiological
Measurements Using a Webcam. Biomedical Engi-
neering, IEEE Transactions on, 58(1):7–11.
Shi, J. and Tomasi, C. (1993). Good Features to Track.
Technical report, Cornell University, Ithaca, NY,
USA.
Smith, A. R. (1978). Color gamut transform pairs. ACM
SIGGRAPH Computer Graphics, 12(3):12–19.
Su, C.-J., Chiang, C.-Y., and Huang, J.-Y. (2014). Kinect-
enabled home-based rehabilitation system using Dy-
namic Time Warping and fuzzy logic. Applied Soft
Computing, 22:652–666.
Tarassenko, L., Villarroel, M., Guazzi, A., Jorge, J., Clif-
ton, D. A., and Pugh, C. (2014). Non-contact video-
based vital sign monitoring using ambient light and
auto-regressive models. Physiological Measurement,
35(5):807–831.
Tomasi, C. and Kanade, T. (1991). Detection and Tracking
of Point Features. Technical report, Carnegie Mellon
University.
van Gastel, M., Zinger, S., Kemps, H., and de With, P.
(2014). e-health video system for performance ana-
lysis in heart revalidation cycling. In Consumer Elec-
tronics Berlin (ICCE-Berlin), 2014 IEEE Fourth In-
ternational Conference on, pages 31–35.
Verkruysse, W., Svaasand, L. O., and Nelson, J. S. (2008).
Remote plethysmographic imaging using ambient
light. Optics Express, 16(26):21434–21445.
Viola, P. and Jones, M. J. (2004). Robust real-time face
detection. International Journal of Computer Vision,
57(2):137–154.
Wiede, C., Richter, J., Apitzsch, A., KhairAldin, F., and
Hirtz, G. (2016a). Remote Heart Rate Determination
in RGB Data. In Proceedings of the 5th International
Conference on Pattern Recognition Applications and
Methods, pages 240–246, Rome.
Wiede, C., Richter, J., and Hirtz, G. (2016b). Signal fusion
based on intensity and motion variations for remote
heart rate determination. In 2016 IEEE International
Conference on Imaging Systems and Techniques (IST),
pages 526–531.
Zhu, X. and Ramanan, D. (2012). Face detection, pose esti-
mation, and landmark localization in the wild. In Pro-
ceedings of the IEEE Computer Society Conference
on Computer Vision and Pattern Recognition, pages
2879–2886.
VISAPP 2018 - International Conference on Computer Vision Theory and Applications
500
