
Relations of Morbidity Related Groups (MRG), ICD-10 Codes and Age
and Gender Structure in Outpatient Treatment
Reinhard Schuster
1
, Thomas Ostermann
2
, Marc Heidbreder
3
and Timo Emcke
4
1
Chair of Department of Health Economics, Epidemiology and Medical Informatics,
Medical Advisory Board of Statutory Health Insurance in Northern Germany, Katharinenstraße 11, 23554 L
¨
ubeck, Germany
2
Chair of Research Methodology and Statistics in Psychology, Witten/Herdecke University,
Alfred-Herrhausen-Straße 50, 58448 Witten, Germany
3
Medical Advisory Board of Statutory Health Insurance in Northern Germany,
Katharinenstraße 11, 23554 L
¨
ubeck, Germany
4
Chair of Department of Prescription Analysis, Association of Statutory Health Insurance Physicians,
Bismarckallee 1-6, 23812 Bad Segeberg, Germany
Keywords:
Morbidity Related Groups (MRG), Outpatient Treatment, ATC Classification System, International Classifi-
cation of Diseases (ICD-10), Determination of Main Diagnoses, Distance Structure.
Abstract:
A patient’s (basic) Morbidity Related Group (MRG) is defined by the drug class (first four characters of the
international Anatomic Therapeutic Chemical [ATC] Classification System) with the highest costs per quarter
with respect to a physician. The morbidity of a patient is thereby represented by the drug most important
economically. We consider the relation of those case groups with diagnoses (ICD-10-GM) on the individual
and group level. In analogy to the DRG Systems (Diagnosis-related group) a degree of severity with respect
to age, multimorbidity and treatment intensity is defined. We compare multimorbidity and age structures of
MRGs and ICD-10 using a distance measure given by the fraction of patients with respect to their MRG and
ICD-10. Main diagnoses like in hospital treatment are not given in outpatient care. MRG classification data
can be used in order to algorithmically construct an outpatient care equivalent. Individual MRG components
as points in a vector space can be used to determine the
”
biological age“ of groups of individuals with respect
to in- or decreased morbidity.
1 INTRODUCTION
In the field of outpatient health services research the-
re is an increasing demand of health policy makers
for new tools optimizing patient centered care and for
perspective changing information. Such tools enable
both health care providers and statutory health ins-
urances to further improve health care services lea-
ding to increased benefits for individual patients.
In the past the analysis of prescribing patterns was
either done by simply counting for the prescribed re-
medies (i.e. by means of connecting to practice sy-
stems of the physicians cf. (Jeschke, E., Ostermann,
T., Vollmar, HC, Tabali, M., Matthes, H., 2012)) or
by making use of samples of secondary data. Howe-
ver, both approaches lack of a sustainable modeling
approach. because of limitations in the underlying da-
ta.
Recently, we described the concept of Morbidity
Related Groups (MRG) in order to determine a main
drug prescription class for patients with respect to a
physician on a quarterly basis cf. (Schuster, R., 2015;
Schuster, R., Emcke, T., v. Arnstedt, E., Heidbreder,
M., 2016). This concept was constructed in analogy
to the Diagnosis Related Groups (DRG) in the hospi-
tal setting which are primarily based on diagnoses cf.
(InEK, 2016). Prescription analysis therefore utilizes
all five resolution levels of the International Anatomic
Therapeutic Chemical (ATC) Classification System.
Interaction effects, treatment intensities and changes
in treatment modalities can be chronologically inter-
connected by using prescription dates.
While within that mere ATC framework the pa-
tient level is of minor importance, the MRG setting
takes into account the individual level by looking for
the group with the highest drug costs on the third le-
vel ATC (four characters) within a quarter for each
consulted physician by a certain patient. Therefore,
322
Schuster, R., Ostermann, T., Heidbreder, M. and Emcke, T.
Relations of Morbidity Related Groups (MRG), ICD-10 Codes and Age and Gender Structure in Outpatient Treatment.
DOI: 10.5220/0006544303220328
In Proceedings of the 11th International Joint Conference on Biomedical Engineering Systems and Technologies (BIOSTEC 2018) - Volume 5: HEALTHINF, pages 322-328
ISBN: 978-989-758-281-3
Copyright © 2018 by SCITEPRESS – Science and Technology Publications, Lda. All rights reserved
this group is strongly related to the morbidity of the
patient hence leading to the term
”
Morbidity Rela-
ted Group“. Thereby the costs serve as a proxy for
the relative importance of applied drugs. The exam-
ple given by the Tables 1 and 2 list prescription da-
ta of a diabetes patient belonging to the basic group
A10A (Insulins and analogues) with total patient cost
of 1,154.16 e.
Table 1: Example of the (basic) MRG determination with
drug details.
cost nr ATC substance drug amount
320.74 1 B01AF01 Rivaroxaban XARELTO 15 mg 98
272.61 1 N06AX21 Duloxetine CYMBALTA 60 mg 98
248.02 1 A10AD04 Insulin Lispro LIPROLOG Mix 25 10X3
159.39 1 N02AA55 Oxycodone TARGIN 5mg 100
124.01 1 A10AD04 Insulin Lispro LIPROLOG Mix 50 10X3
15.41 1 H03AA01 Levothyroxine
Sodium
L-THYROX HE-
XAL 125
100
13.98 1 C07AB12 Nebivolol NEBIVOLOL
Glenmark 5 mg
100
The drugs falling in the third level ATC A10A are
the most expensive.
Table 2: Example of (basic) MRG determination with ATC4
substance groups.
cost ATC4 substance group
372,03 A10A insulins and analogues
320.74 B01A antitrombotic agents
272.61 N06A antidepressants
159.39 N02A analgesics
15.41 H03A thyroid preparations
13.98 C07A beta blocking agents
In the quarter considered the patient is assigned to
the MRG A10A.
Out of the various diagnoses in hospital treatment
a patient specific main diagnosis is determined by the
admitting physician. Today, main diagnoses are un-
known in outpatient treatment. Only a rough differen-
tiation between long term and acute diagnoses is do-
cumented with respect to quarter and physician. For
example patients of above 80 years have on average
more than ten diagnoses (three-character level of In-
ternational Statistical Classification of Diseases and
Related Health Problems[ICD], current version: ICD-
10-GM 2017).
0
2
4
6
8
10
12
14
0 5 10 15 20 25 30 35 40 45 50 55 60 65 70 75 80 85 90 95 100
number of diagnoses
age
Mean number of diagnoses (ICD-10 three-character level)
male
female
Figure 1: Mean number of diagnoses with respect to age and
gender.
Interestingly, the gender difference become much
more important, if we consider the mean number of
physicians per patient and quarter.
1.0
1.2
1.4
1.6
1.8
2.0
2.2
2.4
0 5 10 15 20 25 30 35 40 45 50 55 60 65 70 75 80 85 90 95 100
mean number of physiciansl
age
Mean number of physicians per patient and quarter with
respect to age and gender
male
female
Figure 2: Mean number of physicians per patient and quar-
ter with respect to age and gender.
In this paper we algorithmically construct a main
diagnosis using the MRG. The main diagnosis shall
describe the central focus of the treatment for statisti-
cal purposes and not as a basis for individual thera-
peutical decisions. The diagnoses according to ICD-
10-GM have only a quarterly resolution differentia-
ting between actual and longterm diagnoses as well
as levels of confidence. In the dataset there are no di-
rect links between drug prescriptions and related dia-
gnoses. Nevertheless in some cases there is a strong
connection of drug prescriptions and diagnoses, i.e.
an prescription of insulin implies a diagnosis of dia-
betes. If a necessary diagnosis is missing, the quality
of documentation has to be improved. In other cases
different diagnoses may cause the same prescription
behavior. In addition, getting a diagnosis may not al-
ways lead to drug prescriptions. Figure 1 illustrates
how multimorbidity varies with age and gender con-
Relations of Morbidity Related Groups (MRG), ICD-10 Codes and Age and Gender Structure in Outpatient Treatment
323

sidering the mean number of diseases on the level of
the three-digit ICD-10. Additionally, Figure 2 repres-
ents the mean number of physicians per patient and
quarter. It has to be noted that out of ICD-10 Chapter
XIV (Diseases of the genitourinary system), Chap-
ter XV (Pregnancy, childbirth and the puerperium),
Chapter XXI (Factors influencing health status and
contact with health services) and Chapter XXII (Co-
des for special purposes) were excluded in the analy-
sis to avoid gender asymmetry and bias caused by ad-
ministration. Age and gender dependent differences
in drug descriptions are considered while matching
MRG and ICD-10 (standardization). After determina-
tion of a main MRG and ICD group for each patient,
we get a n-dimensional vector of age dependent frac-
tions of diseases (n as the number of MRG or ICD
groups). The relationship messured by Manhattan di-
stances of such vectors and the age is of interest. The
Manhattan distances monotonically increase up to a
certain also age dependent distance. The reason is that
there are characteristic disease profiles for each age.
Differences increase if gender is included. If it would
be possible to get age information from ICD or MRG
vectors, we can determine the
”
biological age“ of po-
pulation subgroups. One can apply this to existing ins-
urance or social groups.
2 MATERIAL AND METHOD
We utilized prescription and diagnosis data of the
most northern federal state of Germany (Schleswig-
Holstein) from quarters 3/2015 till 2/2016. The analy-
sis is related to patients, quarters and physicians. That
means, that a patient is counted as much as pairs of
quarters and physicians appear. With this background
there are 8.645 Million patients in the drug prescrip-
tion data and 11.117 Million patients in the ICD-10
data.
The C-related programming language awk is used
for the computations. The visualization was done in
Mathematica by Wolfram Reasearch and Microsoft
Excel.
As stated in the introduction, the basic MRG is de-
termined by the ATC3 (four characters) with the hig-
hest costs with respect to patient, quarter and physi-
cian using prescription data. Thus, only patients with
drug prescriptions can get a MRG. In analogy to the
DRG system in inpatient care the basis MRG is exten-
ded by a degree of severity determined by age, multi-
morbidity (measured by polypharmacy) and prescrip-
tion intensity.
Hence, relations between MRG and ICD-10 co-
des with respect to multimorbidity are of interest. In
the first step we consider patient with one ATC and
one ICD-10 only. The resulting pairs provide ordered
lists of ICD-10 per MRG and vice versa. Although
the vast majority of drugs is prescribed in the field of
multimorbid patients, we can use the obtained lists for
additional considerations regarding all patients.
Let q
m
(a,s) be the fraction of patients within a
certain MRG m and certain age group a in 5 year
classes and a certain gender value s and q
∗
(a,s) the
respective fraction within all patients with drug pres-
criptions. Furthermore let p
m,i
(a,s) be the fraction of
patients with a certain diagnosis i within all patients
with MRG m, with age and gender values a and s.
Then
p
1
(m,i) := p
m,i
(∗,∗) =
∑
a,s
p
m,i
(a,s)q
m,i
(a,s)
is the fraction of patients with ICD i within the group
of all patients with MRG m. We compare it with the
respective fraction of patients with ICD-10 i within
all patients with drug prescriptions including age and
gender standardization:
p
2
(m,i) := p
std
m,i
(∗,∗) =
∑
a,s
p
∗,i
(a,s)q
m,i
(a,s).
Without age standardization we get the fraction of pa-
tients with ICD i as
p
3
(∗,i) := p
∗,i
(∗,∗) =
∑
a,s
p
∗,i
(a,s)q
∗,i
(a,s).
The last value may be of interest if there are age rela-
ted prescription restrictions with certain exceptions.
The drug related grouping is done on the physican
group level. Looking at medical disciplines or specia-
lists would give different results. The research sub-
ject determines which point of view is more relevant.
The algorithm is identifying diagnoses leading to a
higher probability of aquiring a certain MRG. That
means if a certain diagnosis i is relevant for a given
MRG value m, we should demand p
1
(m,i) > p
2
(m,i)
or weaker p
1
(m,i) > min(p
2
(m,i), p
3
(∗,i)). This re-
strictions strongly limit the number of diagnoses posi-
tively connected with any given MRG m. The benefit
of any of ICD i with respect to MRG m is measu-
red absolutely by p
1
(m,i) − p
3
(m,∗) or relatively by
p
1
(m,i)/p
3
(∗,i). Resulting diagnoses can be ranked
by the relevance for every MRG considered. Out of all
diagnoses of a patient with a certain MRG we select
the highest ranking in the consideration mentioned
before. If a matching diagnosis does not exist, we re-
peat the consideration disregarding physician groups
(i.e. general practitioners, surgeons and psychiatrists).
If there is no matching at all, it is likely a problem
due to documentation, i.e. a prescription of insulin wi-
thout coding a diagnosis of diabetes.
HEALTHINF 2018 - 11th International Conference on Health Informatics
324

Let r(a) = (r
1
(a),r
2
(a),...r
n
(a)) be a vector with
components that are given by the fraction of patients
with age a and MRG i(i = 1,...,n) where n is given
by the number of MRG ordered for instance lexico-
graphically. One can consider this with or without a
gender restriction. For the age values a and b we con-
sider the Manhattan distance
d(a,b) = sum
n
i=1
|r
i
(a) − r
i
(b)|.
We can consider an inversion problem. If there is gi-
ven a vector of disease fractions s = (s
1
,s
2
,...,s
n
) we
want to determine the respective age by
a = Min
a
d(r(a),s)!
A vector of a certain subgroup of patients with a cer-
tain social status or insurance type with given age may
optimally match a vector of a different age group.
This can be interpreted as a higher or lower biological
age. It has been already remarked, that polypharmacy
is on factor for the determination of severity levels. A
alternative model can be built applying polypharma-
cy instead of MRGs. We consider an age dependent
polypharmacy vector v(a) = (v
1
(a),v
2
(a),...,v
20
(a))
where the component v
i
(a) describes the fraction of
patients with i different drug groups (ATC3). Mo-
re than 20 groups are included in the v
20
(a) value.
Again, a Manhattan distance can be defined as
d
2
(a,b) = sum
20
i=1
|v
i
(a) − v
i
(b)|.
with a related inversion problem
a = Min
a
d
2
(v(a),s)!
Raising the question if the MRG-based or the
polypharmacy-based model is more suitable for de-
termination of the biological age of any chosen sub-
group.
3 RESULTS
For three example MRGs those diagnoses having a
higher conditional probability then in the unconditio-
nal case are listed. Within the basis MRG M01A (An-
tiinflammatory and antirheumatic products) 33.0 % of
the patients (p
1
) have
”
dorsalgia“ (M54). In an age
and gender adjusted patient group without the con-
dition M54 only 17.8 % have a M54 diagnosis (p
2
).
Without age and gender adjustment we have 18.2 %
(p
3
).
Table 3: Antiinflammatory and antirheumatic drugs
(M01A).
ICD p
1
p
2
p
3
ICD label
M54 33.0 % 17.8 % 18.2 % Dorsalgia
M17 12.6 % 8.6 % 10.8 % Gonarthrosis [arthrosis of
knee]
M51 10.9 % 7.6 % 7.5 % Other intervertebral disc dis-
orders
In patients with MRG M01A (antiinflammatory
and antirheumatic drugs) only three diagnoses resul-
ted in an increase in the conditional probability. For
betablocking agents the same hold true for six ICD-
10. The top ranking diagnosis is I10 (
”
essential pri-
mary hypertension“).
Table 4: Beta blocking agents (C07A).
ICD p
1
p
2
p
3
ICD label
I10 80.3 % 67.3 % 61.4 % Essential (primary) hyperten-
sion
E78 38.4 % 35.7 % 31.9 % Disorders of lipoprotein me-
tabolism and other lipidaemi-
as
I25 28.3 % 23.5 % 20.7 % Chronic ischaemic heart di-
sease
I48 14.9 % 11.4 % 10.1 % Atrial fibrillation and flutter
I50 10.7 % 10.5 % 9.6 % Heart failure
E79 10.6 % 10.5 % 9.3 % Disorders of purine and py-
rimidine metabolism
The most significant diagnosis for patients with
antidepressants is a F32 (
”
depressive episode“).
Table 5: Antidepressants (N06A).
ICD p
1
p
2
p
3
ICD label
F32 45.4 % 14.8 % 13.6 % Depressive episode
M54 19.6 % 18.8 % 18.2 % Dorsalgia
F41 14.8 % 5.1 % 4.4 % Other anxiety disorders
F45 13.0 % 6.8 % 6.2 % Somatoform disorders
G47 12.5 % 7.3 % 7.9 % Sleep disorders
R52 12.1 % 8.4 % 8.4 % Pain, not elsewhere classified
N40 11.4 % 10.9 % 5.0 % Hyperplasia of prostate
F33 10.9 % 3.4 % 3.0 % Recurrent depressive disorder
For each example MRG the model has determi-
ned corresponding a top level diagnosis, for MRG
M01A (Antiinflammatory and antirheumatic producs)
the diagnosis M54 (
”
dorsalgia“), for MRG C07A (Be-
ta blocking agents) the diagnosis I10 (
”
essential pri-
mary hypertension“) and for MRG N06A (Antide-
pressants) the diagnosis F32 (
”
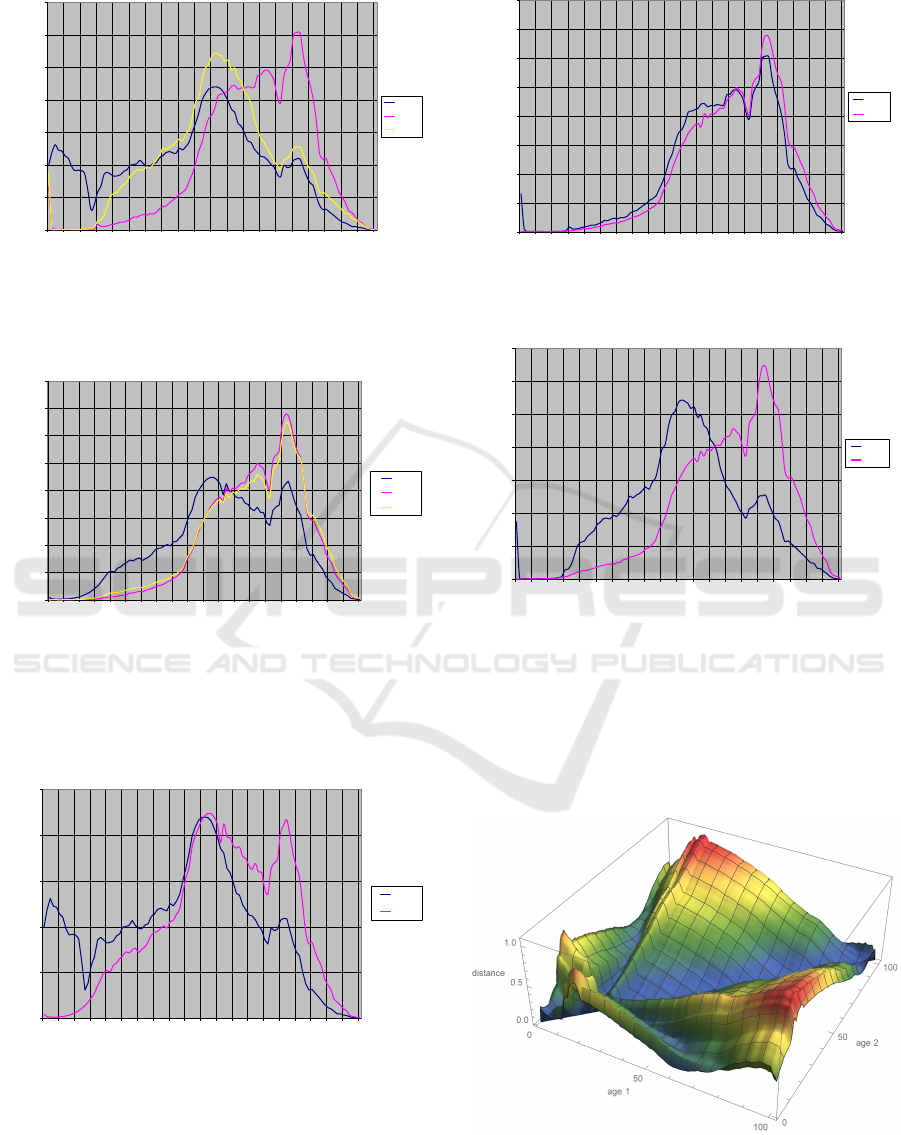
depressive episode“).
Figures 3 and 4 show the different age distributions
on both the MRG and the ICD-10 level.
Relations of Morbidity Related Groups (MRG), ICD-10 Codes and Age and Gender Structure in Outpatient Treatment
325
0.0%
0.5%
1.0%
1.5%
2.0%
2.5%
3.0%
3.5%
0 5 10 15 20 25 30 35 40 45 50 55 60 65 70 75 80 85 90 95 100
relative share of patients
age
MRG age spectra of M01A (Antiinflammatory and antirheumatic producs,
non-steroids), C07A (Beta blocking agents) and N06A (Antidepressants)
M01A
C07A
N06A
Figure 3: Age distributions of MRG M01A, C07A and
N06A.
0.0%
0.5%
1.0%
1.5%
2.0%
2.5%
3.0%
3.5%
4.0%
0 5 10 15 20 25 30 35 40 45 50 55 60 65 70 75 80 85 90 95 100
relative share of patients
age
ICD age spectra of M54 (Dorsalgia), I10 (Essential primary hypertension)
and F32 (Depressive episode)
M54
I10
F32
Figure 4: Age distributions of ICD M54, I10 and F32.
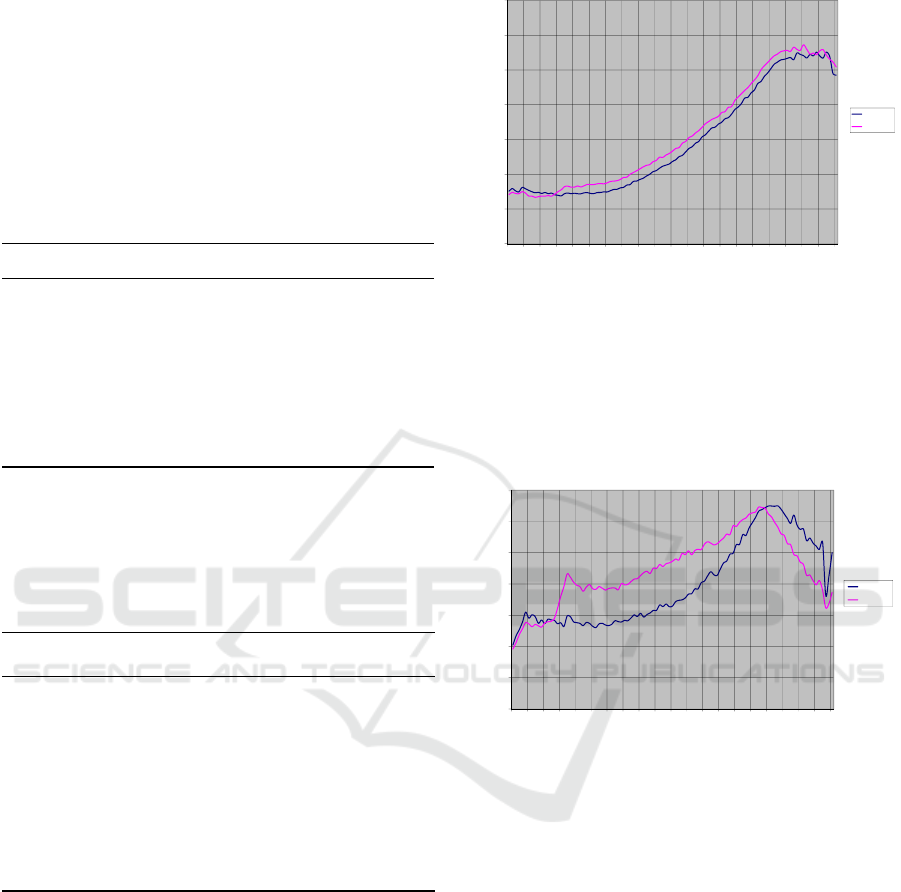
Next we compare the age distribution of the con-
sidered related MRG and ICD values (Figures 5-7).
0.0%
0.5%
1.0%
1.5%
2.0%
2.5%
0 5 10 15 20 25 30 35 40 45 50 55 60 65 70 75 80 85 90 95 100
relative share of patients
age
age spectra of MRG M01A (Antiinflammatory and antirheumatic producs,
non-steroids) and ICD M54 (Dorsalgia)
M01A
M54
Figure 5: Age distributions of MRG M01A and ICD M54.
0.0%
0.5%
1.0%
1.5%
2.0%
2.5%
3.0%
3.5%
4.0%
0 5 10 15 20 25 30 35 40 45 50 55 60 65 70 75 80 85 90 95 100
relative share of patients
age
age spectra of MRG C07A (Beta blocking agents)
and ICD I10 (Essential primary hypertension)
C07A
I10
Figure 6: Age distributions of MRG C07A and ICD I10.
0.0%
0.5%
1.0%
1.5%
2.0%
2.5%
3.0%
3.5%
0 5 10 15 20 25 30 35 40 45 50 55 60 65 70 75 80 85 90 95 100
realative share of patients
age
age spectra of MRG N06A (Antidepressants) and ICD F32 (Depressive
episode)
N06A
F32
Figure 7: Age distributions of MRG N06A and ICD F32.
Generally the age dependent vectors r(a) determine
the subgroup with corresponding age a. Age distan-
ces at least locally but also for the age between 25 an
95 years the Manhattan distance increases monotoni-
cally (independence of b while fixing a or vise versa
respectively).
Figure 8: Manhatten distance of MRG-fractions with re-
spect to age.
Results again can be applied to analyze if the bio-
HEALTHINF 2018 - 11th International Conference on Health Informatics
326
logical age of a subgroup of patients (i.e. with a cer-
tain social status) is better adapted than calendaric age
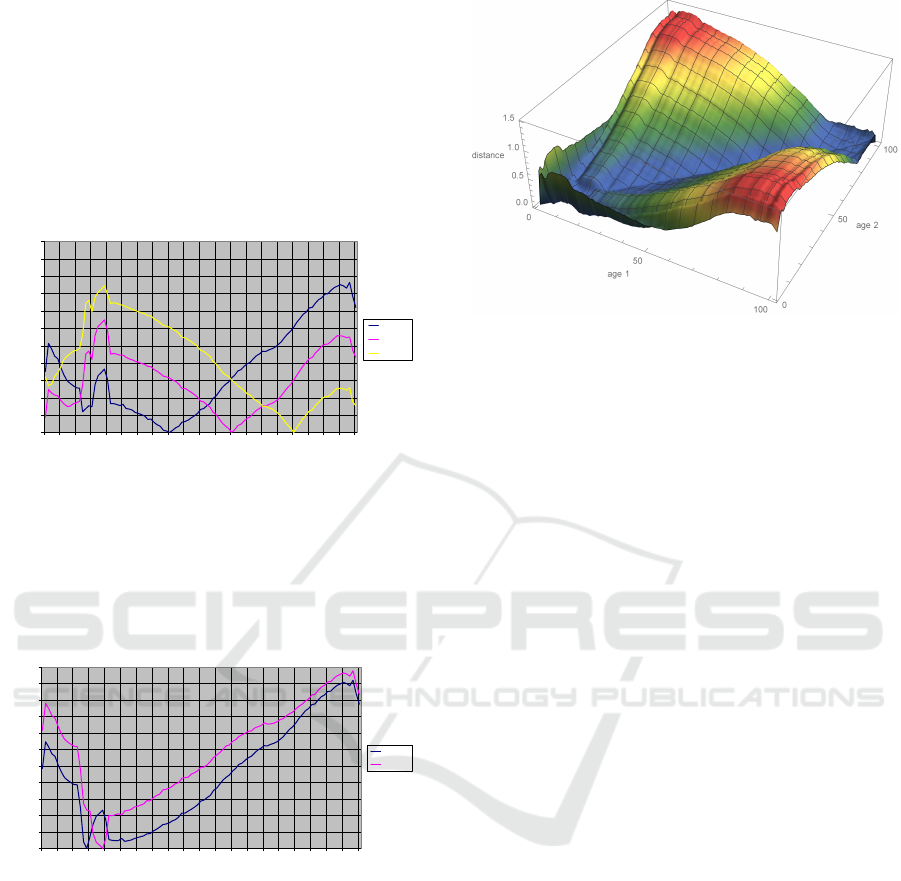
(Figure 9). We observe special local distance maxima
for childhood and adolescence.
Fixing one side of distance measurement (setting
parameter b to 40, 60 and 80 years), we observe
monotonic behaviour of d(a,b) for a ∈ [20,b] and
a ∈ [b, 95]. For b ∈ [25,95] with a local maximum for
a = 19.
0.0
0.1
0.2
0.3
0.4
0.5
0.6
0.7
0.8
0.9
1.0
1.1
0 5 10 15 20 25 30 35 40 45 50 55 60 65 70 75 80 85 90 95 100
distance
age
Manhatten distance
age 40
age 60
age 80
Figure 9: Manhatten distance of MRG-fractions for patients
of age 40, 60 and 80.
A different curve is observed for b = 14 and b =
19 years. Regarding patients with b = 14 there is only
a clear distance information to other patients with a ∈
[2,19].
0.0
0.1
0.2
0.3
0.4
0.5
0.6
0.7
0.8
0.9
1.0
1.1
0 5 10 15 20 25 30 35 40 45 50 55 60 65 70 75 80 85 90 95 100
distance
age
Manhatten distance
age 14
age 19
Figure 10: Manhatten distance of MRG-fractions for pati-
ents of age 14, 19.
At least for the ages between 30 and 90 we ob-
serve similar results for age dependent vectors ν(a)
regarding polypaharmacy or MRGs (Figure 11).
In large areas we detect age sharply. This allows
for comparison of models with and without gender
components.
Figure 11: Manhatten distance of multimorbidity with re-
spect to age.
4 CONCLUSIONS
The MRG determines an unique type of patient ba-
sed on drug prescription data labeled by a drug group.
Furthermore we can construct another unique type
using the number of prescribed drug groups (poly-
pharmacy). If we want to analyze diagnosis structu-
res in relation to age, gender, geographical regions or
social status, a well defined patient type might be use-
ful. Reversely, starting with a special diagnosis and
asking for the probability of getting a special drug
or drug group again with age and gender standardi-
zation might be of interest. The presented modeling
approach can be applied in both directions. This fle-
xibility offers a wide range of applications especially
when patient orientation is necessary for the develop-
ment of new forms of care. The need of an individua-
lized medicine in certain patient subgroup can also
be met and synchronized with the present risk adjust-
ment scheme in the German statutory health insuran-
ce. This risk adjustment scheme might also profit by
redefinition of patient groups and underlying parame-
ters.
REFERENCES
Bratzke, B. Spies, K.-P. and Krebs, S. (2012). Morbi-
dit
¨
atskomponente bei Arznei- und Heilmittelbudgets
einf
¨
uhren. Deutscher
¨
Arztetag, Drucksache V I-37.
Busse, R. Panteli, D. and Krebs, S. (2015). Arzneimittel-
versorgung in der GKV und 15 anderen europ
¨
aischen
Gesundheitssystemen: Ein systematischer Vergleich.
Working papers in health policy and management.
Universit
¨
atsverlag der TU Berlin, 11.
Emcke, T., Ostermann, T., v. Arnstedt, E., Heidbreder, M.
(2017). Comparison of Different Implementations of
Relations of Morbidity Related Groups (MRG), ICD-10 Codes and Age and Gender Structure in Outpatient Treatment
327

a Process Limiting Pharmaceutical Expenditures Re-
qired by German Law. Healthinf 2017.
GKV Versorgungsst
¨
arkungsgesetz (GKV-VSG) (2015).
BGBl., I:1211.
InEK (2016). Institut fr das Entgeltsystem im Krankenhaus
GmbH - German Diagnosis Related Groups, Version
2017 - Definitionshandbuch Band 1-3.
Jeschke, E., Ostermann, T., Vollmar, HC, Tabali, M., Matt-
hes, H. (2012). Depression, Comorbidities, and Pre-
scriptions of Antidepressants in a German Network
of GPs and Specialists with Subspecialisation in An-
throposophic Medicine: A LongitudinalObservational
Study. Evid Based Complement Alternat Med. 2012.
Ostermann, T., Schuster, R. (2015). An Informationtheo-
retical Approach to Classify Hospitals with Respect
to Their Diagnostic Diverty using Shannon’s Entropy.
Healthinf 2017.
Schuster, R. (2015). Morbidity Related Groups (MRG) and
drug economic index - a new concept after the age of
Richtgr
¨
oßen benchmarks in Germany. GAA 2015.
Schuster, R., Emcke, T., v. Arnstedt, E., Heidbreder, M.
(2016). Morbidity related groups (mrg) for epide-
miological analysis in outpatient treatment. IOS Press
783-787.
Sinowatz, F. (2015). Ressourcenalokation in der haus
¨
arztli-
chen Versorgung: eine empirische Untersuchung. Dis-
sertation LMU M
¨
unchen: Medizinische Fakult
¨
at.
Wersborg, T. (2006). Morbidit
¨
atsbezogene Richtgr
¨
oen zur
Steuerung einer bedarfsgerechten und wirtschaftli-
chen Arzneimittelversorgung innerhalb der gesetzli-
chen Krankenversicherung in Deutschland. Disserta-
tion, LMU M
¨
unchen: Medizinische Fakult
¨
at.
HEALTHINF 2018 - 11th International Conference on Health Informatics
328
