
Tapered Fibre Optic Biosensor (TFOBS) by Optically Controlled
Etching for Label-Free Glucose Concentration Monitoring
Biomedical Optics
Sergio Mena, Maria Morant, Juan Hurtado and Roberto Llorente
Nanophotonics Technology Center, Universitat Politècnica de València, Camino de Vera s/n, Valencia, Spain
Keywords: TFOBS, Glucose Sensing, Label-Free, Optical Sensor, Chemical Etching, Biconical Taper, Refractive Index,
Optically Controlled Etching.
Abstract: This paper proposes, designs and demonstrates experimentally a tapered fibre optic biosensor (TFOBS)
fabricated by an optically controlled HF chemical etching. The fabricated device is demonstrated to operate
properly as a label-free sensor for glucose concentration detection. This work presents a novel fabrication
method of a single-mode TFOBS controlling the reaction rate by changing the HF concentration and
monitoring the optical power variation at the fibre output. Two TFOBS fabricated with different cladding
diameters are evaluated experimentally to sense different glucose concentrations observing the changes in the
refractive index of the medium in various solvents. The sensing capabilities are evaluated by modal
interferometry measurement of both intensity and phase variations of the received optical signal.
1 INTRODUCTION
Glucose (C
6
H
12
O
6
) is one of the most abundant
organic compound in the human body, being part of a
large number of macromolecules with structural
importance. The singularity of this molecule comes
from its capability of providing cellular energy. The
presence of glucose in blood enables the energetic
cell’s sustenance, but it is also present in other
biofluids such as urine, tears and sweat. The
concentration control of glucose is of vital importance
in patients with diabetes mellitus, whose amount
increases every year (World Health Organization,
2016), for the maintenance of homeostasis and the
regulation of insulin application. At present, most
common commercial methods to measure glucose
concentration are based on amperometric sensing
measuring the reaction of glucose oxidase (GOx) with
the glucose (Ferri et al., 2011). The amperometric
sensing method is specific only for glucose detection
and enables low-levels detection but has some
disadvantages, such as:
▪ Complicated adaptation to continuous
measurement.
▪ Electrical interference in biological fluids.
▪ Specificity affected by other oxidizing
substances.
Due to the limitations of electrochemical sensors,
optical biosensing has been appointed as a good
solution to measure different biological elements
such as Botulinum Neurotoxin (Guo et al., 2011) or
Ammonia (Ruan et al., 2008). In fibre optic
biosensors, the optical fibre is employed as a
transduction media in order to produce or detect a
signal proportional to the concentration of the
biological element to sense (Bosch et al., 2007).
Among other optical sensor types, tapered optical
fibre sensors enables the exposure of evanescent field
(EF) beyond the surface of the sensing region
(Fielding and Davis, 2002). These systems are known
as tapered fibre optic biosensors (TFOBS) and enable
label-free detection (Leung et al., 2008a), reduced
sample size and real-time response at a reduced size
and low price (Qiu et al., 2015). In the last years,
several TFOBS studies have been performed
comparing single-mode and multimode fibre sensors,
pointing out that multimode fibre sensor are less
efficient due to a lower average electric field at the
surface of the fibre compared with single-mode fibres
(Fielding and Davis, 2002).
More complex sensors have been developed in the
last years, such as graphene-based sensors (Qiu et al.,
2015) and antibody-immobilized protein sensors
(Leung et al., 2008b). The simplicity of TFOBS
resides on the suitability of optical fibre media to
166
Mena, S., Morant, M., Hurtado, J. and Llorente, R.
Tapered Fibre Optic Biosensor (TFOBS) by Optically Controlled Etching for Label-Free Glucose Concentration Monitoring - Biomedical Optics.
DOI: 10.5220/0006556301660173
In Proceedings of the 6th International Conference on Photonics, Optics and Laser Technology (PHOTOPTICS 2018), pages 166-173
ISBN: 978-989-758-286-8
Copyright © 2018 by SCITEPRESS – Science and Technology Publications, Lda. All rights reserved

radiate the evanescent waves travelling through the
fibre to the outside to interact with the sample to be
detected (Qiang et al., 2014). A tapered fibre is
produced by reducing gradually the diameter of a
common optical fibre, which enables the interaction
of the evanescent field guided in the fibre with the
external environment (Baude and Branco, 2013).
There are two main techniques for the fabrication of
tapered fibre: (i) by chemical or mechanical corrosion
of the fibre cladding (Ruan et al., 2008; Bal et al.,
2012) or (ii) by simultaneous heating and stretching
of the fibre (Kenny et al., 1991). The main differences
between both techniques resides in the resulting core
diameter. In the first case, implementing corrosion of
the cladding, the fibre core remains the same (i.e.
8.2 μm in single-mode fibre SMF-28). While, in the
second case, by heating and stretching, the diameter
of both the cladding and the core is reduced in the
same proportion (Kenny et al., 1991). In this work, a
simple method to produce the EF on a single-mode
fibre by cladding corrosion is described, producing a
tapered fibre with hydrofluoric acid etching
(Haddock et al., 2003). This approach provides better
light transmission due to the no degradation of the
fibre core (Bal et al., 2012). The resulting tapered
fibre can be used as an optical biosensor and is an
affordable solution for glucose monitoring.
This paper is structured as follows: in section 2 the
laboratory steps for the fabrication of the tapered
optical fibre are described in detail. A novel
fabrication method of TFOBS is proposed controlling
the reaction rate by changing the HF concentration
and monitoring the optical power variation at the fibre
output. Next, in section 3 of this work, we evaluate
experimentally the sensing method based on modal
interferometry for different concentrations. Finally,
in section 4, the main conclusions of this work and
the consideration of future implementations are
reported.
2 OPTICALLY CONTROLLED
CHEMICAL ETCHING
TAPERED FIBRE
FABRICATION
The novelty of the proposed fabrication method
resides in performing the chemical etching at a
controlled rate. There are two different approaches
for monitoring the chemical etching process. The first
one employs an optical system (e.g a microscope or
magnifying glass) to measure in real-time the waist
diameter while the chemical etching is performed.
However, this method is not appropriate for chemical
etching employing hydrofluoric (HF) acid for
security reasons. The second approach is based on
monitoring the pass-through optical power, using an
optical light source and a potentiometer, and
correlating the power loss with the diameter of the
optical fibre in the reaction length. This approach is
implemented following the experimental setup
depicted in Figure 1.
Figure 1: Laboratory setup for optically controlled HF acid
chemical etching.
In this experimental demonstration an external
cavity laser (ECL) operating at λ = 1549.65 nm (Ando
AQ8201-13B) is employed. A variable optical
attenuator (VOA) is used to reduce the optical power
level at the input of the SMF-28 reactor to avoid a
possible fibre break. The chemical etching is
performed using a HF solution of 49.5 wt% to be
neutralized with NaOH solutions of 0.1 M and 5 M.
An optical power meter and a chronometer are used
to measure the evolution of optical power level
passing through the tapered fibre with time.
When the HF come into contact with the SiO
2
of
the optical fibre, the resulting chemical reactions are
defined in Equation 1 and Equation 2. When the HF
acid has a high concentration, the second reaction is
prevailing (Abbadie et al., 2007), which makes it
easier to obtain a mathematical model of the reaction
process:
2 4 2
42SiO HF SiF H O
(1)
2 2 6 2
62SiO HF H SiF H O
(2)
The mathematical expressions for the chemical
reaction are included in Equation 3 and Equation 4
(Haddock et al., 2003), where D
i
and D
f
are the initial
and final diameters of the fibre, respectively, C and Z
are constant values, t is the reaction time, [HF] is the
acid concentration, k is the reaction constant, r is the
density of the silica, P is the received optical power
level and L is the length of the fibre in contact with
the acid.
2 [ ]
,
f
ii
D
k HF
C Kt K
DD
(3)
22
P D L P ZD L
(4)
Tapered Fibre Optic Biosensor (TFOBS) by Optically Controlled Etching for Label-Free Glucose Concentration Monitoring - Biomedical
Optics
167
The K parameter groups the constant parameters
of the Equation 3. As a result of Equation 3 and
Equation 4, we obtain the linear relation expressed in
Equation 5:
f
i
P
C Kt
P
(5)
With these equations it is possible to have a first
calculation of the necessary reaction time in order to
reach the desired diameter of the fibre for the TFOBS.
Next, using a simple experimental setup as depicted
in Figure 1, the optical power level can be monitored
to confirm if the chemical reaction is done properly
and to determine when to neutralize and stop the
reaction. However, some aspects should be taken into
account:
▪ The reaction variable K of the mathematical
model is constant as long as the environmental
conditions are stable (i.e. room temperature,
lighting...)
▪ The relation between the diameter and the
received power is accurate when D
f
approaches
the core diameter, as the optical signal is
mainly transmitted through the core. Thus, the
linear relation depicted in Equation 5 is valid
when the received optical power starts
decreasing.
In this work, the objective is to obtain, from a
SMF-28 fibre with 125 μm diameter cladding, a
biconical structure with a reduced cladding of 15 μm
for TFOBS implementation. Table 1 includes the
monitoring parameters obtained using the
mathematical model. The K value is obtained from 20
essays under standard conditions according to
(Haddock et al., 2003). The volume of HF acid used
is 75 μL, of which only about 0.8% will react, making
the etching process rate approximately constant.
Table 1: Monitoring parameters of the chemical etching.
1
()Ks
a
i
P
P
()ts
34
2.3 10 1.9 10
2
1.4 10
428.5 40
2.1 Design and Assembly of the
Reactor
In order to be able to control the chemical etching of
the single-mode fibre, we designed and fabricated a
reactor that enables the immobilization of the fibre in
an HF-resistant structure, exposing only a given fibre
length L to the acid.
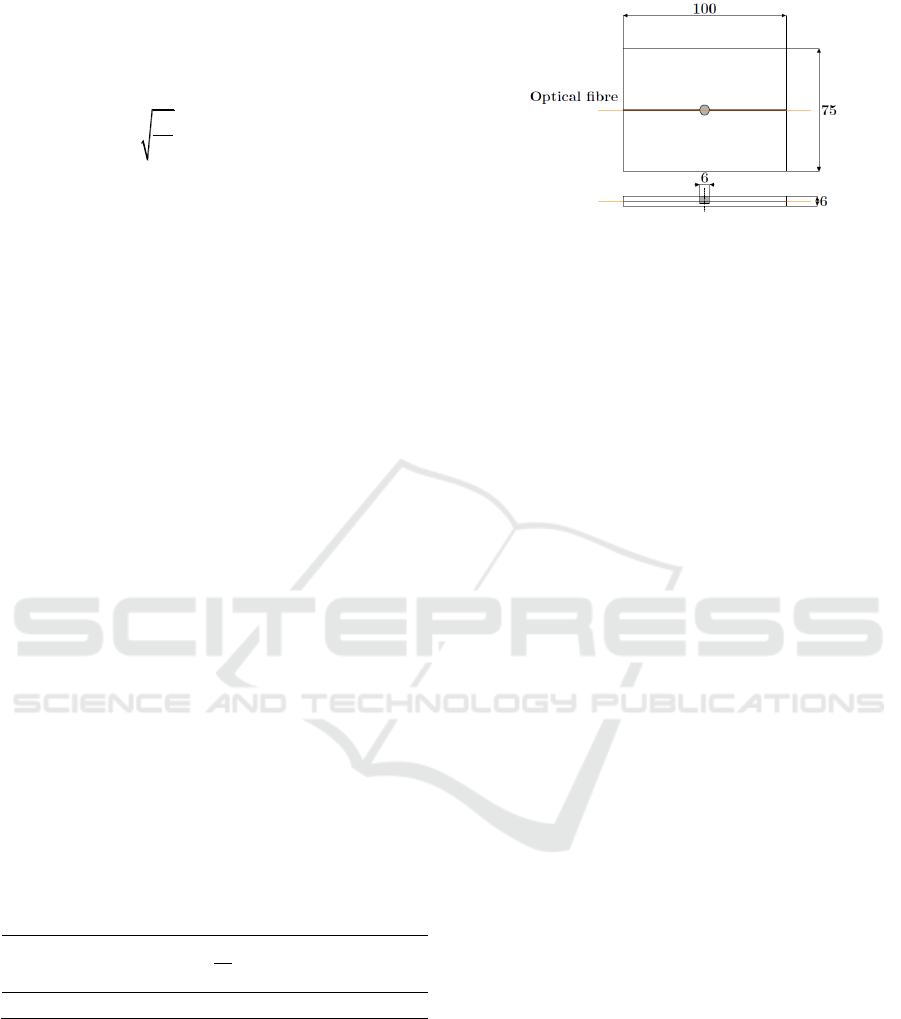
Figure 2: Scheme of the reactor designed for HF chemical
etching of single-mode fibre. Heights represented in
millimetres. The well depth is, approximately, 4.5 mm.
Figure 2 describes the size and shape of the
fabricated reactor. In the assembly, 6 mm of the fibre
is positioned in the place of the acid, while the rest of
the fibre is isolated. The process followed for the
fabrication comprises:
1. Drilling a 100×75×3 mm polymethylmethacrylate
(PMMA) plate (Plexiglass®) with 6 mm
diameter.
2. Locate another PMMA plate with the same
dimensions below with an indent under the same
6 mm diameter hole as the top plate.
3. Placement of the optical fibre between both plates,
having peeled the plastic coating of the fibre in the
length to be etched. A small slot is marked in the
PMMA to locate the SMF-28 fibre.
4. Both plates are sealed with Ethylene-vinyl acetate
(EVA) plastic glue (Rapid®).
5. Measurement of the received power after
transmission through the installed fibre (using the
experimental setup depicted in Figure 1) before
starting the chemical etching in order to verify that
the fibre has not been damaged.
With the SMF-28 fibre located in the reactor we
can start the chemical etching following the
procedure described in the next section.
2.2 Chemical Etching of the Fibre
In this paper, we report the results obtained with two
different methods for tapered fibre fabrication. In first
place, we evaluate a chemical etching procedure
performed at a single reaction rate (Bal et al., 2012).
This procedure is very sensitive and difficult to
control, so we present a novel method that controls
the produced reaction in order to obtain a stable
diameter reduction. This second fabrication method is
presented with the intention of increasing the
repeatability and automation of the process.
The main steps followed for the chemical etching
and fabrication of the tapered fibre are:
PHOTOPTICS 2018 - 6th International Conference on Photonics, Optics and Laser Technology
168
1. Connection of the ECL laser to the input of the
SMF-28 reactor and monitoring the optical power
level at the fibre output using the experimental
setup depicted before in Figure 1. In this
experiment, the input power is set to -15 dBm
(31.6 μW).
2. Addition of 75 μL HF 49.5 wt % in the reactor.
3. Power monitoring and extraction of the HF when
the desired power level is reached.
4. Addition and extraction of 75 μL of deionized
water for removing of HF residue.
5. Neutralization of the acid in the reactor with
75 μL of 5M NaOH. It should be noted that the
chemical reaction between HF and NaOH is
aggressive and forms NaF crystals that could
damage the microfibre. For this reason, the HF
residue should be minimum and the concentration
is reduced in the previous step with deionized
water.
6. Stabilization of the reactor with 75 μL of 0.1M
NaOH over 30 minutes. While the stabilization
takes place, the power is also monitored as if the
power continues decreasing means that the
diameter is also decreasing.
7. Evaluation of the resulting fibre diameter by
microscopy observation.
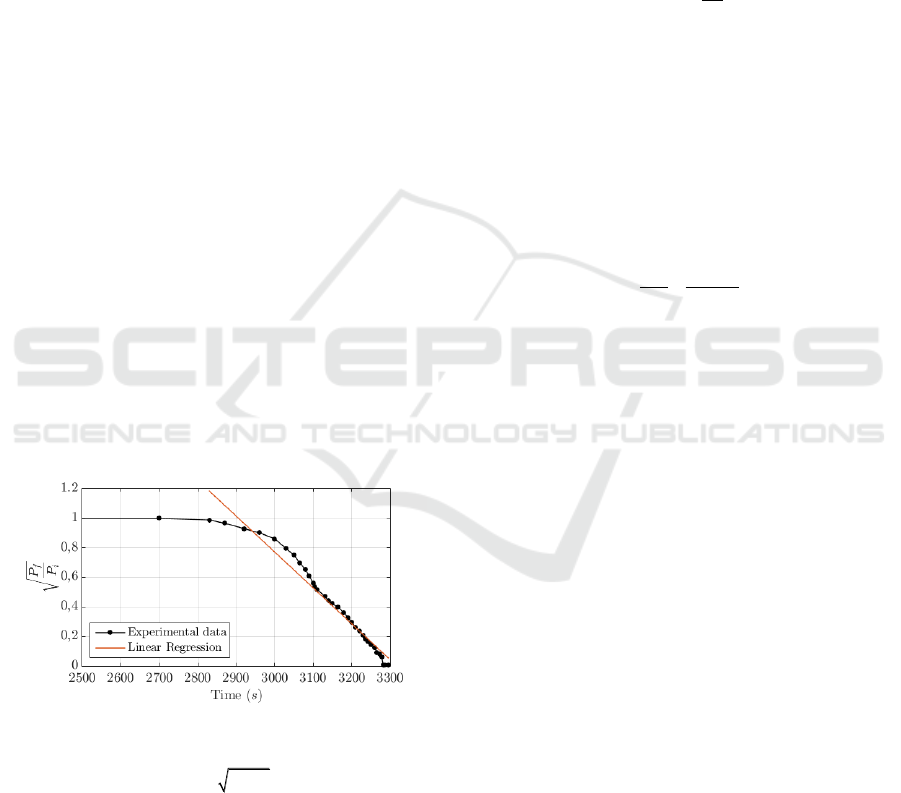
The power relation from Equation 5 is represented in
Figure 3 from the experimental data obtained with the
conventional chemical etching procedure. The
received optical power level at the output of the fibre
does not vary before 2800 s following the linear
relation reported in (Haddock et al., 2003).
Figure 3: Experimental optical power levels measured
using conventional chemical etching and linear regression
with analytical expression
/ 8.06 0.0024
fi
P P t
and a
coefficient of determination
2
0.9602R
.
As it can be observed in Figure 3, the power fall
is considerably fast and abrupt, making the procedure
of acid extraction and neutralization complicated
considering the security measures when dealing with
HF acid. In this first experiment, due to the inability
to extract the acid at the exact moment, the fibre was
completely degraded. For this reason, we propose to
include an additional step between 2 a 3 adding some
extra drops of water during the chemical reaction.
This reduces the HF concentration in the reactor and
therefore reduces the reaction rate (Ko et al., 2016)
and the K parameter of Equation 5. This enables a
more controllable and reproducible chemical etching.
In this work, a water volume input control system
depending on the rate of change of output power
(dP
f
/dt) was implemented as:
2
0
1
( 1)
H O i HF
C
VV
C
(6)
The direct relationship between P
f
and [HF] is not
known, but we know that dP
f
/dt decrease in absolute
value when [HF] is reduced. Thus, the control system
decreases the concentration of acid proportionally to
the increase of dP
f
/dt over a desired value by adding
a certain volume of water and extracting the same
volume from the resulting solution. This reaction is
represented mathematically in Equation 6 and
Equation 7:
1 0 0
()
f
desired
dP
dP
C C C
dt dt
(7)
where
2
HO
V
is the volume of water to be added,
HF
is
the density of the HF acid and C
0
and C
1
are the initial
and final concentrations of the solution, respectively.
Following this approach, a reasonable value of
variation rate of P
f
is 1 μW/s.
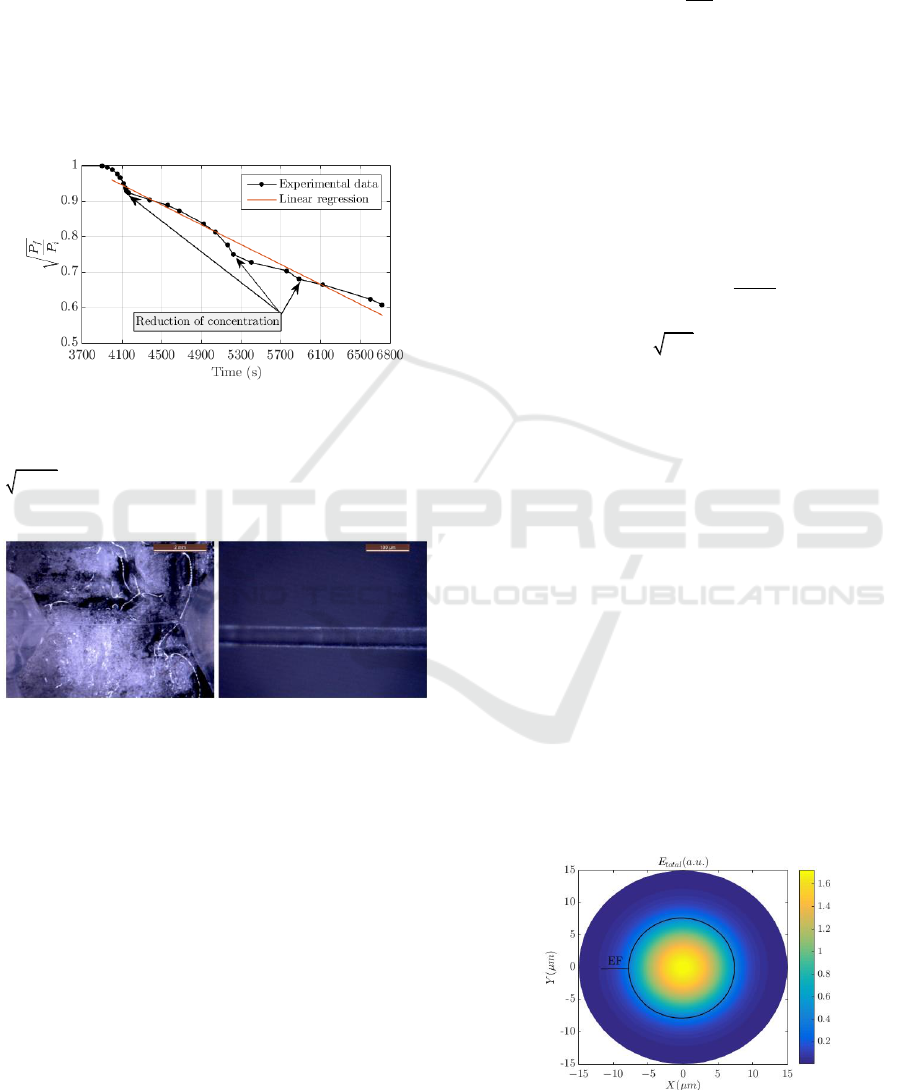
2.3 TFOBS Fabrication Results with
Optically Controlled Etching
Figure 4 shows the experimental power variation
measured with the optically controlled etching
method as a function of the reaction time. In this
research, eight tapered fibres samples were
manufactured using manual control of [HF] as a
function of the P
f
variation, to ensure the reliability
and repeatability of the method. The results depicted
in Figure 4 correspond to TFOBS sample 7. We
represented the three extra steps of
2
HO
V
addition to
control the etching rate. In this case, the added
volume was
2
HO
V
= 75 μL. If we consider an
automated control system for mass production, the
added volume would depend on the increase of
| / |
f
dP dt
.
Taking into account the K obtained from the linear
regression and the duration of the etching, the
procedure using the optically controlled etching is
less abrupt as it can be observed in Figure 4. This
Tapered Fibre Optic Biosensor (TFOBS) by Optically Controlled Etching for Label-Free Glucose Concentration Monitoring - Biomedical
Optics
169
means that more time is available to perform the acid
neutralization, but at the expense of longer etching
time for the fabrication of the tapered fibre.
Figure 5 shows the images of the resulting tapered
fibre taken with a digital microscope camera (Leica
DFC420) of the 7
th
sample. The results with the eight
samples obtained a final cladding diameter ranging
from 10 μm to 40 μm, depending on the power ratio
considered to stop the etching. Due to fibre contact
with EVA, the resulting tapers were more likely non-
adiabatic.
Figure 4: Experimental optical power levels measured
using optically controlled chemical etching and linear
regression with analytical expression
4
/ 1.52 1.40 10
fi
P P t
and a coefficient of
determination
2
0.9754R
.
Figure 5: Microscope images of the 7
th
sample fabricated
with the optically controlled etching: (a) the 5 mm length of
the microfibre taper and (b) zoom of the microfibre.
3 TFOBS PERFORMANCE FOR
LABEL-FREE GLUCOSE
CONCENTRATION SENSING
Fibre optic tapers and microfibres generate a strong
EF, making the optical transmission dependent on the
refractive index of the medium (Polynkin et al.,
2005). Especially in non-adiabatic optical fibres, but
also in adiabatic depending on its characteristics, the
fundamental mode (LP
01
) propagated by a standard
SMF-28 fibre is coupled to higher order modes,
mainly LP
02
and LP
11
, whose power distribution in
the fibre core is displaced to the cladding (Zibaii et
al., 2010). The velocity of propagation (β) of each
mode depends on the effective refractive index of the
medium (n
eff
):
0
2
eff
n
(8)
According to Equation 8, the β of the modes
transmitted on the cladding depends on the n
eff
of the
external medium more than the modes transmitted in
the core. This generates an offset, dependent to the
medium, between the modes defined in Equation 9,
that can be registered as a phase shift in the received
signal (Yadav et al., 2014). The change of the
medium also generates a intensity variation in the
received signal according to Equation 10.
0
2
eff
L
Ln
(9)
1 2 1 2
2 ( )I I I I I cos
(10)
In addition to this, due to the taper’s behaviour as
a resonance cavity, the output signal exhibits quasi-
periodic oscillations in the transmittance spectrum
(Salceda-Delgado et al., 2012), whose spatial
frequency also depends on the refractive index of the
medium. This enables measuring experimentally
three main optical parameters: intensity, phase shift
and spatial period of the oscillatory signal, all of them
correlated with the refractive index of the medium
(Shi et al., 2012).
3.1 Glucose Sensing Simulation Study
In order to completely characterize the physical
behaviour for the detection of glucose concentration,
a simulation study was performed using COMSOL
Multiphysics and MATLAB Optical Fibre Toolbox
(Karapetyan, 2012). Figure 6 shows the simulated
electric field generated in the microfibre considering
a 15 μm cladding diameter and the transmission of
first and second order modes at λ = 1550 nm.
Figure 6: Simulated total electric field transverse plane
propagated in a fibre with D
f
= 15 μm cladding diameter.
(a) (b)
PHOTOPTICS 2018 - 6th International Conference on Photonics, Optics and Laser Technology
170
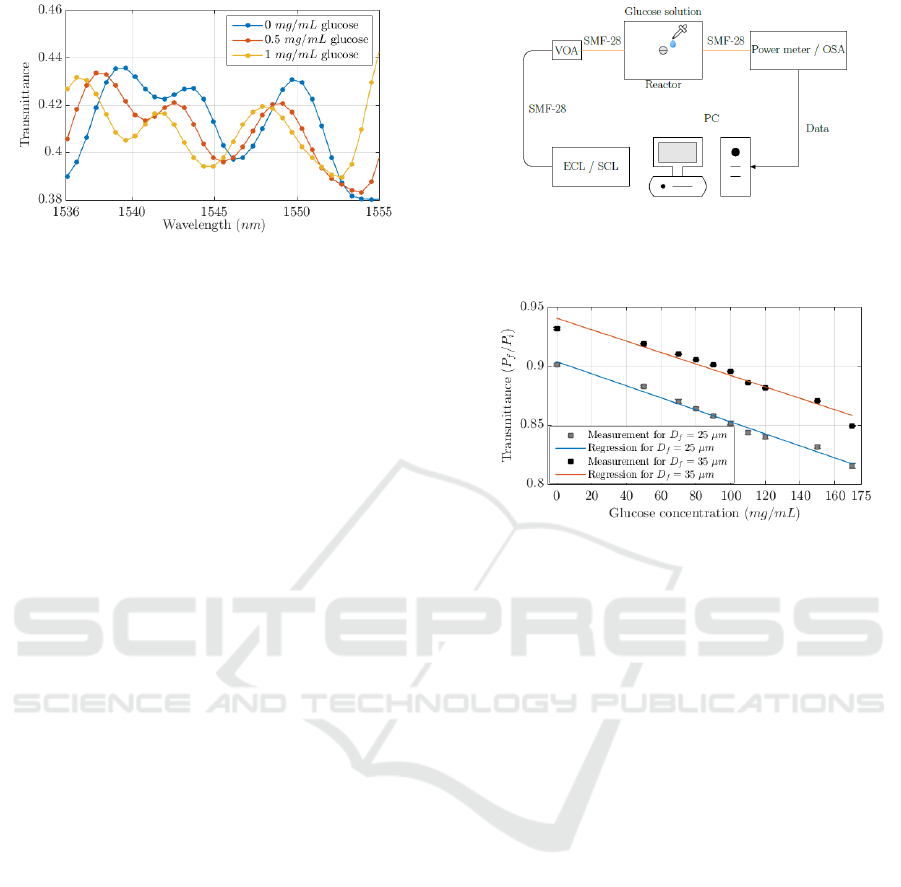
Figure 7: Transmittance between simulated results of the
2D biconical structure designed in COMSOL. Input signal
implementing with LP
01
and LP
02
modes.
The simulation results indicate that the electric
field intensity at 4 μm away from the cladding is
approximately 10% of the mean intensity transmitted
through the microfibre. Additionally, a 2D model of
the TFOBS structure was programmed, where the
index of refraction of the external medium was
defined as a function of a glucose concentration in
distilled water. A complete simulation study is
performed considering 50 wavelength values
between 1536 nm and 1555 nm with a parametric
sweep of 50 glucose concentrations between
0 mg/mL and 50 mg/mL (Zibaii et al., 2010). Figure 7
shows the transmittance values obtained for different
glucose concentrations. Considering a fixed
wavelength, we can observe the power decrease with
the glucose concentration. The phase shift when the
concentration of glucose in the medium changes can
also be observed in Figure 7.
3.2 TFOBS Experimental Results for
Glucose Concentration Sensing
Figure 8 shows the experimental setup implemented
in the laboratory to evaluate the performance of the
developed TFOBS for glucose concentration sensing.
Ten glucose solutions between 0 mg/mL and
170 mg/mL in sterile saline, and 5 sodium chloride
solutions between 0 mg/mL and 20 mg/mL in glucose
50 mg/mL solution were prepared with anhydrous
glucose (99.7% pure), sterile saline solution (0.9%)
and sodium chloride (99.6% pure). An external cavity
laser (ECL) or a super-continuum laser (SCL) are
used to measure the intensity or phase behaviour with
different glucose concentrations. The received signal
after the transmission through the TFOBS is
measured with a power meter and an optical spectrum
analyser (OSA, Advantest Q8384). Once the light
source is stabilized, the optical signal is fed to the
TFOBS using a VOA to set the input level
to -21 dBm.
Figure 8: Experimental setup developed at the laboratory
for the evaluation of the TFOBS intensity and phase
variations for glucose concentration sensing.
Figure 9: Measured transmittance and linear regression for
different glucose concentrations in sterile saline solution.
Then, the target solutions with different glucose
concentrations are applied to the TFOBS. After each
measurement, the TFOBS is cleaned with deionized
water 5 times before applying a new solution.
Figure 9 shows the measured transmittance and
calculated linear regression obtained with TFOBS
samples 5 and 7 fabricated with the proposed
optically controlled etching method. The
transmittance is defined as the ratio between the
output power measured with an air sample and with a
glucose solution. The difference between the
measurements obtained with the different TFOBS
samples correspond to a different final cladding
diameter: 25 μm for 5
th
sample and 35 μm for 7
th
sample. It can be observed that the behaviour of the
linear regression is similar despite the differences in
diameter: the D
f
= 35 μm TFOBS (corresponding to
the 7
th
sample) has an analytical regression defined by
T = 0.9413–4.89·10
–4
[G] with a coefficient of
determination R
2
= 0.9608, while the TFOBS with
D
f
= 25 μm (5
th
fabricated sample) corresponds to
T = 0.9039–5.10·10
–4
[G] with R
2
= 0.9865.
The sensitivity begins to increase considerably
when approaching to the core diameter, but at the
expenses of increasing also its fragility and the noise
level in the measure. The sensitivity of the TFOBS
with 35 μm cladding (7
th
sample) is calculated to be
Tapered Fibre Optic Biosensor (TFOBS) by Optically Controlled Etching for Label-Free Glucose Concentration Monitoring - Biomedical
Optics
171
4.89·10
–4
in absolute value, with a limit of detection
(LOD) by noise at 0.481 mg/mL.
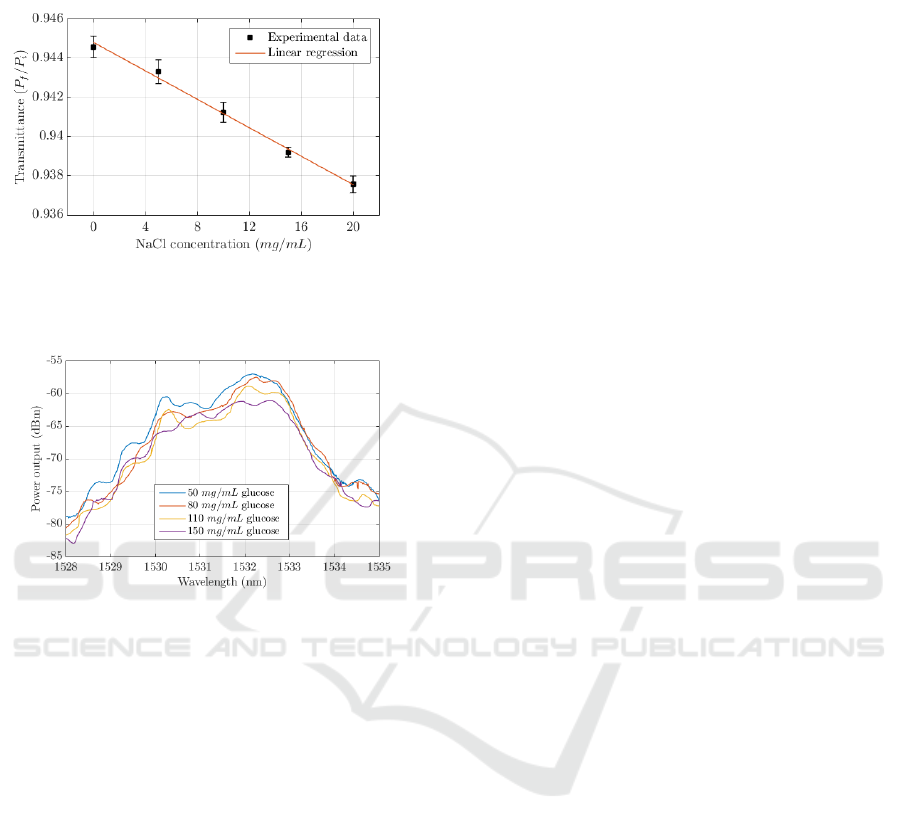
Figure 10: Mean, standard deviation and linear regression
for NaCl concentrations in glucose 50 mg/mL measured
with TFOBS with 25 μm cladding (5
th
sample).
Figure 11: Received SCL spectrum measured with different
glucose concentrations obtained with a TFOBS with 35 μm
cladding (7
th
sample). (0:01 nm resolution).
Figure 10 shows the mean, standard deviation and
linear regression of the transmittance variation of the
TFOBS with 25 μm cladding (5
th
sample) for
different NaCl concentrations in 50 mg/mL glucose.
Due to the non-specific measurement of the refractive
index, a variation in NaCl concentration also impacts
on the resulting TFOBS transmittance.
To increase the TFOBS specificity, it would be
necessary to immobilize a bioreceptor such as
antibodies (Ruan et al., 2008) with a glucose
conjugation (Liébana et al., 2016) or glucose oxidase
enzyme (Khan et al., 2014), which could also be used
as a labelled sensor because of GOx fluorescent
performance (Klonoff, 2012). Figure 11 shows the
experimental data obtained with TFOBS with 35 μm
cladding (7th sample) for different glucose
concentrations in sterile saline solution. In this case,
as depicted in Figure 8, a SCL generating a full width
half maximum (FWHM) optical spectrum of 5 nm
centred at 1532 nm wavelength is used as the light
source to obtain the frequency response of the
TFOBS. Figure 11 shows the variation of the
spectrum measured with the OSA when different
glucose concentrations are applied to the TFOBS.
4 CONCLUSIONS
This paper proposes and evaluates experimentally an
optically controlled etching method for the
fabrication of single-mode TFOBS. Comparing the
performance of the proposed method with single rate
chemical etching, a more accurate design of the
resulting tapered fibre is obtained with a controlled-
rate etching, which improves the accuracy and
repeatability of the fabrication. A reactor was
designed to perform a secure chemical etching with
HF acid. Also, the reliability of the output power
monitoring and its correlation with the resulting
diameter of the microfibre has been evaluated
experimentally, confirming that it is a safe method for
the chemical etching monitoring fulfilling the safety
guidelines for HF handling.
Eight TFOBS samples with different final
cladding diameters of the tapered fibre have been
produced with the proposed optically controlled
etching fabrication method and evaluated
experimentally for the detection of glucose
concentration. The TFOBS sensor comprising a
tapered fibre with 35 μm final cladding diameter
obtained a sensibility of glucose concentration
sensing of 4.89·10
–4
(mg/mL)
–1
in absolute value,
with a LOD of 0.481 mg/mL. This is an acceptable
sensing range for glucose concentration monitoring
with a simple and low-cost implementation.
In this work, label-free glucose detection is
evaluated. Specific glucose bioreceptors could be
used to further improve the TFOBS specificity, and
consequently, its sensitivity and LOD. The materials
employed for the single-mode TFOBS fabrication are
low-cost, which makes the process affordable and
optimized for the fabrication of glucose concentration
sensors. The proposed fabrication method could be
implemented as an automated control system for mass
production.
ACKNOWLEDGEMENTS
This research was supported in part by Spain National
Plan MINECO/FEDER UE TEC2015-70858-C2-1-R
XCORE and RTC-2014-2232-3 HIDRASENSE
projects. M. Morant work was partly supported by
UPV postdoc PAID-10-16 program. BIOFRACTIVE
project with IIS La Fe is also acknowledged.
PHOTOPTICS 2018 - 6th International Conference on Photonics, Optics and Laser Technology
172

REFERENCES
Abbadie, a., Hartmann, J. M., and Brunier, F. (2007). A
review of different and promising defect etching
techniques: from Si to Ge. The Electrochemical Society
A, 10(1):3–19.
Bal, H. K., Brodzeli, Z., Dragomir, N. M., Collins, S. F.,
and Sidiroglou, F. (2012). Uniformly thinned optical
fibers produced via HF etching with spectral and
microscopic verification. Applied optics, 51(13):2282–
2287.
Baude, E. and Branco, P. (2013). Numerical study of
tapered fiber optics as evanescent field sensors.
SBMO/IEEE MTT-S International Microwave &
Optoelectronics Conference (IMOC), 1–5.
Bosch, M. E., Jes´us, A., S´anchez, R., Rojas, F. S., and
Ojeda, C. B. (2007). Recent development in optical
fiber biosensors. Sensors, 7:797–859.
Ferri, S., Kojima, K., and Sode, K. (2011). Review of
glucose oxidases and glucose dehydrogenases: a bird’s
eye view of glucose sensing enzymes. Diabetes Science
and Technology, 5(5):1068–1076.
Fielding, A. J. and Davis, C. C. (2002). Tapered single-
mode optical fiber evanescent coupling. IEEE
Photonics Technology Letters, 14(1):53–55. G.
Guo, Z. J., Boyter, C., Cohoon, G., Salik, E., and Lin, W.-
J. (2011). Detection of botulinum neurotoxin by tapered
fiber optic biosensor. GSTF Journal of BioSciences
1(1):36–42.
Haddock, H. S., Shankar, P. M., and Mutharasan, R. (2003).
Fabrication of biconical tapered optical fibers using
hydrofluoric acid. Materials Science and Engineering
B: Solid-State Materials for Advanced Technology.
Karapetyan, K. (2012). Single optical modal
interferometer. PhD thesis.
Khan, A. Y., Noronha, S. B., and Bandyopadhyaya, R.
(2014). Glucose oxidase enzyme immobilized porous
silica for improved performance of a glucose biosensor.
Biochemical Engineering Journal, 91:78–85.
Klonoff, D. C. (2012). Overview of fluorescence glucose
sensing: f Technology with a bright future. Journal of
Diabetes Science and Technology, 6(6):1242–1250.
Ko, S., Lee, J., Koo, J., Joo, B. S., Gu, M., and Lee, J. H.
(2016). Chemical wet etching of an optical fiber using
a hydrogen fluoride-free solution for a saturable
absorber based on the evanescent field interaction.
Journal of Lightwave Technology, 34(16):3776–3784.
Leung, A., Shankar, P. M., and Mutharasan, R. (2008a).
Label-free detection of DNA hybridization using gold-
coated tapered fiber optic biosensors (TFOBS) in a flow
cell at 1310 nm and 1550 nm. Elsevier, 131:640–645.
Leung, A., Shankar, P. M., and Mutharasan, R. (2008b).
Model protein detection using antibody-immobilized
tapered fiber optic biosensors (TFOBS) in a flow cell at
1310 nm and 1550 nm. Sensors and Actuators, B:
Chemical, 129(2):716–725.
Liébana S, and Drago G.A. (2016). Bioconjugation and
stabilisation of biomolecules in biosensors. Essays in
Biochemistry, 60(1):59–68.
Kenny, R. P., Birks, T. A, and Oakley, K. P. (1991). Control
of optical fibre taper shape. Electronics Letters, 27.
Polynkin, P., Polynkin, A., Peyghambarian, N., and
Mansuripur, M. (2005). Evanescent field-based optical
fiber sensing device for measuring the refractive index
of liquids in microfluidic channels. Optics Letters,
30(11):1273–1275.
Qiang, Z., Junyang, L., Yanling, Y., Libo, G., and
Chenyang, X. (2014). Micro double tapered optical
fiber sensors based on the evanescent field-effect and
surface modification. Optik, 125(17):4614–4617.
Qiu, H. W., Xu, S. C., Jiang, S. Z., Li, Z., Chen, P. X., Gao,
S. S., Zhang, C., and Feng, D. J. (2015). Applied surface
science a novel graphene-based tapered optical fiber
sensor for glucose detection. Elsevier, 329:390–395.
Ruan, Y., Foo, T. C., Warren-Smith, S., Hoffmann, P.,
Moore, R. C., Ebendorff-Heidepriem, H., and Monro,
T. M. (2008). Antibody immobilization within glass
microstructured fibers: a route to sensitive and selective
biosensors. Optics Express, 16(22):18514–18523.
Salceda-Delgado, G., Monzon-Hernandez, D., Martinez-
Rios, a., Cardenas-Sevilla, G. a., and Villatoro, J.
(2012). Optical microfiber mode interferometer for
temperature-independent refractometric sensing.
Optics Letters, 37(11):1974.
Shi, J., Xiao, S., Yi, L., and Bi, M. (2012). A sensitivity-
enhanced refractive index sensor using a single-mode
thin-core fiber incorporating an abrupt taper. Sensors,
12(4), 4697–4705.
World Health Organization (2016). Diabetes Global
Report. Technical report.
Yadav, T. K., Narayanaswamy, R., Abu Bakar, M. H.,
Kamil, Y. M., and Mahdi, M. A. (2014). Single mode
tapered fiber-optic interferometer based refractive
index sensor and its application to protein sensing.
Optics Express, 22(19):22802.
Zibaii, M. I., Latifi, H., Karami, M., Gholami, M., Hosseini,
S. M., and Ghezelayagh, M. H. (2010). Non-adiabatic
tapered optical fiber sensor for measuring the
interaction between a-amino acids in aqueous
carbohydrate solution. Measurement Science and
Technology, 21(10):105801.
Tapered Fibre Optic Biosensor (TFOBS) by Optically Controlled Etching for Label-Free Glucose Concentration Monitoring - Biomedical
Optics
173
