
Multispectral 3D Surface Scanning System RoScan and its Application in
Inflammation Monitoring and Quantification
Adam Chromy
1,2
1
Department of Control and Instrumentation, Faculty of Electrical Engineering and Communications,
Brno University of Technology, Technicka 3082/12, 616 00 Brno, Czech Republic
2
Central European Institute of Technology, Brno University of Technology,
Purkynova 656/123, 612 00 Brno, Czech Republic
Keywords:
Multispectral Imaging, 3D Body Scanning, Thermal Imaging, Inflammation Monitoring, Inflammation
Quantification, Treatment Evaluation.
Abstract:
This paper presents experimental multispectral 3D surface scanning system RoScan, which is capable of cap-
turing 3D models of a surface, containing a spatial representation of the object, colour of each point of the
surface, its temperature and roughness. Such models are provided with accuracy up to ±0.12 mm and thermal
resolution of 0.05
◦
C, what makes it suitable for 3D thermal body scanning in medicine. Basic principles,
parameters, and functional capabilities are discussed, and developed tools for data analysis are presented. The
RoScan system is suitable for early detection of inflamed regions and its objective quantification. It can be
also used for evaluation of treatment suitability or for monitoring during a recovery process. To show this,
the case study monitoring of inflammation related to eczema caused by an allergic reaction is presented. The
inflammation development is studied using RoScan during eczema growth and after the application of two dif-
ferent external dermatologics – Protopic
R
0.1% topical ointment and ointment from shea butter and coconut
oil. On this particular subject, measured characteristics demonstrated a stronger effect of Protopic
R
0.1% on
eczema healing, as the evolution of inflammation in the area treated with this dermatologics started to recover
earlier and culminated on the lower value of temperature gradient then the second ointment.
1 INTRODUCTION
During last years, availability of thermal imagers
moved from expensive and bulky systems to afford-
able and practical solutions (Coffey, 2012). Develop-
ment of sensors and filters reaches such advances that
thermal cameras can be found already in smartphones
in the price range of up to 700 EUR (Hardwicke et al.,
2016). Even greater progress is evident in 3D scan-
ning market, where a bundle of new 3D scanning de-
vices is announced each year. Both technologies, al-
though they are mainly applied in engineering, has
capabilities, which can be useful as well in medicine.
Almost every injury, many diseases or pathologi-
cal changes are characterized by increased blood flow
and stronger cellular metabolic rate in the affected re-
gion, what causes the local increase of temperature
(Chang et al., 2008). Such local thermal deviations
can be detected and visualized by thermal cameras,
working in the long-wave infrared spectrum (LWIR).
Digital Medical Thermal Imaging (DMTI) is used in
many medical applications nowadays, especially in
inflamed tissue analysis (Hilton-Jones, 2003; Ring
and Ammer, 2012) and cancer detection (Lu and Fei,
2014).
But all current DMTI solutions suffer from a sig-
nificant drawback: although the 2D thermal imaging
is able to quantify the temperature of the individual
pixels of the image, the DMTI is still considered a
mere qualitative tool, enabling us to distinguish be-
tween the physiological and non-physiological states
of the body but lacking the ability to quantify them
(Vardasca and Simoes, 2013; Ju et al., 2005). This is
due to three main drawbacks of DMTI: almost impos-
sible definition of region of interest (ROI) in thermal
image due to lack of recognizable clearly bounded
thermal features in the image; distortions caused by
transforming 3D world to 2D representation (imag-
ine the floor plan of skyscraper – you know the co-
ordinates inside the building but you do not know the
floor); and dependence of the thermogram on the view
of the camera.
106
Chromy, A.
Multispectral 3D Surface Scanning System RoScan and its Application in Inflammation Monitoring and Quantification.
DOI: 10.5220/0006557601060113
In Proceedings of the 11th International Joint Conference on Biomedical Engineering Systems and Technologies (BIOSTEC 2018) - Volume 2: BIOIMAGING, pages 106-113
ISBN: 978-989-758-278-3
Copyright © 2018 by SCITEPRESS – Science and Technology Publications, Lda. All rights reserved
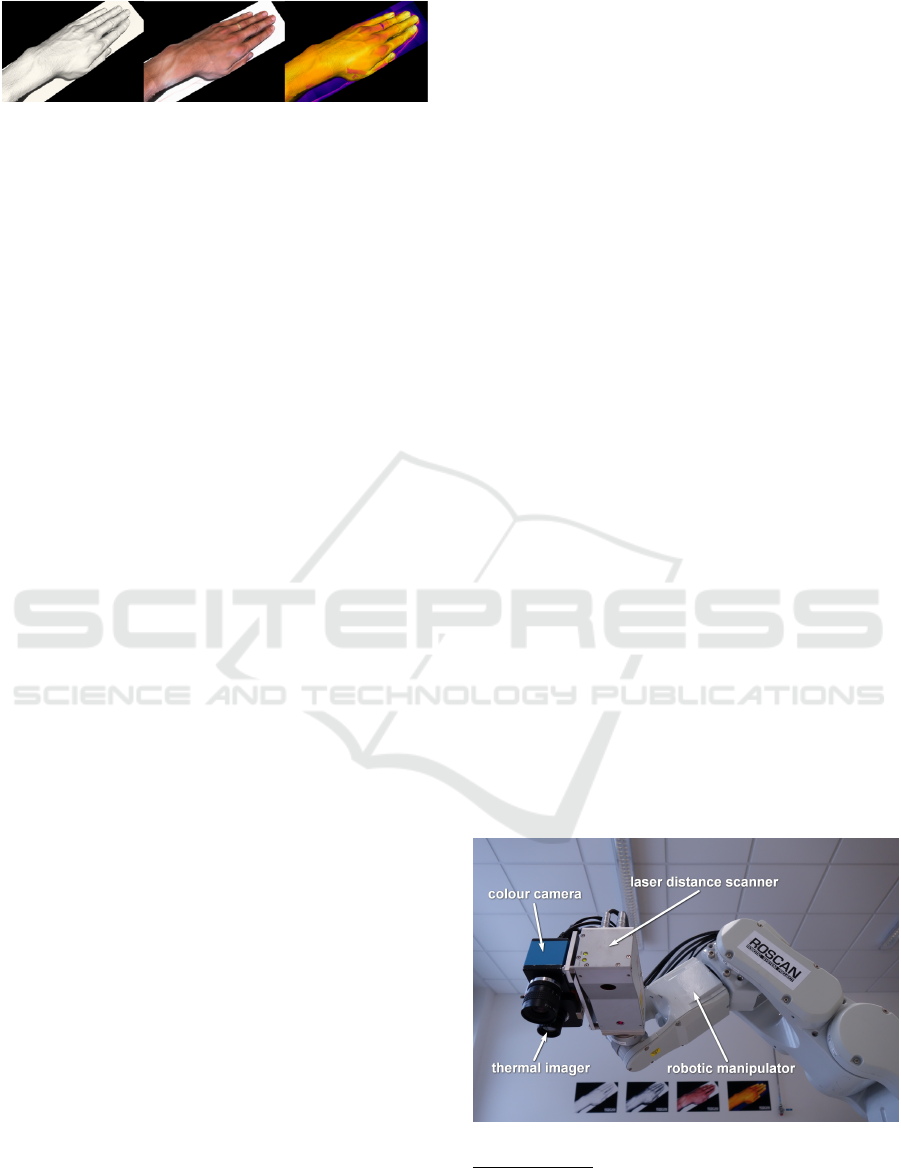
Figure 1: Scanned model contains information from spatial
(left), visible (middle) and LWIR spectrum (right).
The medical quantification itself is a general long-
term problem that permeates across the entire health-
care system and that is still not reliably solved.
This paper presents multispectral 3D scanning
system RoScan dealing with these current drawbacks
of DMTI by data fusion of 3D body scans with colour
images and thermal images. This combination of sen-
sors provides 3D surface scans covered with colour
and thermal information in high resolution (Fig. 1),
what enables thermal medical quantification. Thanks
to the colour layer, the ROI can be precisely selected,
the 3D model enables undistorted measurements, and
thermal layer exposes non-physiological areas and
provides quantifiable index reflecting the severity of
a disease.
In the following text, the abilities of RoScan are
outlined and the case study of monitoring inflamma-
tion related to eczema caused by an allergic reaction
is presented. The inflammation development is stud-
ied using RoScan during eczema growth and after the
application of two different external dermatologics.
Such studies are currently evaluated by methods
that are based on different scoring systems (Necas,
2011). Individual scoring systems have different pos-
itive or negative features, but they have one thing in
common - they are extremely subjective, coarse and
insensitive (Sprikkelman et al., 1997). As a result
of this, it is impossible to quantify the immediate
response of the human body immediately after drug
administration. The scoring systems only reflect the
long-term effect of drugs, and even if it is really sig-
nificant (Lacarrubba et al., 2015).
As shown in the further text, proposed multispec-
tral 3D scanning system RoScan enables the possibil-
ity of objective monitoring of fast temporal changes
in the treated skin. Quantification of dermatitis by
RoScan brings also higher sensitivity and selectivity
compared to the current state of the art, as well as
availability of more other quantitative parameters dur-
ing the evaluation.
2 ROSCAN SCANNING SYSTEM
Because the RoScan, a multispectral scanning system
using this sensor combination, brings a novel concept
in medical imaging, an extra section of this paper was
devoted to introduce basic principles of this method
and, in particular, to present its capabilities. From
this information the reader can get an idea in which
another research projects this method can be helpful.
Design of RoScan is built on the basis of Robotic
3D scanner (Chromy and Zalud, 2014a), which is
composed of high-accurate 2D profile laser scanner
mounted on end-point of 6-axis industrial robotic ma-
nipulator. The robot used in this device is EPSON
C3, which is reaching accuracy of end-point place-
ment ∆
M
= ±0.013 mm (Epson Robots, 2011) and the
laser scanner is MicroEpsilon ScanCONTROL2750-
100 with accuracy ∆
S
= ±0.027 mm (Micro-Epsilon,
2008).
Sensoric head of this robotic 3D scanning system
has been extended by LWIR thermal camera Xenics
GOBI1954 and colour camera ImagingSource DFK
51BG02.H (Fig. 2).
The thermal imager has resolution 384 × 288 pix-
els, pixel pitch 25 µm and spectral response of wave-
length range 8 − 14 µm with the thermal resolution
of 50 mK (Xenics, 2009). Colour camera Imaging-
Source DFK 51BG02.H has resolution 1600 × 1200
pixels and is supplied with 1/1.8
00
Sony CCD chip.
According to (Chromy and Zalud, 2014b), overall
spatial accuracy
1
of entire RoScan scanning system is
∆
Xmax
= ±0.12 mm and repeatability of thermal mea-
surements is 0.05
◦
C.
2.1 Capturing 3D Surface Models
Capturing of 3D surface model spatial data is based
on moving with the sensoric head around the scanned
object by the robotic manipulator and along prede-
Figure 2: RoScan overview with focus on sensoric head.
1
Term accuracy in this context can be defined as max-
imal distance between computed (measured) position of
point relative to true position of point at 99.7 % of mea-
surements (±3σ)
Multispectral 3D Surface Scanning System RoScan and its Application in Inflammation Monitoring and Quantification
107
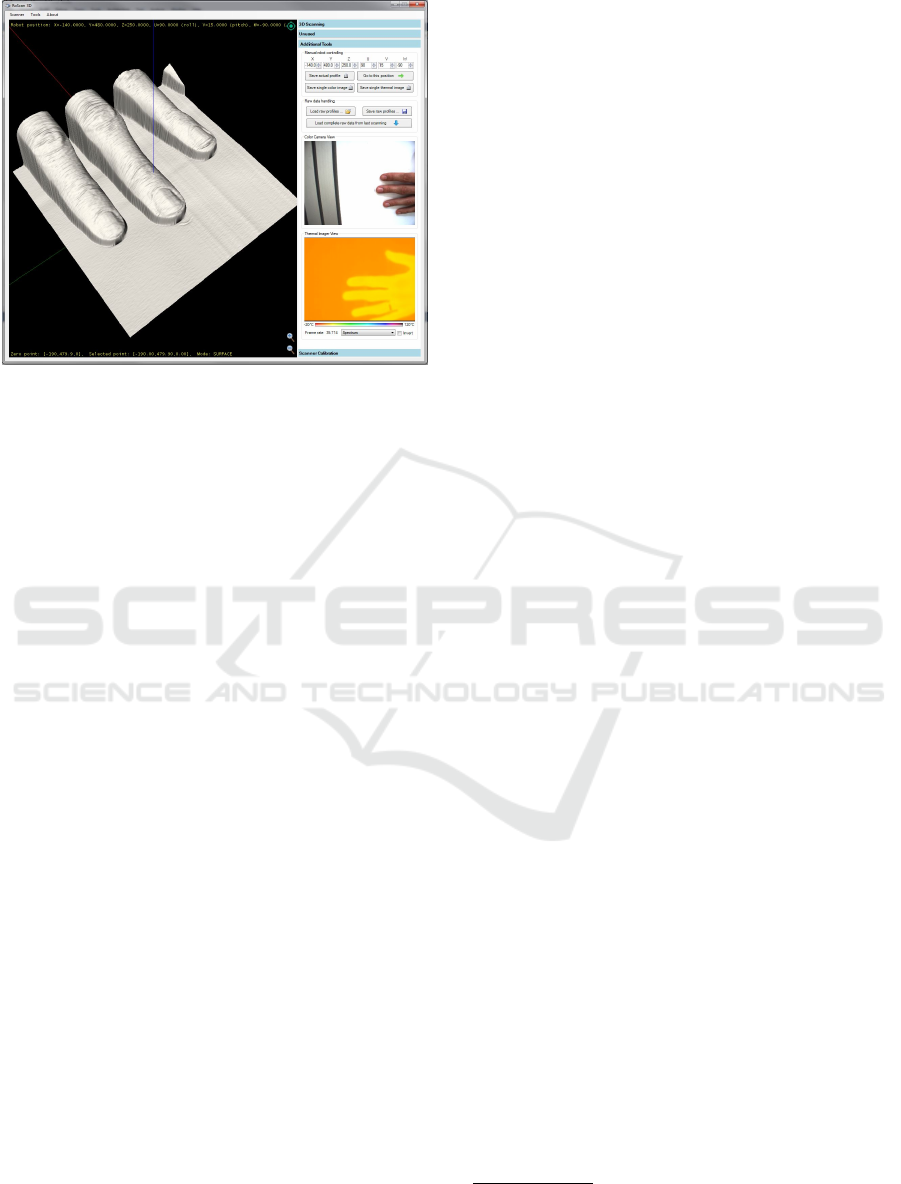
Figure 3: Software for capturing multispectral 3D surface
models during process of scanning.
fined scanning trajectory. Using robotic manipula-
tor empowers both flexibility of movement and high-
accuracy of captured data, what is usually compro-
mise between these parameters at commercially avail-
able scanners (Curless, 1999).
At each point of scanning trajectory, the laser
scanner measures a distance to the scanned object
along measuring line and generates output in form of
2D distance profile. Each captured profile is then fur-
ther transformed to the world coordinates and linked
with neighbouring data into single mesh structure.
This entire process, as well as required transforming
equations, is deeply described in (Chromy and Zalud,
2014a).
The software, developed for this system, allows
definition of custom trajectories composed from geo-
metric primitives using the simple scripting language.
Such trajectories can be then easily launched for scan-
ning (Fig. 3).
2.2 Mapping 2D Images onto Surface
During the scanning process, data from the colour
camera and thermal imager are collected, and after
building the 3D model mesh, they are projected onto
the 3D surface. At this point, the ray-tracing algo-
rithm (Suffern, 2016) is used, which examine visibil-
ity of each point of mesh from the camera. If the sin-
gle point is visible from several images, the result-
ing temperature is given as average of values from
these images. The colour in such multi-imaged points
is given as linear interpolation between colours from
these images, weighted by the angle relative to 3D
surface normal, since the lightness of colour is influ-
enced by the angle of light reflection.
Since the ray-tracing examination of point visibil-
ity is computationally demanding issue, the algorithm
uses Octree data structure (Kunii, 2012; Burian et al.,
2014), which divide the area of the 3D model into spa-
tial cubes, in which the parts of the mesh are classified
into.
This entire texture mapping process is more
deeply described in (Chromy and Klima, 2017).
2.3 Mutual Calibration of Sensors
For proper mapping of thermal and colour 2D images
onto 3D surface model, it is necessary to know very
precisely the intrinsic parameters of camera, as well
as its 6-DOF position
2
, from which the image has
been captured. This position is computed from the
position of sensoric head and the position of camera
relative to the sensoric head.
In order to estimate these parameters, we use the
calibration method based on capturing images of cal-
ibration pattern from several angles and further com-
paring of evaluated extrinsic parameters with the lo-
cation given by robotic manipulator. The pattern is
made from PCB with the heated copper layer, which
is visible on all sensors simultaneously. Calibrating
cameras using this method will ensure that the images
fit exactly at the right place on the 3D surface.
This method is described in (Chromy, 2017) with
more details.
2.4 3D Model Analysis
An important part of RoScan scanning system is soft-
ware tool for displaying and analyzing scanned im-
ages (Fig. 4). It provides functionality not only to
browse through 3D models but also for various mea-
surements of spatial properties of selected regions.
It also supports export to standardized formats (e.g.
PLY or PTS) for further processing of captured data
in other 3D software tools.
It allows showing the scans in 4 different modes:
• Colour – Basic view as clinician can see the pa-
tient. This layer is mostly used for finding the
visible landmarks, which are used for orientation
(pigmented spots, markers drawn on skin, etc.).
Such points can be highlighted to be visible also
in other layers.
• Temperature – The layer with false colours re-
lated to the temperature of skin. The value or par-
ticular point can be examined by clicking. Slid-
2
6-DOF position means 3 coordinates for camera posi-
tion and 3 coordinates of rotation, defining the direction of
camera view.
BIOIMAGING 2018 - 5th International Conference on Bioimaging
108
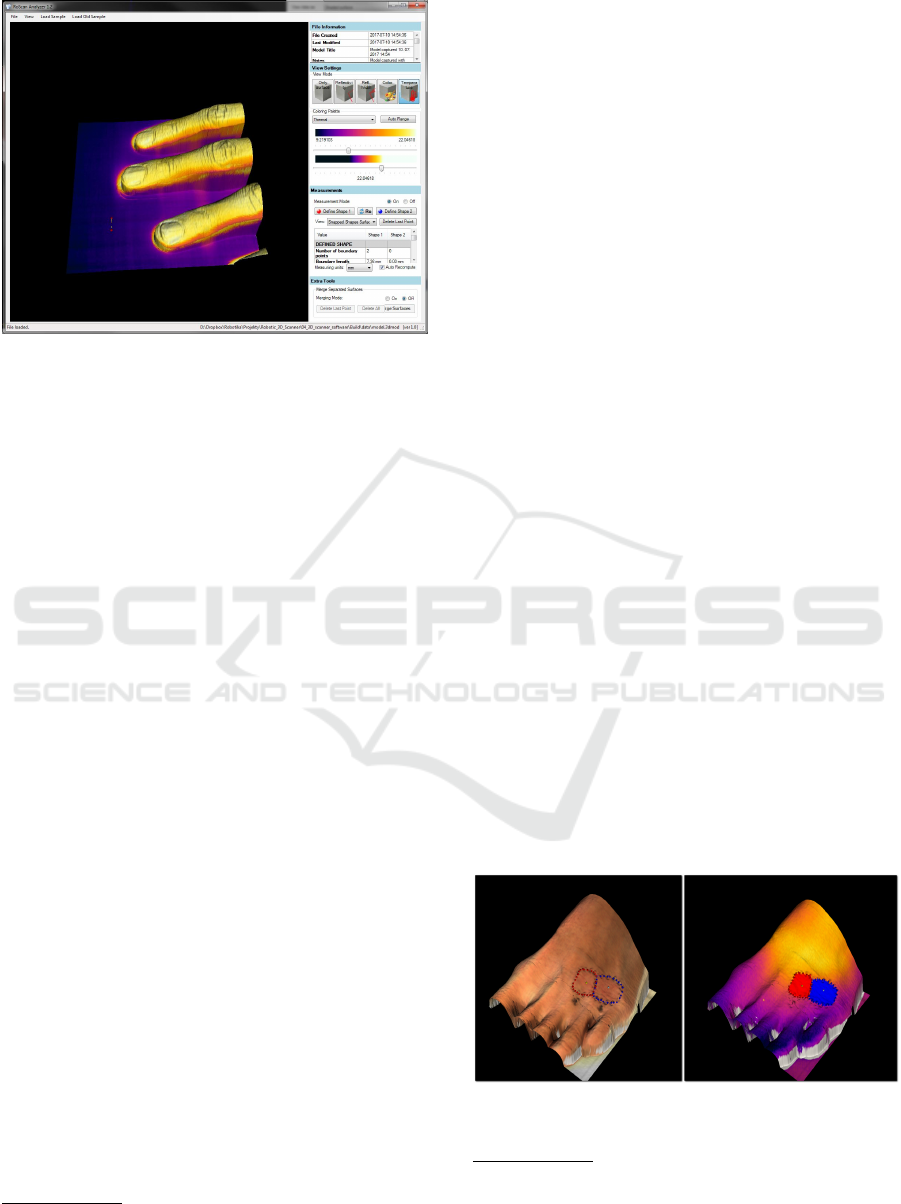
Figure 4: Software for displaying and analyzing multispec-
tral 3D surface scans.
ers can be used to adjust colour-temperature map-
ping in order to see better the contrast between
inflamed and healthy tissue.
• Roughness – Since we use the laser scanner
working on triangulation principle (Smith and
Zheng, 1998), besides position of reflected beam
3
,
a divergence of reflected beam is also mea-
sured. This value corresponds to roughness of the
scanned surface and can be also visualized with
false colours.
• Surface Only – Sometimes it is important to see
tiny details of the surface (like edges of the scars
or boundaries of chronic wound), which are nor-
mally hidden in colors. In such cases, only the 3D
surface can be displayed, without any coloring.
On each layer, the measurements tool can be acti-
vated. Following parameters can be evaluated in se-
lected points or regions of interest (ROI):
• Distances [mm] – between defined points (di-
rectly, along the surface), circumferences of ROI.
• Angles [deg] – angle between three defined points
(e.g. vertebrae positions).
• Surface area [mm
2
] – of entire model or ROI.
• Volume [mm
2
] – of entire model or ROI defined
by cutting plane or deflected cutting surface.
• Color – of selected point or average color of ROI.
• Roughness – provides dimensionless index cor-
responding to roughness of selected point or aver-
age roughness of ROI.
• Temperature [
◦
C] – of selected point or average
temperature of ROI.
3
At triangulation laser scanner, the position of reflected
beam of detector defines the measured distance
Since the system is completely developed by au-
thor from the scratch, it can be easily adapted to any
other application, within or outside of medical sector.
3 MATERIALS AND METHODS
The case study has been performed on subject suffer-
ing with the allergy on hazel allergens. The experi-
ment began when itchy and red lesions appeared on
the superior side of the left forefoot, few hours af-
ter ingestion of small amount of allergic substance.
The area of the lesion had been highlighted by mark-
ers drawn on the skin and was divided into two parts,
marked as V and K (Fig. 6).
During the first stage of the experiment, the sub-
ject was repeatedly scanned
4
using RoScan during
50 minutes period. After that, Protopic
R
0.1% topical
ointment was applied to the area K and ointment from
shea butter and coconut oil was applied to the area V .
During the second stage, the subject was once
again repeatedly scanned using RoScan for following
31 hours. In first minutes, when a reaction to der-
matologics was expected, the spacing between mea-
surements was 2-3 minutes, then approx. 15 minutes
and then about 45 minutes. Most of the measure-
ments were taken during first 4 hours when subject
was present in the laboratory. At following 27 hours,
only 3 measurements were taken due to unavailability
of the subject to come for measurements.
When processing the results, the areas K and V
were selected on each thermal 3D scan using the
colour layer of the 3D surface model, where mark-
ings drawn on the skin of the subject are visible (Fig.
5). Average temperature and selected surface area of
each region were then computed
5
. The area of se-
lected ROI serves as controlling value since it shall
Figure 5: Selection of areas on color layer (left) and aver-
aging of temperature on thermal layer (right).
4
Exact time of scanning has been saved and used for
further evaluation.
5
Both values are directly provided by RoScan software
tool
Multispectral 3D Surface Scanning System RoScan and its Application in Inflammation Monitoring and Quantification
109
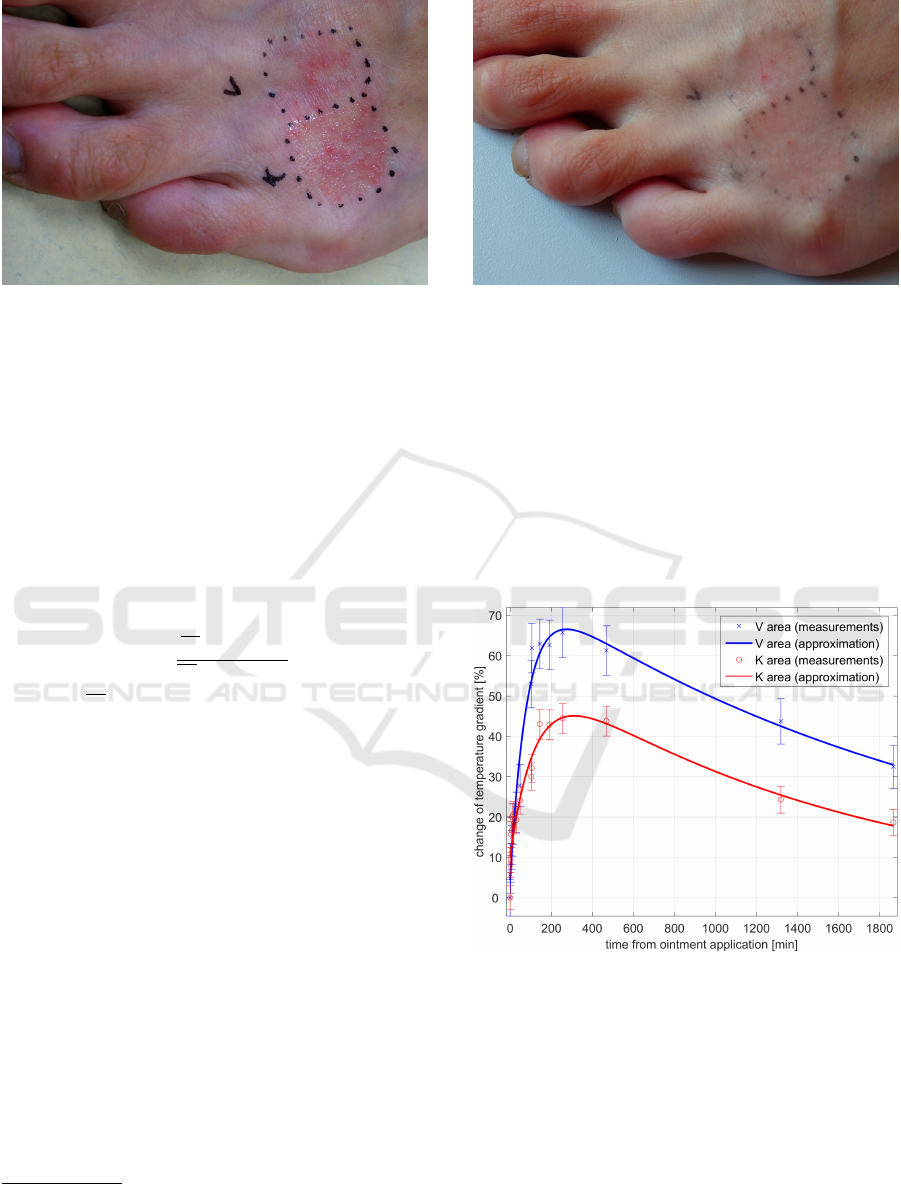
Figure 6: Affected area immediately after dermatologics
application.
stay unchanged at all samples, even if captured from
slightly different positions. The average temperature
was used as the quantitative parameter.
Because surface temperature of forefoot depends
also on physical activity or ambient heating, reference
temperature was measured on each scan. As a refer-
ence point, the area of letter V marked on the skin was
used. We are assuming, that external influences affect
the entire surface equally.
For quantification of inflammation in affected
area, following metric has been applied:
δ
A
(t) =
T
A
(t) − T
R
(t)
T
A
(0) − T
R
(0)
− 1 (1)
where T
A
(t) is average temperature of points be-
longing to the area A in time t, T
R
(t) is reference
temperature in time t. In this context, the mean-
ing of δ
A
(t) is relative change of difference between
area temperature and reference temperature, relative
to the time and state when dermatologics were ap-
plied
6
. Such relative metric had been chosen due to
the unequal distance of both areas from the edge of
the body, what causes differences in absolute values
of a temperature. This approach normalizes both val-
ues to the same scaled index and makes both areas to
be comparable between each other.
Uncertainties of measurements were evaluated ac-
cording to (Palencar et al., 2001) as the standard un-
certainty of indirect measurement, where all 4 values
influencing the results are measured with the same un-
certainty of ∆ = 0.05
◦
C. Particular uncertainties are
shown as error bars in following figures 8 - 10.
Note: Be aware, that purpose of this experiment
is not to evaluate treatment efficiency of both derma-
tologics, but to show that RoScan is able to quantify
6
e.g. δ
A
(1min) = 10% means that during first 10 min-
utes after application, the gradient of area temperature rela-
tive to the ref. point has grown by 10%
Figure 7: Affected area 31 hours after dermatologics appli-
cation.
the inflammation and that is sufficiently sensitive for
monitoring of inflammation progress. The results of
this study bring information only about the reaction
of this particular subject to both dermatologics and
cannot be generalized to the human population.
4 EXPERIMENTAL RESULTS
Figure 8: Development of δ(t) during 31 hours after appli-
cation of ointments.
Development of δ
K
(t) and δ
V
(t) during 31 hours after
the application of ointments is shown in Fig. 8.
The temperature gradient in the area treated by
Protopic
R
0.1% culminated at 45% gradient relatively
to starting state. The area treated by ointment from
shea butter and coconut oil culminated at 65%. From
point of culmination, both areas are healing with a
similar trend.
Both areas were similarly progressing before ap-
plication of drugs, as shown in Fig. 9. Note, that
BIOIMAGING 2018 - 5th International Conference on Bioimaging
110
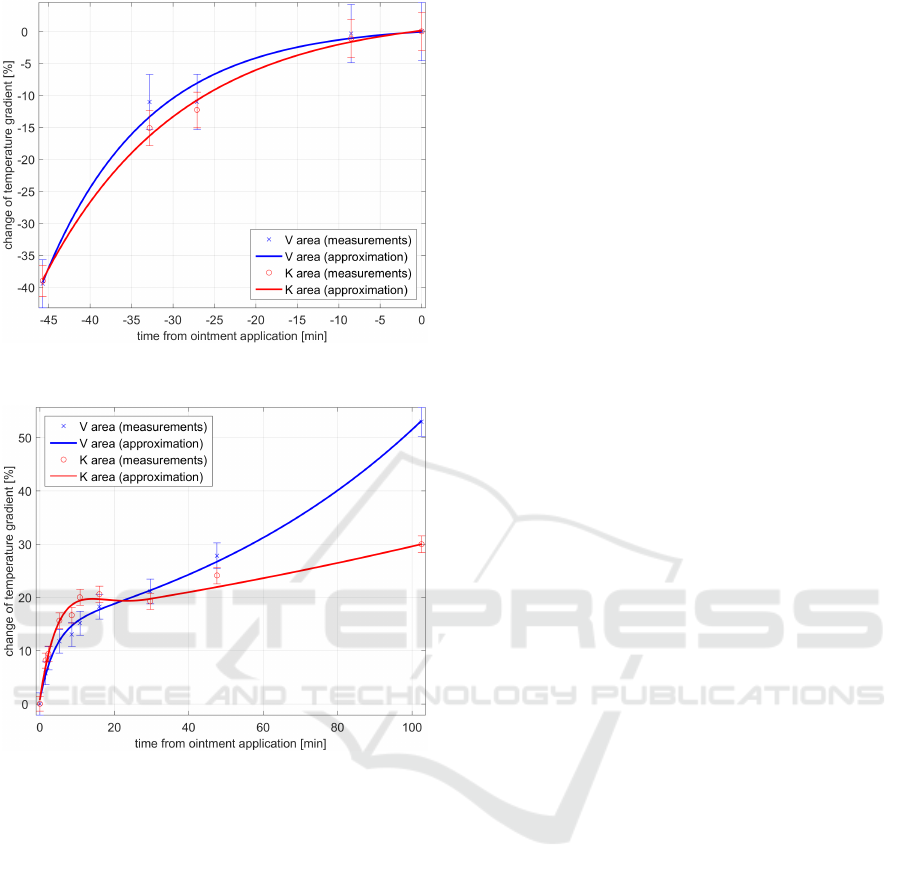
Figure 9: Development of δ(t) before application of oint-
ments.
Figure 10: Detail of δ(t) characteristics in first 100 minutes
after application of ointments.
there is no significant difference between the thermal
progress of both areas until application of ointments.
After that, the characteristics become different.
On Fig. 10, there is a detail of first 100 minutes af-
ter application, which is not visible in full scale. The
temperature of area K is growing faster than in area
V , but after 10 minutes stops to grow and after that,
the increase during the time is significantly slower.
5 DISCUSSION
Both areas are evolving in a similar way before appli-
cation of dermatologics (Fig. 9), what might rebut the
assumption, that both areas are affected by differently
advanced inflammation and that both areas would be
then evolving differently even if not treated. For fur-
ther considerations, we assume that both areas
are afflicted with inflammation of same severity, also
because of the same symptoms (same redness, rash,
and itching).
The active substance of Protopic
R
0.1% is
Tacrolimus (Lazarous and Kerdel, 2002), the topical
calcineurin inhibitor (TCI) working by weakening the
skin’s defense (immune) system, thereby decreasing
the allergic reaction and relieving the eczema (Baldo
et al., 2009). Since atopic dermatitis is skin inflam-
mation (Nedorost, 2012), which is partially caused by
immunologic factors (Grey and Maguiness, 2016), its
development should be reduced by dosing this drug.
On the contrary, the ointment from shea butter
and coconut oil has no similar active substance and
acts only as moisturizer (Tollefson et al., 2014), so
it should serve only for prevention from cracked skin
(Varothai et al., 2013).
This is in consensus with our observation from
Fig. 8, where Protopic
R
0.1% has a stronger effect
on stopping the development of eczema than ointment
from shea butter and coconut oil.
According to subject’s feelings, 2 minutes after
application of ointments, the area K started to be
strongly burning. This feeling culminated at 7 min-
utes and at 12 minutes burning and itching in the area
K fully stopped. Itching in the area V stays at the
same level during this period. The surface of area K
also became sticky and oozing, as shown in Fig. 11.
This report correlates with response of inflamma-
tion development in first minutes after drug applica-
tion (Fig.10), where the K area is initially more in-
flamed then V , but then inflammation decrease speed
of development more than in area V . The burning
after an application is the well known side effect of
Protopic
R
0.1% (Lazarous and Kerdel, 2002), but its
cause is not known. Anyway, it is recognizable on
time evolution of 3D thermogram.
6 CONCLUSIONS
The presented paper introduced and evaluated capa-
bilities of novel imaging technique for inflammation
detection and monitoring. But the 3D + thermal +
colour data fusion technology is not limited only to
this domain – it can be used also in field robotics (Ne-
jdl et al., 2015), autonomous mapping (Zalud et al.,
2015) or in augmented reality (Zalud, 2006)
RoScan, the experimental equipment using this
technology, is designed to producing multispectral 3D
models of the body surface.
The main purpose of RoScan is being able to
quantify inflammatory processes inside the human
body. This inflamed region should be close to the
Multispectral 3D Surface Scanning System RoScan and its Application in Inflammation Monitoring and Quantification
111
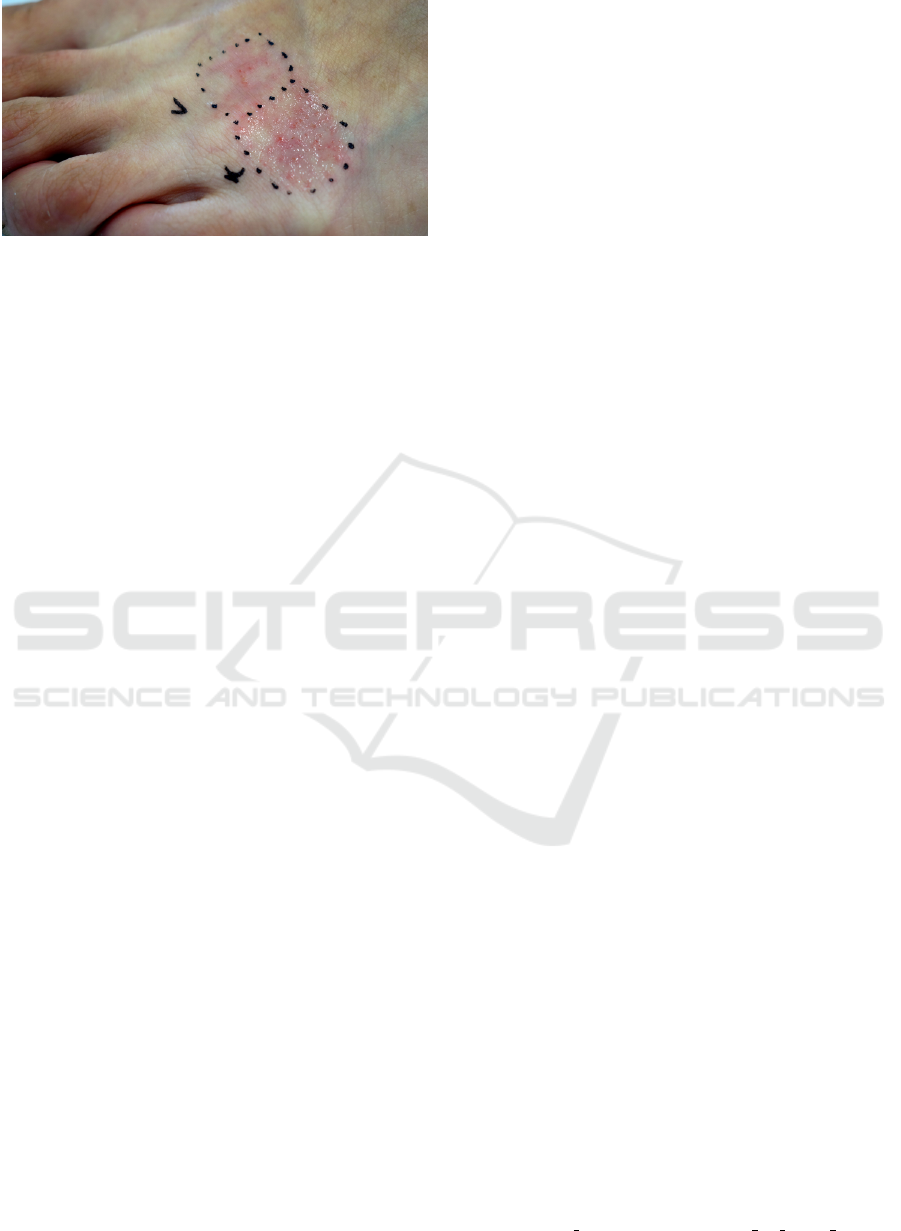
Figure 11: Oozing surface of area K after application of
Protopic
R
0.1%.
skin, or sufficiently ”strong” to be able to influence
even the skin temperature. Case study above shown,
that using RoScan for quantifying inflammation is
possible.
RoScan can be useful also for early detection of
inflamed areas since its sensitivity is higher than com-
monly used methods, which are mostly based on vi-
sual observations (Lipsky et al., 2004; Krysko et al.,
2008). Looking at differences between Fig. 6 and Fig.
7, it is clear, that RoScan brings more evidence-based
diagnostic data, which are normally invisible. This
was also shown in the presented case study.
Multispectral 3D scanning can be useful even if
the symptoms are visible. The ability to preserve the
exact condition of the patient’s body (for comparison
during the next visit at the clinician) brings the possi-
bility to objectively evaluate the progress of a disease,
even if changes are very small.
Extending 3D model with thermal information can
also help in assessing if spatial changes of a body are
caused by physiological (e.g. muscle growth) or non-
physiological factors (e.g. edema).
On the other hand, this technology has also many
limitations, when most important one is inhomo-
geneity of temperature distribution along body sur-
face. The areas of higher temperature can result not
only from inflammations but can be caused also by
anatomical constitutions, e.g. when arteries come
closer to the skin. In such areas, small inner in-
flammations can stay unrecognised (false negative) or
the area itself can be detected as inflammation (false
positive). Interpretation of 3D surface thermogram
will still depend on experiences of a clinician, but it
will help him to quantify the problem, what common
methods can not.
ACKNOWLEDGEMENTS
This work was supported by grant No. FEKT/FIT-J-
17-4745 ”Intermodal 3D data registration in health-
care” financed from Internal Science Fund of Brno
University of Technology; by grant No. 692470,
H2020, ECSEL-04-2015-Smart Health, ”Advancing
Smart Optical Imaging and Sensing for Health (AS-
TONISH)”; and by grant No. FEKT-S-17-4234 ”In-
dustry 4.0 in automation and cybernetics” financed
from Internal Science Fund of Brno University of
Technology.
REFERENCES
Baldo, A., Cafiero, M., Di Caterino, P., and Di Costanzo,
L. (2009). Tacrolimus ointment in the management
of atopic dermatitis. Clinical, cosmetic and investiga-
tional dermatology : CCID, 2:1–7. PMID: 21436963
PMCID: PMC3047924.
Burian, F., Kocmanova, P., and Zalud, L. (2014). Robot
mapping with range camera, CCD cameras and ther-
mal imagers. 2014 19th International Conference
on Methods and Models in Automation and Robotics
(mmar), pages 200–205. WOS:000352788900035.
Chang, T., Hsiao, Y., and Liao, S. (2008). Application
of digital infrared thermal imaging in determining in-
flammatory state and follow-up effect of methylpred-
nisolone pulse therapy in patients with graves ophthal-
mopathy. Graefe’s Archive for Clinical and Experi-
mental Ophthalmology, 246(1):45–49.
Chromy, A. (2017). Mutual calibration of sensors for mul-
tispectral 3D scanning of surface. In The 9th Inter-
national Congress on Ultra Modern Telecommunica-
tions and Control Systems, Munich. In Press.
Chromy, A. and Klima, O. (2017). A 3D scan model and
thermal image data fusion algorithms for 3D thermog-
raphy in medicine. Journal of Healthcare Engineer-
ing. In press.
Chromy, A. and Zalud, L. (2014a). Novel 3D modelling
system capturing objects with Sub-Millimetre resolu-
tion. Advances in Electrical and Electronic Engineer-
ing, 12(5):476–487.
Chromy, A. and Zalud, L. (2014b). Robotic 3D scanner as
an alternative to standard modalities of medical imag-
ing. SpringerPlus, 3(1):13.
Coffey, V. C. (2012). Multispectral imaging moves into the
mainstream. Optics and Photonics News, 23(4):18–
24.
Curless, B. (1999). From range scans to 3D models. SIG-
GRAPH Comput. Graph., 33(4):3841.
Epson Robots (2011). Epson c3 compact 6-Axis
RobotManual. http://robots.epson.com/admin/uploads
/product catalog /files/EPSON C3 Robot Man-
ual(R7).pdf.
BIOIMAGING 2018 - 5th International Conference on Bioimaging
112

Grey, K. and Maguiness, S. (2016). Atopic dermatitis: Up-
date for pediatricians. Pediatric Annals, 45(8):e280–
286. PMID: 27517355.
Hardwicke, J. T., Osmani, O., and Skillman, J. M.
(2016). Detection of perforators using smartphone
thermal imaging. Plastic and Reconstructive Surgery,
137(1):39–41. PMID: 26710006.
Hilton-Jones, D. (2003). Diagnosis and treatment of inflam-
matory muscle diseases. Journal of Neurology, Neu-
rosurgery & Psychiatry, 74(suppl 2):ii25–ii31. PMID:
12754326.
Ju, X., Nebel, J., and Siebert, J. P. (2005). 3D thermogra-
phy imaging standardization technique for inflamma-
tion diagnosis. In Gong, H., Cai, Y., and Chatard, J.,
editors, Proceedings Volume 5640, Infrared Compo-
nents and Their Applications, page 266.
Krysko, D. V., Vanden Berghe, T., D’Herde, K., and Van-
denabeele, P. (2008). Apoptosis and necrosis: detec-
tion, discrimination and phagocytosis. Methods (San
Diego, Calif.), 44(3):205–221. PMID: 18314051.
Kunii, T. L. (2012). Frontiers in Computer Graphics: Pro-
ceedings of Computer Graphics Tokyo 84. Springer
Science & Business Media. Google-Books-ID: YYyr-
CAAAQBAJ.
Lacarrubba, F., Pellacani, G., Gurgone, S., Verz, A. E., and
Micali, G. (2015). Advances in non-invasive tech-
niques as aids to the diagnosis and monitoring of ther-
apeutic response in plaque psoriasis: a review. Inter-
national Journal of Dermatology, 54(6):626–634.
Lazarous, M. C. and Kerdel, F. A. (2002). Topical
tacrolimus protopic. Drugs of Today (Barcelona,
Spain: 1998), 38(1):7–15. PMID: 12532181.
Lipsky, B. A., Berendt, A. R., Deery, H. G., Embil, J. M.,
Joseph, W. S., Karchmer, A. W., LeFrock, J. L., Lew,
D. P., Mader, J. T., Norden, C., and Tan, J. S. (2004).
Diagnosis and treatment of diabetic foot infections.
Clinical Infectious Diseases, 39(7):885–910. PMID:
15472838.
Lu, G. and Fei, B. (2014). Medical hyperspectral imaging: a
review. Journal of Biomedical Optics, 19(1):010901–
010901.
Micro-Epsilon (2008). Instruction manual scanCONTROL.
http://www.micro-epsilon.cz/download/manuals/man–
scanCONTROL-2700–en.pdf.
Necas, M. (2011). Atopicky ekzem. Ceska dermatoven-
erologie, 1(2):8–20.
Nedorost, S. (2012). Generalized dermatitis in clinical
practice. Springer, Dordrecht.
Nejdl, L., Kudr, J., Ruttkay-Nedecky, B., Heger, Z., Zima,
L., Zalud, L., Krizkova, S., Adam, V., Vaculovicova,
M., and Kizek, R. (2015). Remote-Controlled robotic
platform for electrochemical determination of water
contaminated by heavy metal ions. International Jour-
nal of Electrochemical Science, 10(4):3635–3643.
WOS:000352222500069.
Palencar, R., Vdolecek, F., and Halaj, M. (2001). Nejis-
toty v mereni ii: nejistoty primych mereni. Automa,
2001(10):55–56.
Ring, E. F. J. and Ammer, K. (2012). Infrared thermal
imaging in medicine. Physiological Measurement,
33(3):R33.
Smith, K. B. and Zheng, Y. F. (1998). Accuracy analysis
of point laser triangulation probes using simulation.
Journal of Manufacturing Science and Engineering,
120(4):736–745.
Sprikkelman, A. B., Tupker, R. A., Burgerhof, H.,
Schouten, J. P., Brand, P. L., Heymans, H. S., and van
Aalderen, W. M. (1997). Severity scoring of atopic
dermatitis: a comparison of three scoring systems. Al-
lergy, 52(9):944–949. PMID: 9298180.
Suffern, K. (2016). Ray Tracing from the Ground Up. CRC
Press. Google-Books-ID: RDYCwAAQBAJ.
Tollefson, M. M., Bruckner, A. L., and Section On Der-
matology (2014). Atopic dermatitis: skin-directed
management. Pediatrics, 134(6):e1735–1744. PMID:
25422009.
Vardasca, R. and Simoes, R. (2013). Current issues in med-
ical thermography. In Topics in Medical Image Pro-
cessing and Computational Vision, Lecture Notes in
Computational Vision and Biomechanics, pages 223–
237. Springer, Dordrecht. DOI: 10.1007/978-94-007-
0726-9 12.
Varothai, S., Nitayavardhana, S., and Kulthanan, K. (2013).
Moisturizers for patients with atopic dermatitis. Asian
Pacific Journal of Allergy and Immunology, 31(2):91–
98. PMID: 23859407.
Xenics (2009). Xenics GOBI 1954 reference manual.
Zalud, L. (2006). ARGOS - system for heterogeneous mo-
bile robot teleoperation. In 2006 IEEE/RSJ Interna-
tional Conference on Intelligent Robots and Systems,
IROS 2006, pages 211–216, Beijing; China.
Zalud, L., Kocmanova, P., Burian, F., Jilek, T., Kalvoda, P.,
and Kopecny, L. (2015). Calibration and evaluation of
parameters in a 3D proximity rotating scanner. Elek-
tronika ir Elektrotechnika, 21(1):3–12.
Multispectral 3D Surface Scanning System RoScan and its Application in Inflammation Monitoring and Quantification
113
