
Predicting Hospital Safety Measures using Patient Experience of Care
Responses
Michael A. Pratt
1
and Henry Chu
2
1
William Hansen Hall Department of Electrical and Computer Engineering, University of Louisiana at Lafayette, U.S.A.
2
School of Computing and Informatics, University of Louisiana at Lafayette, U.S.A.
Keywords:
Predictive Analytics, Health System Analytics, Classifiers, Support Vector Machine, Random Forest.
Abstract:
To make healthcare more cost effective, the current trend in the U.S. is towards a hospital value-based pur-
chasing program. In this program, a hospital’s performance is measured in the safety, patient experience of
care, clinical care, and efficiency and cost reduction domains. We investigate the efficacy of predicting the
safety measures using the patient experience of care measures. We compare four classifiers in the prediction
tasks and concluded that random forest and support vector machine provided the best performance.
1 INTRODUCTION
Healthcare cost in the U.S. continues to rise while the
outcomes often lag those in other developed coun-
tries. The Hospital Value-Based Purchasing (VBP)
Program is a U.S. governmental initiative that rewards
hospitals for the quality of care they provide to bene-
ficiaries (Centers for Medicare & Medicaid Services,
2015). A hospital’s performance is assessed based
on an approved set of measures, grouped into spe-
cific quality domains. In 2018, the domains are (i)
Safety, (ii) Patient Experience of Care, (iii) Clinical
Care, and (iv) Efficiency and Cost Reduction. These
domains are each weighted 25%.
In the Safety domain, the majority of the measures
are on Healthcare Associated Infections (HAI). A
Healthcare Associated Infection is an infection clas-
sified as such if the patient is considered to not have it
prior to entering a healthcare facility for treatment of
some other problem (Safdar and Abad, 2008)(Valles
et al., 2008). HAI is a leading cause of death in
the U.S. and it leads to both additional medical costs
(Zimlichman et al., 2013) and often longer stays in
a hospital. Certain population groups, such as low
birthweight infants, are more vulnerable to HAI (Gef-
fers et al., 2008).
The U.S. Center for Disease Control and Preven-
tion tracks data for such HAI as blood stream in-
fections, cathetar-associated urinary tract infections,
surgical-site infections from certain procedures, and
intestinal infections. A prevalence survey in 2011 re-
vealed that 4% of patients had one or more HAI. The
most common types were penumonia, surgical-site
infections, and gastrointestinal infections. Device-
associated infections accounted for over 25% of
infections while Clostridium difficile caused 12%
(Magill et al., 2014). A 2012 survey across Europe
conducted by the European Centre for Disease Pre-
vention and Control reported that 7.1% of the sur-
veyed patients had an HAI (Zarb et al., 2012). Im-
plementing existing preventive procedures can reduce
certain HAI occurrences by up to 70% (Scott, 2009).
Another domain of the performance measure is
in the patient experience of care. The patients ex-
press their experience through responses to the Hos-
pital Consumer Assessment of Healthcare Providers
and Systems (HCAHPS) survey (Centers for Medi-
care & Medicaid Services, 2014). Patients are ran-
domly sampled during a reporting period after dis-
charge. Responses to a total of twenty two questions
are organized into six composite topics, two individ-
ual items, and two global items, for a total of ten
items. Generally, patients rate a topic or item as posi-
tive, neutral, or negative.
Measures in these two domains account for 50%
of a hospital’s performance assessment. One might
conjecture that a hospital that scores well with pa-
tients’ experience would also do well with adhering
to protocols, hence reducing HAI incidents. A ques-
tion that arises is whether there is redundant informa-
tion between these. Previous work (Pratt and Chu,
2016) has shown that the positive patient experience
responses can predict that the hospital has better than
average HAI performance. Our interest is therefore to
Pratt, M. and Chu, H.
Predicting Hospital Safety Measures using Patient Experience of Care Responses.
DOI: 10.5220/0006588403710378
In Proceedings of the 7th International Conference on Pattern Recognition Applications and Methods (ICPRAM 2018), pages 371-378
ISBN: 978-989-758-276-9
Copyright © 2018 by SCITEPRESS – Science and Technology Publications, Lda. All rights reserved
371

more comprehensively validate whether we can pre-
dict for each hospital its safety measures from the pa-
tients’ experience in care measures. Specifically, we
want to predict, using the safety measures, whether a
hospital’s HAI performance is (i) above the national
benchmark (vs no different from or worse than the
benchmark), or (ii) below the national benchmark (vs
no different from or better than the benchmark).
The variable to be predicted is a hospital’s HAI
performance, which can be measured by, e.g., count-
ing the number of occurrences. The Standardized In-
fection Ratio (SIR) is used by the CDC to facilitate
fair comparisons between hospitals. The national SIR
is the ratio of the total number of observed infections
to the number of predicted infections. The national
SIR benchmark is set at 1.0. The SIR is adjusted for
risk factors that are most associated with differences
in infection rates (Office of Disease Prevention and
Health Promotion, 2014).
The rest of the paper is organized as follows. In
Section 2, we describe the data sets from HCAHPS
surveys and the data sets on HAI. In Section 3, we
present our prediction methods and experimental re-
sults in predicting HAI performance from HCAHPS
responses. In Section 4, we draw our concluding re-
marks.
2 METHOD
We use data obtained from the U.S. Medicare.gov
(https://data.medicare.gov/data/hospital-compare).
HCAHPS responses are provided by 4,028 hospitals;
each response vector is mapped to a hospital by
a provider ID. HCAHPS counts the responses by
patients who reported
1. that their room and bathroom were clean;
2. that their nurses communicated well;
3. that their doctors communicated well;
4. that they received help as soon as they wanted;
5. that their pain was well controlled
6. that staff explained about medicines before giving
it to them;
7. that they were given information about what to do
during their recovery at home;
8. that the area around their room was quiet at night;
9. they would recommend the hospital.
Each of these questions can have a positive, a neutral,
or a negative response. Additionally, they also tally
10. patients who gave their hospital a rating on a scale
from 0 (lowest) to 10 (highest).
Statistics of the positive feedback input features de-
rived from HCAHPS responses from all 4,028 hospi-
tals can be found (Pratt and Chu, 2016).
Each group of responses are counted as percent-
ages, so that for instance in Group (1), there may be
p
1
% who responded “Always,” n
1
% who responded
“Sometimes” or “Never,” and (100 − p
1
− n
1
)% who
responded “Usually.” We use the ith positive feed-
back response (viz. “Always,” “Yes,” or ratings of 9
or 10) as the ith “positive” input, x
i
, for i = 1, ··· ,10.
For instance, the input corresponding to Group (1) is
x
1
= p
1
/100. Since they are percentages, x
i
is be-
tween 0 and 1. The positive feedback input values
tend to have high values, with the means ranging from
0.64 to 0.85. We also use the negative feedback re-
sponses, viz. “Sometimes” or “Never” or “No” or rat-
ings of 6 or lower. For instance, the negative input
corresponding to Group (1) is y
1
= n
1
/100. The neg-
ative feedback input values tend to have low values,
with the means ranging from 0.04 to 0.18.
Obviously x
i
+ y
i
≤ 1 for all i. We study the pre-
diction problem using only x
i
values, only y
i
values,
and both x
i
and y
i
values (twenty input values).
In the Safety domain, HAI performance measures
are reported from hospitals for six infections, as fol-
lows:
1. Central line-associated blood stream infections
(CLABSI),
2. Catheter-Associated Urinary Tract Infections
(CAUTI),
3. Surgical Site Infection from colon surgery (SSI:
Colon),
4. Surgical Site Infection from abdominal hysterec-
tomy (SSI: Hysterectomy),
5. Methicillin-resistant Staphylococcus Aureus
(MRSA) Blood Laboratory-identified Events
(Bloodstream infections),
6. Clostridium difficile (C.diff.) Laboratory-
identified Events (Intestinal infections).
For each measure, the SIR score is compared with the
lower and upper confidence limits, and a label of “bet-
ter than,” or “no different than,” or “worse than” the
U.S. national benchmark is assigned to each hospital.
Some measures are not available for some hospitals,
so that the number of scores for each infection may
differ.
We use four classifiers for prediction:
1. Naive Bayes
2. Random forest
3. Artificial feedforward neural networks
4. Support vector machine
ICPRAM 2018 - 7th International Conference on Pattern Recognition Applications and Methods
372

The random forest classifier (Breiman, 2001) is
based on an ensemble of K classification trees. Sup-
pose the training set T has N samples. The training
set for each tree is formed by drawing N samples with
replacement from T . At each node, a subset of the in-
put variables is randomly picked for splitting. After
training, an input vector is presented to all K trees.
The majority among the K decisions is the overall de-
cision of the random forest classifier. The parameter
of the random forest is K, the number of trees in the
ensemble.
An artificial feedforward neural network has neu-
rons organized as three layers, viz. the input, the
hidden, and the output layers. Each neuron forms a
weighted sum of the inputs and a bias. The sum is
then passed through a nonlinearity, typically a tanh
function, to form the intput to the next layer or as the
output. Training is performed using the entire training
set T through the backpropagation algorithm. The pa-
rameter of the neural network is the number of neu-
rons in the hidden layer.
The Naive Bayes classifier uses a maximum a pos-
teriori rule, with the assumption that the input vari-
ables are independent, so that the joint class density is
the product of individual class densities. The training
set is used to estimate the individual class densities.
The support vector machine (Cortes and Vapnik,
1995) finds a separating hyperplane between the two
classes by balancing the classification error, weighted
by a cost term C, and the complexity of the hyper-
plane. To solve non-separable cases, the input vec-
tors are mapped to a higher dimensional space, often
via a kernel function such as a radial basis function
parameterized by γ, which controls the spread of the
function.
3 EXPERIMENTAL RESULTS
We have a set of 10 positive feedback features X =
{x
i
: i = 1,·· · ,10} and a set of 10 negative feedback
features Y = {y
i
: i = 1,··· ,10}. We have two pre-
diction problems: (i) to predict a hospital that is “bet-
ter” than the national benchmark; and (ii) to predict a
hospital that is “worse” than the national benchmark.
Using different combinations of input, there can be 6
experiments:
0. Use X to predict “better” hospitals;
1. Use Y to predict “better” hospitals;
2. Use X ∪Y to predict “better” hospitals;
3. Use X to predict “worse” hospitals;
4. Use Y to predict “worse” hospitals;
5. Use X ∪Y to predict “better” hospitals.
For each prediction task, corresponding to the six in-
fections we assemble six data sets, each with ten or
twenty input features and one target output. We use
the hospital ID to match the input HCAHPS response
vector with the target derived from the HAI perfor-
mance label. For each of the experiments, we use the
same protocol as follows. Each input feature is cen-
tered around 0 and scaled to have unit variance. Our
goal is to predict, for a hospital, whether it is better (or
worse) than the U.S. benchmark given the 10 (or 20)
HCAHPS-derived input features. We assign the target
value “+1” when the hospital has a label “better than
U.S. national benchmark” and the target value “−1”
otherwise when predicting a “better” hospital. Simi-
larly, we assign the target value “+1” when the hospi-
tal has a label “worse than U.S. national benchmark”
and the target value “−1” otherwise when predicting
a “worse” hospital. A hospital with a label “similar to
the U.S. national benchmark” will therefore have the
target value “−1” in both cases.
Experiment (0) was previously reported in (Pratt
and Chu, 2016) and the results are not repeated here.
We describe our results for experiments (1) through
(5) in the following. We partition the data set using
75% for training and 25% for test. From the train-
ing set, we use 50% to tune the classifier parameters.
This smaller set is partitioned into 75% for training
and 25% for test to obtain the best set of parameters.
The parameter for the neural network is the number of
hidden units. We use the radial basis function in the
support vector machine. The parameters for it are the
cost parameter and γ of the radial basis function. We
note that when we use 20 input variables, some larger
classifiers such as a neural network with 17 hidden
units or a random forest with 875 trees are deployed.
The prediction accuracies for each classifier for
each infection for the five experiments are shown in
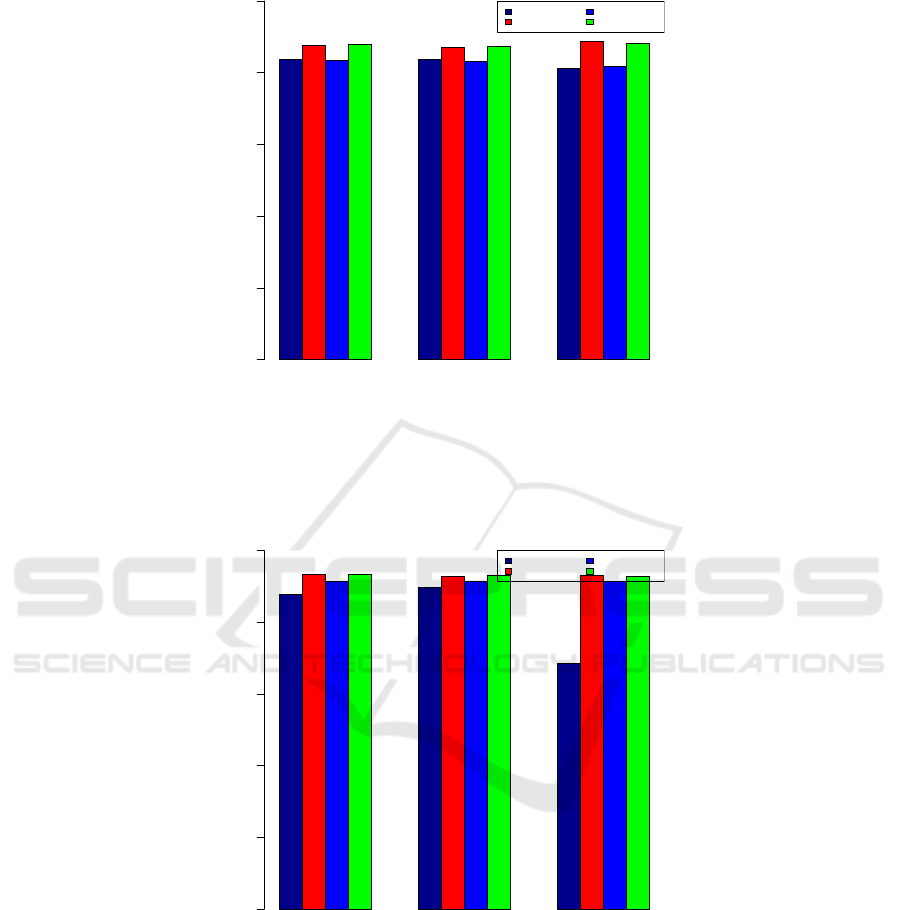
Tables 1, 2, 3, 4, and 5. We show the bar plots of the
accuracies of two cases, both for predicting whether
a hospital is worse than the U.S. national benchmark.
We show the results for CAUTI, which has somewhat
balanced “better” and “worse” counts, in Fig. 1. In
Fig. 2, we show the results for C.diff, which has al-
most twice as many We show a third case, this time for
predicting whether a hospital is better than the U.S.
national benchmark when the HAI is CAUTI. Com-
paring Fig. 1 and Fig. 3, we see that while the accura-
cies are comparable, those for predicting a better hos-
pital are better for this infection. The performances of
the four classifiers relative to each other are consistent
for the two predictions.
We can see that the smallest data set (viz. “SSI:
Hysterectomy”) has the highest prediction accuracies
Predicting Hospital Safety Measures using Patient Experience of Care Responses
373
Positive Negative Both
Accuracy
input
0.0 0.2 0.4 0.6 0.8 1.0
Naive Bayes
Random Forest
ANN
SVM
Figure 1: Accuracy of predicting whether a hospital is worse than the U.S. national benchmark. The performance is for the
CAUTI healthcare associated infection, as predicted by the Naive Bayes, the Random Forest, the Artificial Neural Network,
and the Support Vector Machine classifiers using positive response inputs only, negative inputs response only, and both positive
and negative inputs.
Positive Negative Both
Accuracy
input
0.0 0.2 0.4 0.6 0.8 1.0
Naive Bayes
Random Forest
ANN
SVM
Figure 2: Accuracy of predicting whether a hospital is worse than the U.S. national benchmark. The performance is for the
C.diff healthcare associated infection, as predicted by the Naive Bayes, the Random Forest, the Artificial Neural Network, and
the Support Vector Machine classifiers using positive response inputs only, negative inputs response only, and both positive
and negative inputs.
for all classifiers. The second smallest data set (viz.
MRSA) while having twice the size of “SSI: Hys-
terectomy” has the second highest prediction accura-
cies, again across all classifiers. The sets “CLABI,”,
“CAUTI,” and “MRSA” have comparable sizes but
“CLABI” has noticeably poor prediction accuracies
when using positive feedback input X . When negative
feedback input Y is used, the results for “CLABI” and
“C.diff” improved. When both input sets are used, the
accuracies do not improve appreciably.
More complex classifiers (such as with more hidden
units in a neural network or more trees in a random
ICPRAM 2018 - 7th International Conference on Pattern Recognition Applications and Methods
374

Positive Negative Both
Accuracy
input
0.0 0.2 0.4 0.6 0.8 1.0
Naive Bayes
Random Forest
ANN
SVM
Figure 3: Accuracy of predicting whether a hospital is better than the U.S. national benchmark. The performance is for the
CAUTI healthcare associated infection, as predicted by the Naive Bayes, the Random Forest, the Artificial Neural Network,
and the Support Vector Machine classifiers using positive response inputs only, negative inputs response only, and both positive
and negative inputs.
Table 1: Prediction accuracies using the negative inputs to predict “better” hospitals.
Classifier
Data Set Naive Bayes Random Forest Neural Network Support Vector Machine
CLABI 0.5341 0.7478 0.6602 0.7846
CAUTI 0.8230 0.9213 0.8941 0.9213
SSI: Colon 0.9260 0.9415 0.9157 0.9312
SSI: Hysterectomy 0.9050 0.9864 0.9774 0.9819
MRSA 0.9641 0.9789 0.9577 0.9641
C.diff 0.7497 0.8733 0.8046 0.8648
Table 2: Prediction accuracies using the positive and negative inputs to predict “better” hospitals.
Classifier
Data Set Naive Bayes Random Forest Neural Network Support Vector Machine
CLABI 0.4746 0.7618 0.6778 0.7566
CAUTI 0.8290 0.9259 0.8880 0.9228
SSI: Colon 0.9243 0.9484 0.9140 0.9449
SSI: Hysterectomy 0.7557 0.9819 0.9774 0.9819
MRSA 0.6131 0.9746 0.9556 0.9725
C.diff 0.7254 0.8701 0.8004 0.8680
Table 3: Prediction accuracies using the positive inputs to predict “worse” hospitals.
Classifier
Data Set Naive Bayes Random Forest Neural Network Support Vector Machine
CLABI 0.9107 0.9912 0.9772 0.9895
CAUTI 0.8381 0.8759 0.8351 0.8790
SSI: Colon 0.9313 0.9570 0.9433 0.9570
SSI: Hysterectomy 0.8778 0.9548 0.9502 0.9548
MRSA 0.9089 0.9576 0.9513 0.9513
C.diff 0.8775 0.9324 0.9155 0.9324
Predicting Hospital Safety Measures using Patient Experience of Care Responses
375

Table 4: Prediction accuracies using the negative inputs to predict “worse” hospitals.
Classifier
Data Set Naive Bayes Random Forest Neural Network Support Vector Machine
CLABI 0.9072 0.9912 0.9737 0.9912
CAUTI 0.8381 0.8714 0.8306 0.8744
SSI: Colon 0.9192 0.9588 0.9433 0.9450
SSI: Hysterectomy 0.9050 0.9548 0.9548 0.9548
MRSA 0.8496 0.9597 0.9216 0.9555
C.diff 0.8986 0.9293 0.9155 0.9314
Table 5: Prediction accuracies using the positive and negative inputs to predict “worse” hospitals.
Classifier
Data Set Naive Bayes Random Forest Neural Network Support Vector Machine
CLABI 0.9054 0.9895 0.9842 0.9895
CAUTI 0.8124 0.8865 0.8185 0.8820
SSI: Colon 0.8780 0.9570 0.9192 0.9536
SSI: Hysterectomy 0.8778 0.9548 0.8824 0.9548
MRSA 0.8284 0.9576 0.9343 0.9555
C.diff 0.6864 0.9313 0.9155 0.9271
0.0 0.2 0.4 0.6 0.8 1.0
0.0 0.2 0.4 0.6 0.8 1.0
False Positive Rate
True Positive Rate
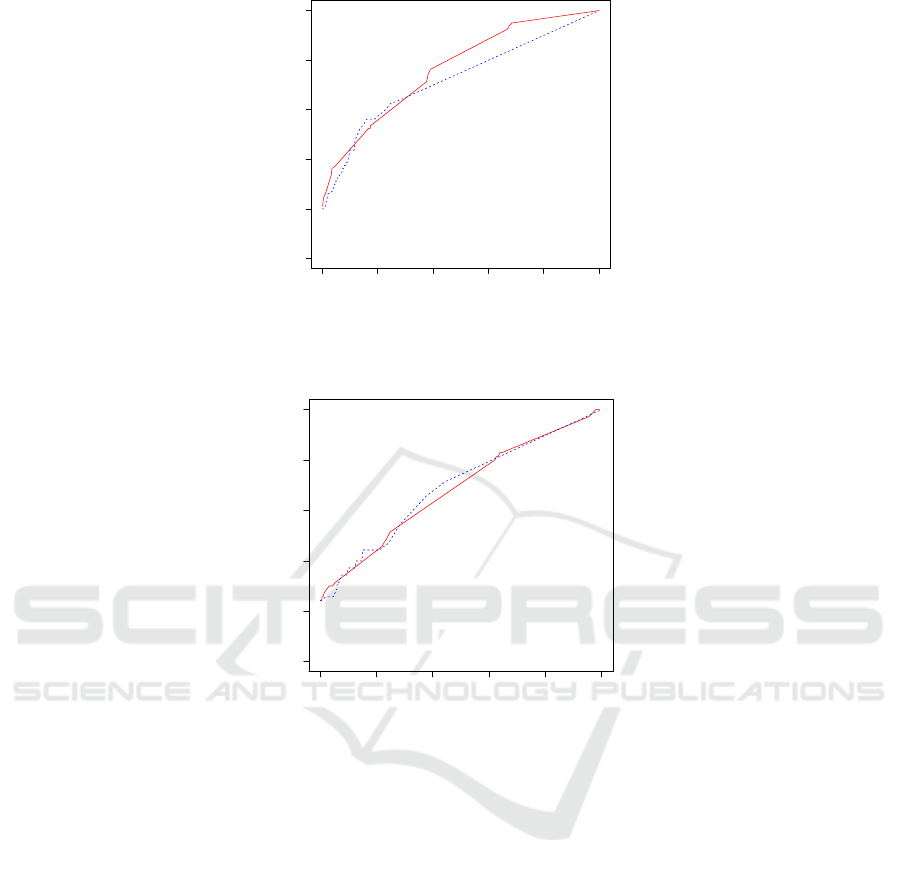
Figure 4: True positive rate vs false positive rate curve of predicting a hospital being worse than the national benchmark in
CAUTI healthcare associated infection performance using positive feedback responses by the Support Vector Machine (red)
and the Random Forest (blue dashed) classifiers.
forest) do not have better performance. Across all
data sets, the support vector machine and random for-
est classifiers have superior performances.
The receiver operating characteristic (ROC)
curves for the Random Forest and for the SVM in pre-
dicting a hospital’s performance using positive feed-
back responses for the three cases of figures 1, 2, and
3 are shown, respectively, in figures 4, 5, and 6. It
can be seen that the two classifiers have comparable
performances, with the Random Forest having a slight
advantage over the SVM. Both classifiers have better
performances in predicting when a hospital has worse
than the national benchmark performance than in pre-
dicting when a hospital has better than the national
benchmark performance in the case of CAUTI infec-
tion.
4 CONCLUDING REMARKS
Hospital performance measures is being used in
value-based purchasing so that hospitals are incen-
tivized to have improved performance, as measured
by safety, patient experience of care, clinical care, and
efficiency and cost reduction. Among these domains,
one might conjecture that safety and patient experi-
ence of care might have common factors.
In this work, we investigated the relationship of
the safety and the patient experience of care measures
by using the latter to predict the former. We showed
that it is possible to predict a hospital’s HAI perfor-
mance from patients’ experience response. We show
how to use positive feedback, negative feedback, and
both to predict whether a hospital is better than or
ICPRAM 2018 - 7th International Conference on Pattern Recognition Applications and Methods
376
0.0 0.2 0.4 0.6 0.8 1.0
0.0 0.2 0.4 0.6 0.8 1.0
False Positive Rate
True Positive Rate
Figure 5: True positive rate vs false positive rate curve of predicting a hospital being worse than the national benchmark in
C.diff healthcare associated infection performance using positive feedback responses by the Support Vector Machine (red)
and the Random Forest (blue dashed) classifiers.
0.0 0.2 0.4 0.6 0.8 1.0
0.0 0.2 0.4 0.6 0.8 1.0
False Positive Rate
True Positive Rate
Figure 6: True positive rate vs false positive rate curve of predicting a hospital being better than the national benchmark in
CAUTI healthcare associated infection performance using positive feedback responses by the Support Vector Machine (red)
and the Random Forest (blue dashed) classifiers.
worse than the national benchmark.
Ongoing work include involving other input fea-
tures to improve the prediction accuracy, while also
exploring the use of HCAHPS responses to predict
other hospital performance measures, such as read-
mission rates.
REFERENCES
Breiman, L. (2001). Random forests. Machine Learning,
45(1):5–32.
Centers for Medicare & Medicaid Services (2014).
HCAHPS: Patients’ perspectives of care survey.
https://www.cms.gov/Medicare/.
Centers for Medicare & Medicaid Services (2015). Hospital
value-based purchasing.
Cortes, C. and Vapnik, V. (1995). Support-vector networks.
Machine Learning, 20(3):273–297.
Geffers, C., Baerwolff, S., Schwab, F., and Gastmeier, P.
(2008). Incidence of healthcare-associated infections
in high-risk neonates: results from the german surveil-
lance system for very-low-birthweight infants. Jour-
nal of Hospital Infection, 68(3):214–221.
Magill, S., Edwards, J., Bamberg, W., Dumyati, Z., Kainer,
M., Lynfield, R., Maloney, M., McAllister-Hollod, L.,
Nadle, J., Ray, S., Thompson, D., Wilson, L., and
Fridkin, S. (2014). Multistate point-prevalence sur-
vey of health care-associated infections. New England
Journal of Medicine, 370(13):1198–1208.
Office of Disease Prevention and Health Promo-
tion (2014). Healthcare associated infec-
tions. http://www.healthypeople.gov/2020/topics-
objectives/topic/healthcare-associated-infections.
Pratt, M. and Chu, C. (2016). Predicting healthcare associ-
ated infections using patients’ experiences. In Sensing
and Analysis Technologies for Biomedical and Cogni-
tive Applications. SPIE.
Safdar, N. and Abad, C. (2008). Educational interven-
tions for prevention of healthcare-associated infec-
Predicting Hospital Safety Measures using Patient Experience of Care Responses
377

tion: a systematic review. Critical Care Medicine,
36(3):933–940.
Scott, R. (2009). The direct medical costs of healthcare-
associated infections in US hospitals and the benefits
of prevention.
Valles, J., Calbo, E., Anoro, E., Fontanals, D., Xercavins,
M., Espejo, E., Serrate, G., Freixas, N., Morera,
M., Font, B., Bella, F., Segura, F., and Garau, J.
(2008). Bloodstream infections in adults: Importance
of healthcare-associated infections. Journal of Infec-
tion, 56(1):27–34.
Zarb, P., Coignard, B., Griskeviciene, J., Muller, A.,
Vankerckhoven, V., Weist, K., Goossens, M., Vaeren-
berg, S., Hopkins, S., Catry, B., Monnet, D.,
Goossens, H., Suetens, C., National Contact Points
for the ECDC pilot point prevalence survey, and Hos-
pital Contact Points for the ECDC pilot point preva-
lence survey (2012). The European Centre for Disease
Prevention and Control (ECDC) pilot point prevalence
survey of healthcare-associated infections and antimi-
crobial use. Eurosurveillance, 17(46).
Zimlichman, E., Henderson, D., Tamir, O., Franz, C.,
Song, P., Yamin, C., Keohane, C., Denham, C., and
Bates, D. (2013). Health care-associated infections:
a meta-analysis of costs and financial impact on the
U.S. health care system. JAMA Internal Medicine,
173(22):2039–2046.
ICPRAM 2018 - 7th International Conference on Pattern Recognition Applications and Methods
378
