
Detecting Dutch Political Tweets:
A Classifier based on Voting System using Supervised Learning
Eric Fernandes de Mello Ara
´
ujo and Dave Ebbelaar
Behavioural Informatics Research Group, VU Amsterdam
De Boelelaan 1081, 1081HV Amsterdam, The Netherlands
Keywords:
Text Mining, Twitter, Politics, Dutch politics, Machine Learning, Natural Language Processing.
Abstract:
The task of classifying political tweets has been shown to be very difficult, with controversial results in many
works and with non-replicable methods. Most of the works with this goal use rule-based methods to identify
political tweets. We propose here two methods, being one rule-based approach, which has an accuracy of 62%,
and a supervised learning approach, which went up to 97% of accuracy in the task of distinguishing political
and non-political tweets in a corpus of 2.881 Dutch tweets. Here we show that for a data base of Dutch tweets,
we can outperform the rule-based method by combining many different supervised learning methods.
1 INTRODUCTION
Social media platforms became an excellent source
of information for researchers due to its richness in
data. Social scientists can derive many studies from
behavior in social media, from preferences regarding
brands, political orientation of mass media to voting
behavior (Golbeck and Hansen, 2014; Sylwester and
Purver, 2015; Asur and Huberman, 2010). Most of
these works rely in text mining techniques to interpret
the big amount of data which would mostly not be
processed manually in a feasible time.
One of the most used social media platforms for
text mining is Twitter, a microblogging service where
users post and interact with messages called “tweets”,
restricted to 140 characters. As of June 2017, about
500 million tweets are posted to Twitter every day
1
.
Twitter presents an API for collecting data, and many
works have been using it including for political anal-
ysis (Golbeck and Hansen, 2014; Rajadesingan and
Liu, 2014; Mohammad et al., 2015).
Natural language processing (NLP) is a computer
science method for processing and understanding nat-
ural language, mostly vocal or textual. Despite the
fact that NLP has been used for decades, process-
ing tweets has brought new challenges to this field.
The limited amount of information (limited number
of characters in each message) induces the users of
the Twitter platform to ignore punctuation, shorten
1
https://www.omnicoreagency.com/twitter-statistics/
longer words and creates abbreviations for common
used expressions, as FYI (for your information). Most
recently the increasing use of emojis (ideograms and
smileys used in the message) also raised new features
that NLP algorithms have to deal with.
Much works are currently combining NLP tech-
niques for twitter messages in order to assess informa-
tion about public political opinions, aiming mostly to
predict the results of elections or referendums. One of
the steps to develop a NLP system to classify tweets is
the filtering of tweets that concern politics from other
topics of discussion. Rule-based techniques like the
use of keywords to identify political tweets resulted
in 38% of the tweets being falsely classified in our
collected Dutch corpus. This is far from ideal and
therefore other classification methods should be eval-
uated.
We have used in this work a supervised learn-
ing approach for classification of the tweets in po-
litical or non-political, a machine learning technique
where a function is generated from labeled training
data. An algorithm analyzes a dataset and generates
an inferred function, which can be used to classify un-
seen instances. We aim to examine whether classify-
ing political content from Twitter using a supervised
learning approach outperforms a rule-based method,
leading to more accurate analyses of political content.
To construct the classifier, a corpus of 2.881 Dutch
tweets was first collected over a time period of two
months. The corpus was manually tagged using a
web application built for this project. Tweets were
462
Araújo, E. and Ebbelaar, D.
Detecting Dutch Political Tweets: A Classifier based on Voting System using Supervised Learning.
DOI: 10.5220/0006592004620469
In Proceedings of the 10th International Conference on Agents and Artificial Intelligence (ICAART 2018) - Volume 2, pages 462-469
ISBN: 978-989-758-275-2
Copyright © 2018 by SCITEPRESS – Science and Technology Publications, Lda. All rights reserved

then pre-processed and extra features were extracted
from metadata to optimize for classification. Various
machine learning algorithms were trained using the
tagged dataset and accuracies were compared to find
the right models. Eventually, the five best performing
models were combined to make a classifier that uses
a voting system.
The structure of this paper is as follows. Section
2 discusses related work. In Section 3 the method
for collecting, tagging and pre-processing data is ex-
plained, followed by the process of building the clas-
sifier and an explanation of the models in Section 4.
The results are shown in Section 5 followed by future
research and discussion in Section 6.
2 RELATED WORK
One of the earliest studies to use Twitter for political
analysis aims to predict the German federal elections
using data from Twitter, concluding that the num-
ber of messages mentioning a party reflects the elec-
tion result (Tumasjan et al., 2010). They collected
all tweets that contained the names of the six par-
ties represented in the German parliament or selected
prominent politicians related to these parties. With a
rule-based method to identify tweets as being politi-
cally relevant, they stated that the number of messages
mentioning a party reflects the election result.
A similar method of counting Twitter messages
mentioning political party names was applied to pre-
dict the 2011 Dutch Senate election (Sang and Bos,
2012). The results were contradictory with (Tumas-
jan et al., 2010), concluding that counting the tweets
that mention political parties is not sufficient to obtain
good election predictions.
(He et al., 2012) analyzed tweet messages leading
to the UK General Election 2010 to see whether they
reflect the actual political scenario. They have used
a rule-based method. A model was proposed incor-
porating side information from tweets, i.e. emoticons
and hashtags, that can indicate polarities. Their search
criteria included the mention of political parties, can-
didates, use of hashtags and certain words. Tweets
were then categorized as in relevance to different par-
ties if they contain keywords or hashtags. Their re-
sults show that activities on Twitter cannot be used to
predict the popularity of election parties.
A study from (Conover et al., 2011a) investigated
how social media shapes the networked public sphere
and facilitates communication between communities
with different political orientations. Two networks
of political communication on Twitter were examined
leading up to the 2010 U.S. congressional midterm
elections. A political communication was identified
as any tweet containing at least one politically rele-
vant hashtag. To identify an appropriate set of politi-
cal hashtags, a tag co-occurrence discovery procedure
was performed. They began by seeding the sample
with the two most popular political hashtags. For each
seed, they identified the set of hashtags with which it
co-occurred in at least one tweet and ranked the re-
sults. They stated that when the tweets in which both
seed and hashtag occur make up a large portion of the
tweets in which either occurs, the two are deemed to
be related. Using a similarity threshold they identi-
fied a set of unique hashtags. This method is more
advanced than the previously discussed methods but
lacks recall of political content. (Hong et al., 2011)
showed that only 11% of all tweets contain one or
more hashtags. While this study was conducted on
Twitter data in general and not just political content,
one can still assume that far from all political relevant
tweets contain a hashtag.
Several studies have also used Twitter data to pre-
dict the political orientation of users. Some with
great success where accuracies are reported over 90%
(Conover et al., 2011b; Liu and Ruths, 2013). How-
ever, (Cohen and Ruths, 2013) discovered that re-
ported accuracies have been systemically overopti-
mistic due to the way in which validation datasets
have been collected, reporting accuracy levels nearly
30% higher than can be expected in populations of
general Twitter users meaning that tweet classifiers
cannot be used to classify users outside the narrow
range of political orientation on which they were
trained.
(Maynard and Funk, 2011) used NLP advanced
techniques to classify tweets and their political orien-
tation without much success. They conclude that ma-
chine learning systems in annotated corpus of tweets
could improve their method.
As showed, most of the works aim to categorize
tweets regarding their political positioning without re-
moving those which follow their rule-based method
but do not have political content. We consider that
filtering the tweets with a very good accuracy tool
is a way of improving the results presented by pre-
vious works. If tweets can be classified as political or
not political before they pass through other processes,
better results can be obtained.
3 COLLECTING AND
PROCESSING THE TWEETS
This project consists of data collection, data cleaning,
tagging of the messages and finally the processing and
Detecting Dutch Political Tweets: A Classifier based on Voting System using Supervised Learning
463

Table 1: Keywords used to filter the tweets collected.
Party Leader
VVD Mark, Rutte
PVV Geert, Wilders
CDA Sybrand, Haersma, Buma
D66 Alexander, Pechtold
GL Jesse, Klaver
PvdA Lodewijk, Asscher
SP Emile, Roemer
CU Gert-Jan, Segers
PvdD Marianne, Thieme
50plus Henk, Krol
SGP Kees, Staaij
DENK Tunahan, Kuzu
FvD Thierry, Baudet
analysis of the results.
3.1 Collecting Data
To collect the tweets we have used the Twitter Stream-
ing API
2
. The API pushes data in real-time, and pro-
vides a search mechanism that can be based on key-
words, usernames, language or locations. The tweets
that match the criteria are pushed directly to the des-
tination defined in your code. The public stream can
push approximately 1% of all the Twitter data
3
. The
full stream of data can be accessed using the Twitter
Firehose but is fairly costly. For this work, a sample
of the data was sufficient enough to train a classifier
and therefore the Streaming API was used.
For the collection of the corpus, the abbreviations
of the Dutch political parties and the names of their
leaders were used as the set of keywords shown in Ta-
ble 1. Hashtags are not included because a hashtag
will only match the given hashtag and not the key-
word without the hashtag. For example ‘#Twitter‘
will only match tweets containing ‘#Twitter‘ whereas
using just ‘Twitter‘ will match ‘Twitter‘ and ‘#Twit-
ter‘. Therefore adding hashtags for parties or names
would be redundant. The first and last names of the
politicians were searched separately because it was
noticed that people rarely address Dutch politicians
by their full name in tweets. Besides the keywords,
a language filter was used to only push Dutch tweets.
Data was streamed in intervals over a time period of
two months to make sure the results were not influ-
enced by major events. After removing duplicates,
this resulted in a total of 2.881 tweets.
2
https://dev.twitter.com/streaming/overview
3
https://brightplanet.com/2013/06/twitter-firehose-vs-
twitter-api-whats-the-difference-and-why-should-you-care/
3.2 Cleaning the Data
The Twitter Streaming API returns the collected data
in a JSON format. We cleaned up the data by ex-
tracting the relevant features as username, text, ex-
panded url, extended text, retweeted status and re-
ply status. The utility of each feature will be ex-
plained in this section.
The collected corpus contained duplicate tweets.
In order to automatically remove duplicates from the
dataset, URLs had to be temporarily removed because
Twitter creates unique URLs for every tweet using
their t.co service which shortens URLs. After the re-
moval of duplicates, the URLs were placed back.
Because Twitter shortens the URLs, potential in-
formation gets lost, so the shortened URL was re-
placed by features extracted from the expanded url
feature which contains the original URL. This was
done by splitting up the URL using the Python url-
pase package. Special characters and Dutch stop
words were removed using the NLTK stop word cor-
pus
4
. An additional set of frequent URL words was
also removed containing words such as ‘www‘, ‘html‘
and ‘com‘. This way only relevant words would re-
main. An example of the feature extraction from an
URL is shown in Table 2.
Table 2: Feature extraction example.
URL https://t.co/C7fwW3eE5p
Features
extracted
fd, economie, politiek, asscher,
sluit, deal, soepeler, ontslagrecht
To further extract as much information as possi-
ble, retweets (tweets that are shared by another user)
had to be replaced with the original text because
sometimes the text of a retweet is truncated. Tweets
can also contain an extended text feature. When
this was the case, the text was replaced with the ex-
tended text feature. This method ensures that the full
text is displayed. Replies lack context and therefore
make accurate tagging hard or impossible. In order
to include replies, additional steps should be taken
to link replies to tweets. However, for this project,
replies were removed from the dataset. Finally, the
clean dataset was exported to a CSV file and passed
on to the tagging system.
3.3 Tagging the Tweets
In order to use supervised learning, the tweets had to
be manually tagged first. This was done using a web
application that was built for this project. The goal
4
http://www.nltk.org/book/ch02.html
ICAART 2018 - 10th International Conference on Agents and Artificial Intelligence
464
was to create a tagging system that can also be used
for future projects. Another option would be using
the Amazon Mechanical Turk website for tagging, but
since the dataset is relatively small and domain spe-
cific (Dutch politics) the self-built application was a
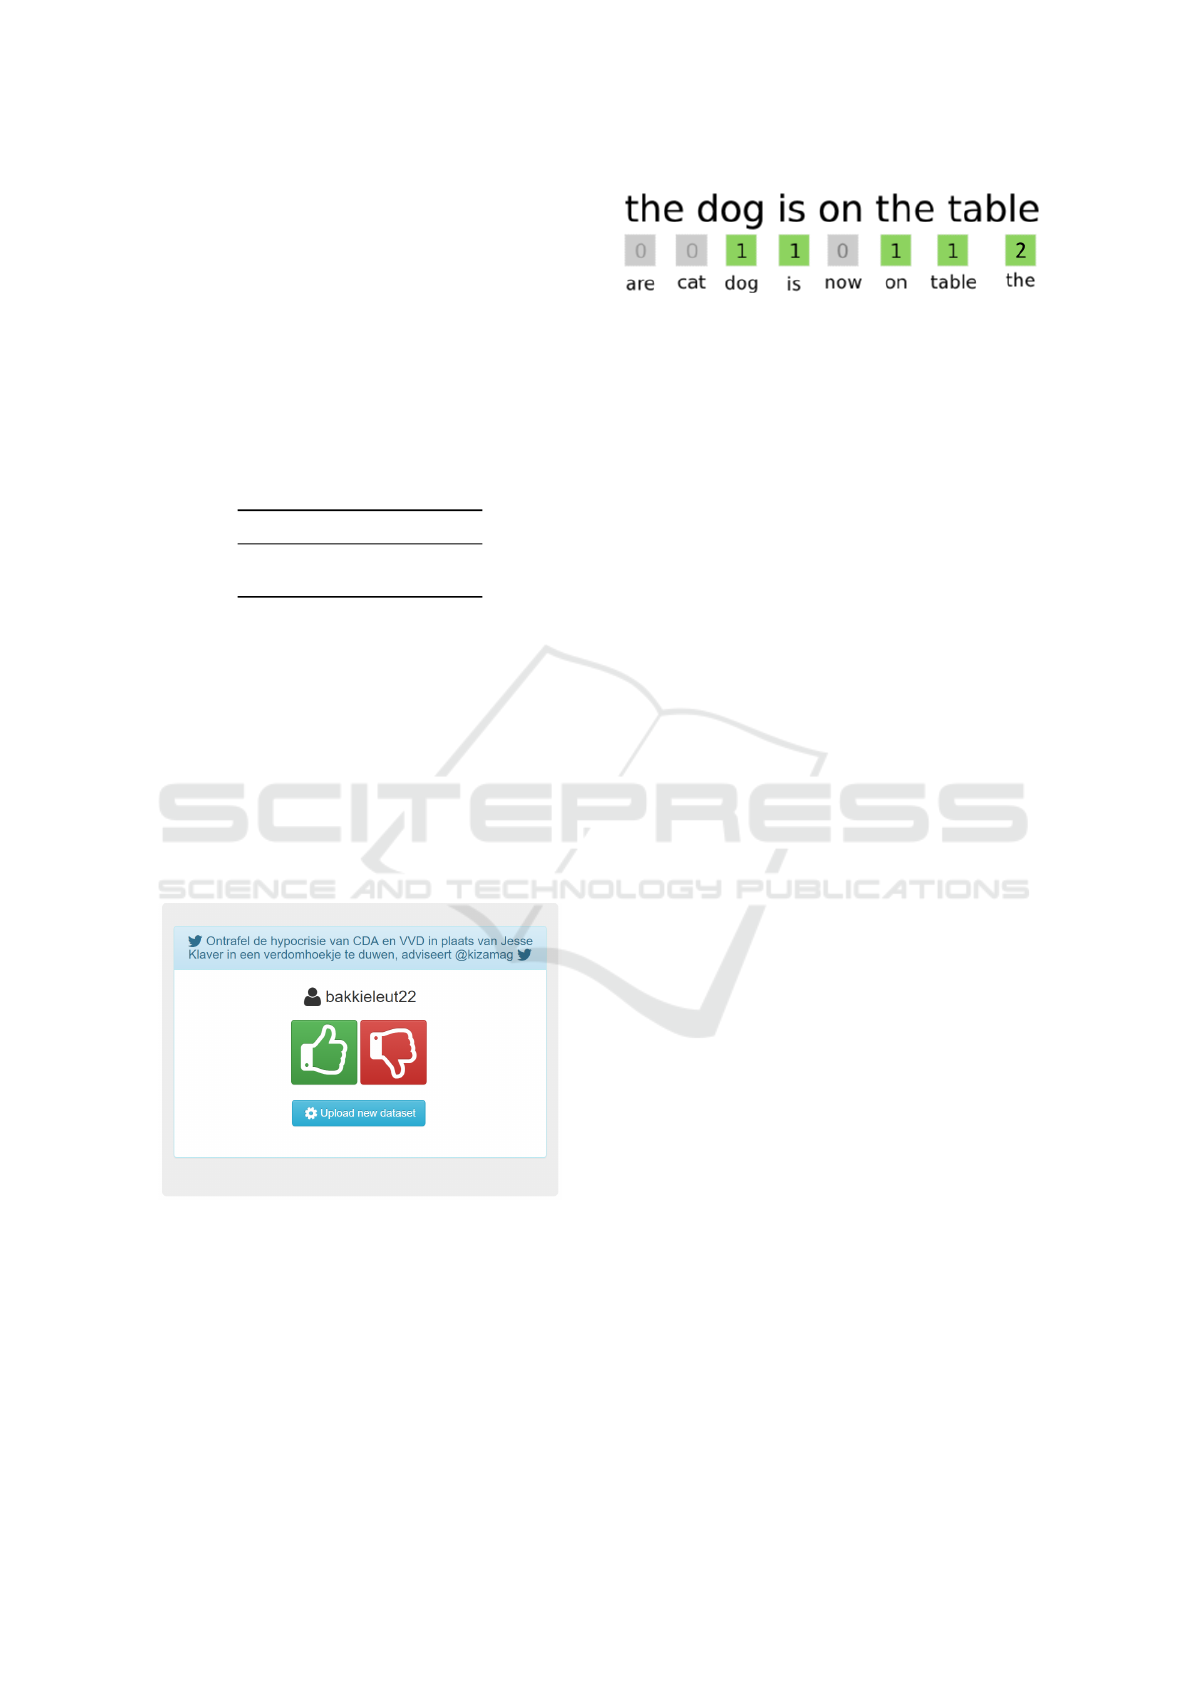
better option. The interface can be seen in Figure 1.
The app shows one tweet at a time and a tweet could
be tagged as either political or non-political by click-
ing the green or the red button. Tags were saved in
a database which could be downloaded as a CSV file
to transfer back to the program. A distribution of the
tagged tweets is shown in Table 3.
Table 3: Collected tweets.
Total 2.881
Political 1.823 (62,0%)
Non-political 1.058 (38,0%)
While the set of keywords only contained politi-
cally relevant words, 38% of the tweets are tagged as
non-political. Most of this noise comes from tweets
where people mention the first name of a political
leader but refer to someone else. There are also cases
where political leaders are mentioned, but not in a po-
litical way. For example, the Dutch prime minister
went skydiving during the collection of data. There-
fore it contains some tweets commenting on the jump,
mentioning the Prime Minister, but has nothing to do
with politics.
Figure 1: Tagging application.
3.4 Rule-based Method
To extract political tweets using a rule-based method,
tweets were classified as politically relevant if they
contained at least one of the keywords from Table 1.
Most of the works shown in Section 2 use the same
approach.
Figure 2: Bag-of-words feature representation.
In this case, the Twitter Streaming API basically
acts as the classifier by only pushing tweets that con-
tain at least one of the keywords provided in the
search. To calculate the accuracy we only have to
verify which tweets contain the keywords but are not
related to political topics of discussion.
4 STRUCTURE OF THE
CLASSIFIER
In order to build a classifier, the tweets first had to
be converted to a mathematical feature representation.
This was done using the bag-of-words model (Liu,
2012; Joachims, 1998). In this model, the text is rep-
resented as the bag (multiset) of its words. The bag-
of-words model is often used in methods of text clas-
sification where the frequency of occurrence of each
word is used as a feature for training a classifier. An
example of such a feature representation is shown in
Figure 2. To achieve this, the Countvectorizer module
was used (Pedregosa et al., 2011).
Before the bag-of-words could be created, Dutch
stop words and special characters were removed and
text was converted to lowercase. This was done to en-
sure that only relevant words would remain and names
would have the same form, independent of uppercase
use. With the removal of special characters, emoti-
cons were also removed. While emoticons can con-
tain sentimental information, they were never a decid-
ing factor to classify a tweet in this dataset. The char-
acters # and @ (frequently used Twitter characters)
were also removed in this process but the words fol-
lowing the characters remained. This way mentions,
replies and hashtags referring to parties and leaders
have the same form.
While analyzing the word frequencies of the total
corpus, it was noticed that some specific politically
irrelevant words occurred frequently. These were
mostly words related to events. Since the data was
collected in intervals over a relatively short time pe-
riod, these words were removed to ensure the classi-
fier would not overfit on these irrelevant words. Stem-
ming (Manning et al., 2008) and the use of tf-idf
(Croft et al., 2009) did not improve results. The 1.000
most frequent words were used for the bag of words.
Detecting Dutch Political Tweets: A Classifier based on Voting System using Supervised Learning
465

To run the machine learning process, each tweet
was converted using the Countvectorizer. The infor-
mation used is username, text and the features ex-
tracted from the URL when present in the tweets
JSON output. The set of feature representation of the
tweets was then split up into a training (80%) and test-
ing (20%) set. This way an estimation of the classi-
fiers performance can be made. The training data was
finally passed on to a series of eight machine learning
models from the Scikit-learn Python module:
• Logistic regression
• Linear discriminant analysis
• K-nearest neighbors
• Classification and regression trees
• Random forest
• Gaussian naive bayes
• Support vector machines
• Neural network
The Logistic Regression (LR) is a linear machine
algorithm based on the statistical logistic function,
also known as the sigmoid function, as shown in fig-
ure 1.
1/(1 + e
−value
) (1)
The function takes on an S-shaped curve and can
take any real-valued number and map it between 0
and 1. LR is used for two-class (binary) classifica-
tion problems. The algorithm makes predictions by
linearly combining input values using weights or co-
efficient values. LR performs well on numerical data
with lots of features and is often used for a first look at
the dataset because it is computationally fast. Besides
that, the model is not so prone to overfitting.
Overfitting can occur when a model is very com-
plex, such as having too many parameters relative to
the amount of data. A model that has been overfit will
overreact to minor fluctuations in the training data
and therefore will have a poor predictive performance
(Babyak, 2004).
Linear Discriminant Analysis (LDA) is another
linear machine learning algorithm used for multi-
class classification problems that can also be used for
binary classification. LDA uses the statistical proper-
ties of each class calculated from the data. It takes the
mean and the variance of a single input variable for
each class and uses the LDA equation to make pre-
dictions.
While training the LDA model on this dataset
a warning occurred stating that the variables are
collinear. This means that the predictors are corre-
lated. This is not optimal for LDA because it involves
computing a matrix inversion, which is not accurate if
the determinant is close to zero. Therefore we expect
this model to not perform well on our dataset.
K-Nearest Neighbors (KNN) is a non-linear al-
gorithm that uses the entire dataset for representation,
with no learning required. Predictions are made using
the K most similar instances (neighbors) in the train-
ing set. To calculate which instances are most simi-
lar (closest), the Euclidean distance measure is often
used, which takes the square root of the sum of the
squared differences between a new point and an ex-
isting point across all input attributes. KNN can be
used for both regression and classification problems
but can perform poorly on high dimensional datasets.
Classification and Regression Trees (CART) is
a non-linear decision tree algorithm. As the name in-
dicates, the CART variant can be used for classifica-
tion and regression problems. The CART model is
represented as a binary tree. Each root node repre-
sents a single input variable and a split point on that
variable. The last nodes of the tree, called the leaf
nodes, contain an output variable which is used to
make predictions. CART is computationally fast and
robust to noise and missing values. The model is also
easy to interpret visually when the trees only contain
several levels.
The Random Forest (RF) algorithm is another
form of a decision tree that constructs multiple de-
cision trees during training. To classify a new input,
each of the trees in the forest makes a classification.
The algorithm then chooses the classification that oc-
curs the most. Regular decision trees are prone to
overfitting to their training set, RF corrects for this.
However, the RF is harder to visually interpret than a
regular decision tree.
The Gaussian Naive Bayes (NB) is also a non-
linear algorithm used for binary and multi-class clas-
sification. The probability of a hypothesis is calcu-
lated using Bayes Theorem given prior knowledge of
the dataset. It makes predictions based on the prob-
abilities of each class in the training dataset and the
conditional probabilities of each input value given
each class value. NB is computationally fast and sim-
ple to implement but relies on independence assump-
tion and will not perform well if this assumption is
not met.
Support Vector Machines (SVM) split up data in
a two-dimensional space using a hyperplane. A hy-
perplane is chosen to best separate the data by their
classes. The hyperplane is established by learning
from the training data. Predictions are made using
this line by feeding a new value to the line equation.
The algorithm then calculates whether the value is
above or below the line to classify the input. SVM can
ICAART 2018 - 10th International Conference on Agents and Artificial Intelligence
466
model complex, nonlinear relationships, are robust to
noise and good at text classification (Tong and Koller,
2001). This model is therefore expected to perform
well on this dataset.
Neural Network (NN) algorithms are inspired by
the structure and functionality of the brain. Calcula-
tions are made using an interconnected group of neu-
rons, that pass on information once a certain threshold
is met. NNs are used to model relationships between
data, to find patterns in data and can also be used for
classification. NNs are extremely powerful and can
model very complex relationships without the need to
understand the underlying data. NNs are good at clas-
sifying images, video and even human-intelligence
type tasks like driving.
To get a baseline performance estimation, the
models were trained using the default settings. The
algorithms were evaluated using cross-validation.
Cross-validation is a method where the training set
is split up into K-folds. The algorithm is then trained
on K-1 folds and tests its accuracy on the remaining
fold that was not used for training. This process is re-
peated K times where every time another fold is used
for testing. After training and testing on all the possi-
ble folds, the mean accuracy is calculated. So cross-
validation combines the average prediction error to
derive a more accurate estimate of the performance
of the model. For this project, 10-folds were used and
the random seed was reset before each test to make
sure that the evaluation of each algorithm was done
using exactly the same data splits to ensure that the
results are directly comparable.
5 RESULTS
This section presents the results for the two methods
used to classify the tweets: a rule-based and a super-
vised learning methods.
5.1 Rule-based Method
As explained in the Section 3, the accuracy of the
rule-based method is measured by comparing the
tweet corpus collected by the API to the results ob-
tained by manually tagging the tweets. From the total
2.881 tweets, only 1.823 tweets were actually politi-
cally relevant, resulting in an accuracy of 62%.
5.2 Supervised Learning
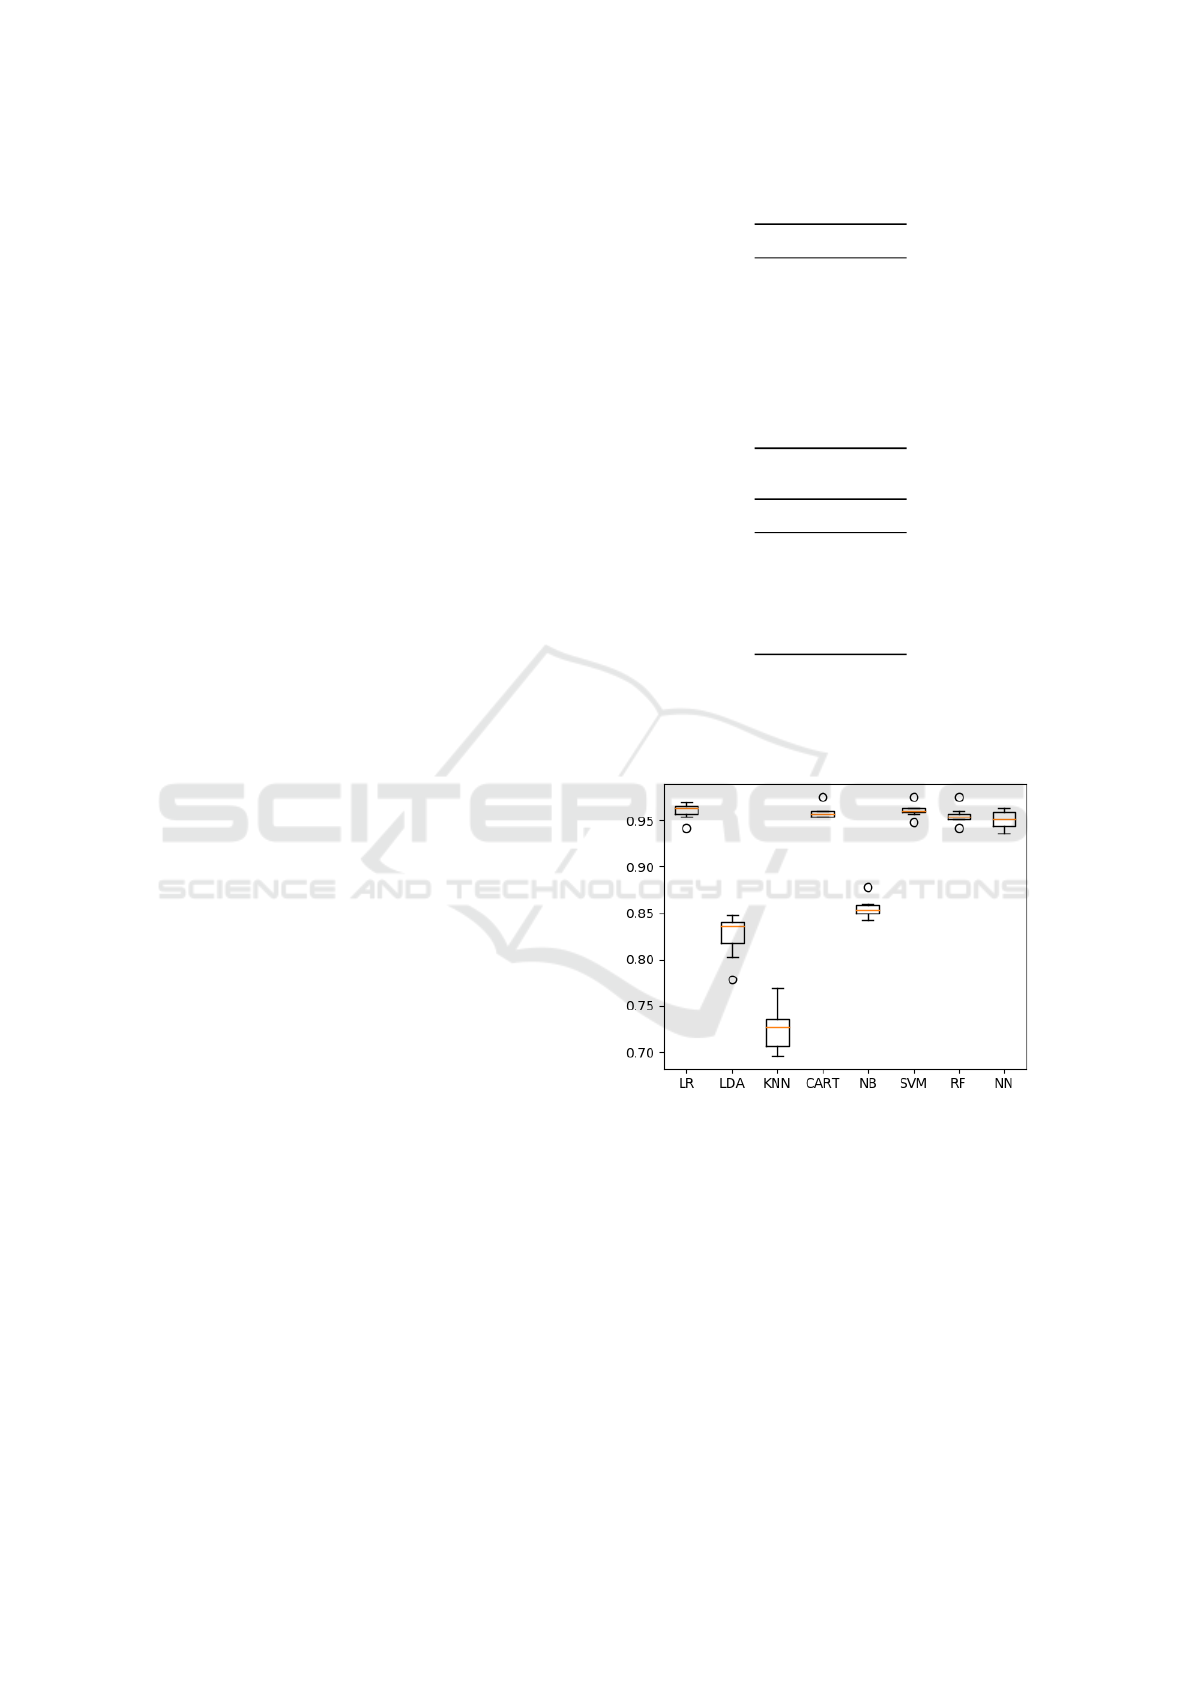
As explained in the previous section, we have run
eight cross-validation models to find a good fit for our
data set. The mean accuracy from the cross-validation
Table 4: Cross validation results.
Model Accuracy
LR 0.96
LDA 0.83
KNN 0.73
CART 0.96
NB 0.86
SVM 0.96
RF 0.96
NN 0.95
Table 5: Test set results.
Model Accuracy
LR 0.96
CART 0.95
SVM 0.96
RF 0.96
NN 0.95
per model was calculated and resulted in the scores
shown in Figure 3 and Table 4
Figure 3: Training set accuracies.
As can be observed in table 4, LDA, KNN and NB
are outperformed by the other models by more than
10%. Therefore these models were excluded from the
final classifier. The five remaining models were then
trained on the whole training set and used to make
predictions on the test set. This process was repeated
10 times with different training/test splits resulting in
the average accuracies shown in Table 5.
The accuracies are very similar, therefore the
models were combined to check whether it would im-
prove performance. This was done by using a voting
system. Since there are five models, a vote will al-
ways have a majority. If three models classify a tweet
Detecting Dutch Political Tweets: A Classifier based on Voting System using Supervised Learning
467
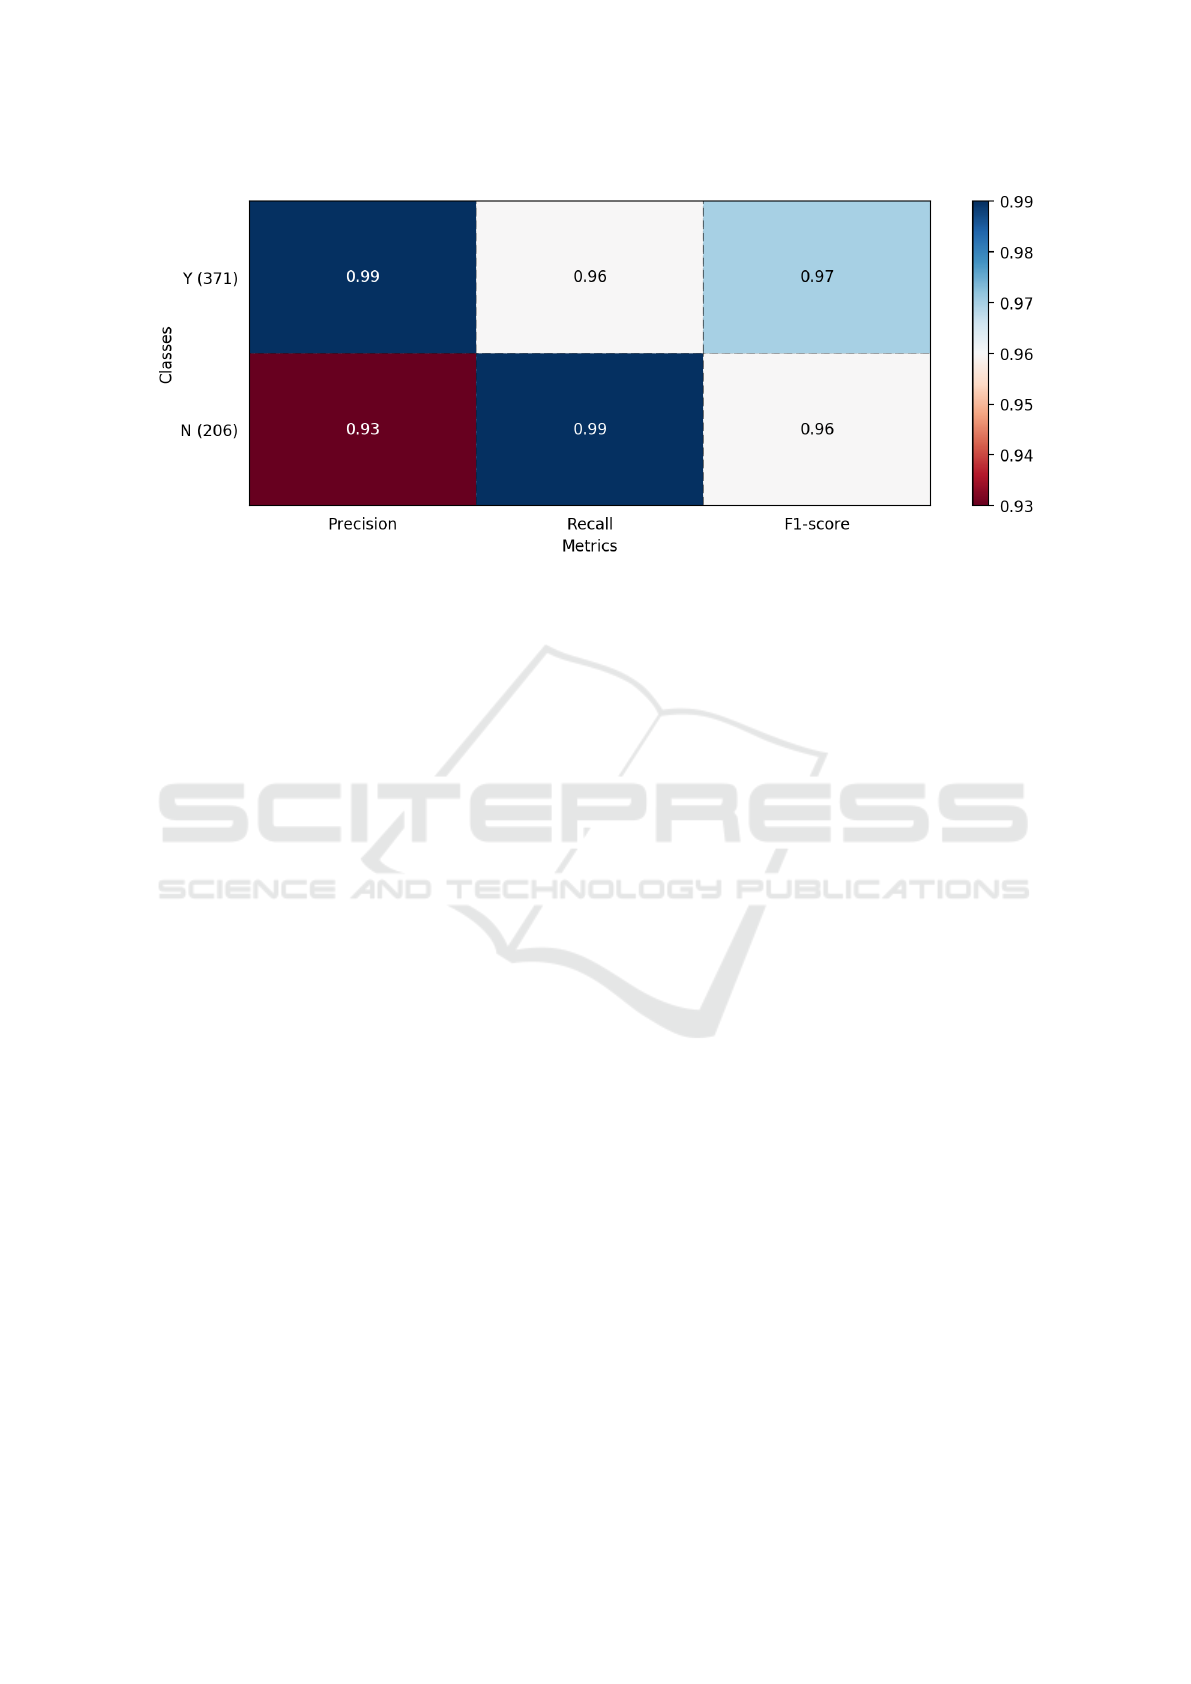
Figure 4: Classification report for political (Y) and non-political (N) tweets.
as ‘political’ and two as ‘non-political’, the final pre-
diction will be ‘political’ and vice versa. With the
combination of models, the accuracy on the test set
went up by roughly 1% depending on the training/test
split, resulting in an average accuracy of 97%.
Accuracy can be misleading though. A model
with a lower accuracy can sometimes have a greater
predictive power. This can occur when there is a
class imbalance which is the case for this dataset.
The classification report in Figure 4 provides a break-
down of the classes by precision, recall and f1-score
where ‘N’ and ‘Y’ correspond to non-political and
political tweets respectively. The classification report
shows that the classifier slightly underperforms (93%)
in classifying non-political tweets as non-political but
overall performs well and therefore the accuracy mea-
sure is not misleading.
6 DISCUSSION
The classification of tweets for the prediction of po-
litical elections and people’s opinions in social me-
dia became very controversial, leading to completely
different results when using rule-based methods for
this purpose. We trust that there is a potential im-
provement in those results by separating tweets that
are related to political topics before classifying them
as supportive to certain parties of political positions.
This work presents a method based on more than
one machine learning algorithm to define the content
of messages shared in Twitter concerning the topic
of discussion as political or non-political. In our
method, the five best performing machine learning
models were combined to create a voting system that
can distinguish never before seen political from non-
political Dutch tweets with an accuracy of 97%. The
usage of this method can be extended to studies re-
lated to spread of political opinion on social media,
political interpretation of social media content, and
can also be applied to other problems related to clas-
sification of text content.
The results show that using a supervised learn-
ing approach to identify political tweets instead of a
rule-based method could result in more representative
datasets which could then lead to more accurate anal-
yses of political content from Twitter. The method
described in this paper could help to solve the con-
tradictory results from previous studies discussed in
here.
While the results of this study are sound, further
research should be done to investigate how the classi-
fier transfers to other, but similar corpora. (Cohen and
Ruths, 2013) showed that tweet classifiers cannot be
used to classify users outside the narrow range of po-
litical orientation on which they were trained. How-
ever, their study was done on the classification of the
political orientation of users and not political tweets
in general.
Our classifier was trained and tested on a small
dataset collected over a short period of time (2.881
tweets in a two months time span). The political
agenda changes over time and thus also the politi-
cal subjects which people tweet about. A classifier
should be held up to date by adding new training data
and increasing the sample size.
The set of keywords used for the collection of po-
litical tweets is also limited. The set included the
abbreviations of the Dutch political parties and their
leaders but there are others ways to address politics.
ICAART 2018 - 10th International Conference on Agents and Artificial Intelligence
468

For example by using the words ‘Senate’ or ‘Prime
Minister’. Thus the set of keywords could be ex-
tended according to the desired application.
The method used in this research also lacks a tech-
nique to process replies. A solution to this could be
to link the reply to the original tweet, and separate
both texts. This can be very useful when studying the
effect of the spread of messages in social networks.
Finally, the machine learning models could be
tweaked further to optimize the results. In this pro-
cess, called hyperparameter optimization, the model
settings are adjusted accordingly to the dataset. Fu-
ture work is going to be carried in improving the pa-
rameters of the models. We also aim to use the classi-
fier in other works related to social network analysis
of political positions and social contagion of political
opinions in networks.
ACKNOWLEDGEMENTS
E.F.M. Ara
´
ujo’s stay at the VU University Amster-
dam is funded by the Brazilian Science without Bor-
ders Program, through a fellowship given by the Co-
ordination for the Improvement of Higher Education
Personnel CAPES (reference 13538-13-6).
REFERENCES
Asur, S. and Huberman, B. A. (2010). Predicting the future
with social media. In Web Intelligence and Intelligent
Agent Technology (WI-IAT), 2010 IEEE/WIC/ACM
International Conference on, volume 1, pages 492–
499. IEEE.
Babyak, M. A. (2004). What you see may not be what you
get: a brief, nontechnical introduction to overfitting
in regression-type models. Psychosomatic medicine,
66(3):411–421.
Cohen, R. and Ruths, D. (2013). Classifying political ori-
entation on twitter: It’s not easy! In ICWSM.
Conover, M., Ratkiewicz, J., Francisco, M. R., Gonc¸alves,
B., Menczer, F., and Flammini, A. (2011a). Political
polarization on twitter. ICWSM, 133:89–96.
Conover, M. D., Gonc¸alves, B., Ratkiewicz, J., Flammini,
A., and Menczer, F. (2011b). Predicting the politi-
cal alignment of twitter users. In Privacy, Security,
Risk and Trust (PASSAT) and 2011 IEEE Third In-
ernational Conference on Social Computing (Social-
Com), 2011 IEEE Third International Conference on,
pages 192–199. IEEE.
Croft, B., Metzler, D., and Strohman, T. (2009). Search
Engines: Information Retrieval in Practice. Addison-
Wesley Publishing Company, USA, 1st edition.
Golbeck, J. and Hansen, D. (2014). A method for comput-
ing political preference among twitter followers. So-
cial Networks, 36:177–184.
He, Y., Saif, H., Wei, Z., and Wong, K.-F. (2012). Quan-
tising opinions for political tweets analysis. In LREC
2012, Eighth International Conference on Language
Resources and Evaluation.
Hong, L., Convertino, G., and Chi, E. H. (2011). Language
matters in twitter: A large scale study. In ICWSM.
Joachims, T. (1998). Text categorization with support vec-
tor machines: Learning with many relevant features.
Machine learning: ECML-98, pages 137–142.
Liu, B. (2012). Sentiment analysis and opinion mining.
Synthesis lectures on human language technologies,
5(1):1–167.
Liu, W. and Ruths, D. (2013). What’s in a name? using
first names as features for gender inference in twitter.
In AAAI spring symposium: Analyzing microtext, vol-
ume 13, page 01.
Manning, C. D., Raghavan, P., and Sch
¨
utze, H. (2008). In-
troduction to Information Retrieval. Cambridge Uni-
versity Press, New York, NY, USA.
Maynard, D. and Funk, A. (2011). Automatic detection
of political opinions in tweets. In Extended Seman-
tic Web Conference, pages 88–99. Springer.
Mohammad, S. M., Zhu, X., Kiritchenko, S., and Martin,
J. (2015). Sentiment, emotion, purpose, and style in
electoral tweets. Information Processing and Man-
agement, 51(4).
Pedregosa, F., Varoquaux, G., Gramfort, A., Michel, V.,
Thirion, B., Grisel, O., Blondel, M., Prettenhofer,
P., Weiss, R., Dubourg, V., Vanderplas, J., Passos,
A., Cournapeau, D., Brucher, M., Perrot, M., and
Duchesnay, E. (2011). Scikit-learn: Machine learning
in Python. Journal of Machine Learning Research,
12:2825–2830.
Rajadesingan, A. and Liu, H. (2014). Identifying users with
opposing opinions in Twitter debates. Lecture Notes in
Computer Science (including subseries Lecture Notes
in Artificial Intelligence and Lecture Notes in Bioin-
formatics), 8393 LNCS:153–160.
Sang, E. T. K. and Bos, J. (2012). Predicting the 2011 dutch
senate election results with twitter. In Proceedings of
the workshop on semantic analysis in social media,
pages 53–60. Association for Computational Linguis-
tics.
Sylwester, K. and Purver, M. (2015). Twitter language use
reflects psychological differences between democrats
and republicans. PloS one, 10(9):e0137422.
Tong, S. and Koller, D. (2001). Support vector machine
active learning with applications to text classification.
Journal of machine learning research, 2(Nov):45–66.
Tumasjan, A., Sprenger, T. O., Sandner, P. G., and Welpe,
I. M. (2010). Predicting elections with twitter:
What 140 characters reveal about political sentiment.
ICWSM, 10(1):178–185.
Detecting Dutch Political Tweets: A Classifier based on Voting System using Supervised Learning
469
