
Feature Extraction and Selection for EEG and Motion Data in Tasks
of the Mental Status Assessing
Pilot Study using Emotiv EPOC+ Headset Signals
Alexey Syskov, Vasilii Borisov, Vsevolod Tetervak and Vladimir Kublanov
Ural Federal University named after the first President of Russia B.N. Yeltsin, 19 Mira str., 620002, Yekaterinburg, Russia
Keywords: Accelerometer, Brain-Computer Interface, Electroencephalography, Machine Learning, Mental Evaluation,
Test of Variables of Attention, Principal Component Analysis.
Abstract: In the paper the results of extracting and selection the features of EEG data and accelerometer for mental
status evaluation are shown. We have used 14 channel wireless EEG-system Emotiv EPOC+ with
accelerometer (motional data - MD) for short-term recording under several functional states for 10 healthy
subjects: Functional rest (rest state), TOVA-test (mental load), Hyperventilation (physical load) and
Aftereffect (after test state). We then extracted core features from EEG-only and MD-only data using principal
component analysis. After that, supervised learning methods were used for mental state classification: EEG-
only core features for AF3, T7, O1, T8, AF4 channels, MD-only core features and EEG- MD integrated core
features. Experimental results showed that integrated core features for mental status evaluation have higher
prediction accuracy 92,0% for decision tree method.
1 INTRODUCTION
Evaluation of human mental status is a complex and
complicated task. Electroencephalography (EEG) is
well known method for assessing mental state and
optimizing conventional performance: attention;
workload; emotion (Wolpaw and Wolpaw, 2012).
Acquisition of EEG signal in real-world
conditions is characterized by the usage of mobile and
wearables devices (Lin and Jung, 2017; So et al.,
2017; Sun et al., 2012). Combinations of different
modalities sensors are used for assessing and
controlling the subject’s function state (Silva et al.,
2014).
Accelerometer is one of widely used sensors for
assessing body movement artefact during ECG, EEG
recording. An accelerometer signal is acquired in
order to identify areas of the signal with motion
artifacts (Y. Kishimoto et al., 2007). In (Wu et al.,
2017) operator’s mental workload is measured with
EEG headset. EEG headset was composed of two
electrodes and an accelerometer attached to the
electrodes. When in some epoch the acceleration of
the electrodes exceeds a certain value, EEG data
corresponding to that epoch were removed from
further analysis.
Moreover, there are few works where
accelerometer-only data were used to study
neurological diseases (Kutilek et al., 2010). In
(Danilov et al., 2008) the vestibular system is
considered as important in virtually every aspect of
our daily life. Head acceleration information is
essential for our adequate behavior in three-
dimensional space not only through vestibular
reflexes that act constantly on somatic muscles and
autonomic organs, but also through various cognitive
functions such as perception of self-movement,
spatial perception and memory, visual spatial
constancy, visual object motion perception. Thus,
accelerometer data can be used for subject’s
functional state classification in combination with
other sensors.
A small and light-weight wearable
electrocardiograph (ECG) equipment with a three-
axis accelerometer (x, y and z-axis) was developed
for prolonged monitoring of everyday stress (Okada
et al., 2013). In that study, the waveform of
acceleration data were used as the pattern for a
subject’s movement or posture in long-term
monitoring. In (Wu et al., 2015) two modalities of
sensors: HRV recorders and accelerometers were
integrated to monitor the stress levels in daily life.
The accuracy of stress level classification was
164
Syskov, A., Borisov, V., Tetervak, V. and Kublanov, V.
Feature Extraction and Selection for EEG and Motion Data in Tasks of the Mental Status Assessing - Pilot Study using Emotiv EPOC+ Headset Signals .
DOI: 10.5220/0006593001640172
In Proceedings of the 11th International Joint Conference on Biomedical Engineering Systems and Technologies (BIOSTEC 2018) - Volume 1: BIODEVICES, pages 164-172
ISBN: 978-989-758-277-6
Copyright © 2018 by SCITEPRESS – Science and Technology Publications, Lda. All rights reserved
improved by 4.9% on average in comparison with
HRV-only feature set. Therefore, accelerometer data
can be used in long-term monitoring as tool to
identify areas of the signal with motion artifacts and
subject’s activity classify.
In our paper, we have used the Emotiv EPOC+
head set for gathering both motion and EEG data in
short-term experiments under several functional
states. The aim of the study is evaluation of feature in
EEG-only, accelerometer-only and integrated feature
spaces in series of short-term experiments.
2 MATERIALS AND METHODS
A series of experiments with headset Emotiv EPOC+
was carried out to study parameters which would
describe different subject mental status. The Emotiv
EPOC + headset provides information about the
induced electrical activity of the brain from 14
channels (David et al., 2014). This information
contains the voltage value for each electrode with a
sampling frequency of 128 Hz. Figure 1 depicted the
layout of the electrodes is AF3, F7, F3, FC5, T7, P7,
O1, O2, P8, T8, FC6, F4, F8, AF4 in standard 10-20
scheme. In addition, the motion data from three-axis
accelerometer integrated into the headset were
collected.
Each experiment contained five stages as
presented in Table 1. During each of the stages the
subject sits opposite the PC monitor and looks at the
screen with instruction and tasks.
Table 1: The cyclorama of the experiment.
Stage
Duration, sec
1. Rest state (RS)
300
2. TOVA test (T1)
180
3. Hyperventilation load (HL)
180
4. TOVA test (T2)
180
5. Aftereffect (AE)
300
Recording the stage of rest state involves
biomedical signals data from the subject, who looks
at the black screen and does nothing.
The next stage is carried out with the TOVA test,
which is the test of attention of variability - a psycho-
physiological test to evaluate conventional
performance related to attention and control of the
reaction. The Pebl software was used for the test
procedure. During the test squares and circles appears
alternately at the top and bottom of the computer
screen. The task of the subject is to press a space on
the keyboard when a square appears at the top of the
screen (Mueller and Piper, 2014).
The stage of hyperventilation is standard
functional load, when the subject often breathes
throughout the entire length of time, simulating
breathing during heavy sport loads.
Collected in each experiment raw EEG and
accelerometer data were saved into storage with
additional information about the subjects and events
marks (Borisov et al., 2017).
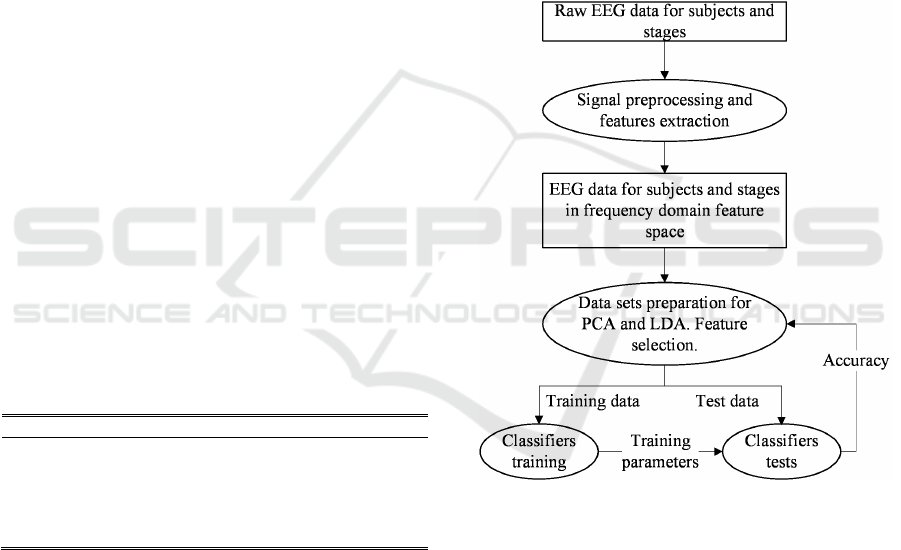
2.1 EEG Feature Engineering
Collected during the experiments raw EEG data were
processed in several steps of feature extraction and
selection. The process of feature engineering is
presented in Figure 1.
Figure 1: EEG feature engineering.
In the first step, all EEG data were transformed to
the frequency domain. To separate EEG – rhythms
from the signal, a second-order Butterworth bandpass
filter were applied. Rhythms borders were: Theta (4-
7) Hz, Alpha (7-15) Hz, Beta-Low (15-25) Hz, Beta-
High (25-31) Hz. Discrete Fourier transform method
was used for frequencies’ magnitudes extraction. As
result, four coefficients are calculated for each of 14-
th channel. Each coefficient is sum of magnitudes for
one of the rhythms. Thus, EEG data in frequency
domain are described as 56-dimension feature space.
After that, on the feature selection step (Egorova
et al., 2014), principal component analysis method
(PCA) (Jolliffe, 2014) in combination with linear
Feature Extraction and Selection for EEG and Motion Data in Tasks of the Mental Status Assessing - Pilot Study using Emotiv EPOC+
Headset Signals
165

discriminant analysis (LDA) (McLachlan, 1992), are
used for reducing 56-dimension feature space. Data
sets for analysis contained EEG recordings for all
subjects and the following pairs of stages: RS and HL;
RS and T1; T1 and HL.
LDA was used for evaluation of the principal
components pairs (Kublanov et al., 2016). The pair of
components with best accuracy and maximum
described variance were selected as base for new
feature space.
Finally, information about PCA loadings were
used for selecting EEG channels and frequency bands
as EEG new feature space. After that, supervised
learning methods were used for mental state
classification.
2.2 Accelerometer’s Feature Space
The Emotiv EPOC + headset, in addition to
information about the induced electrical activity of
the brain, provide data from a three-axis
accelerometer, which allows assessing the movement
of the headset in space during the experiment.
Accelerometer data is recorded to a separate file, each
record contains the values of the acceleration for each
axis and the data recording time. The scheme of the
accelerometer axis is shown in Figure 2.
Figure 2: Accelerometer axis orientation (“EMOTIV Epoc
- 14 Channel Wireless EEG Headset,” n.d.).
The three-axis accelerometer provides
information on the magnitude of the acting
accelerations along the three axes, respectively. The
acceleration value for each axis is registered through
equal time intervals. The signal measured by the
accelerometer is a linear sum of three components
(Machado et al., 2015):
• Body Acceleration Component (BA) is
acceleration resulting from body movement;
• Gravitation Acceleration Component (GA) is
acceleration resulting from gravity;
• Noise inherent to the measuring system.
GA provides information about the spatial orientation
of the device, and the BA provides information about
the movement of the device and subject’s head
movement. The frequency spectrum of accelerations
caused by human motion is located in the range from
0 to 20 Hz. The gravitational component is located in
the range from 0 to 0.3 Hz.
The component containing instrumental noise is
located generally in the range above 20 Hz. To isolate
the motion component from the signal, a second-
order Butterworth window filter with frequencies
from 0.3 to 20 Hz was applied (Mathie, 2003). In
Figure 3 the accelerometer signals before and after
filtering are represented. According to the article (Wu
et al., 2015), the most revealing motion data (MD)
features of the accelerometer signal are present in
Table 2.
Because of the discrete nature of the
accelerometer signal, ZCR was calculated as the
number of sections where the previous sign differs
from the current sign.
Activity - the value characterizing the change in the
signal over time was calculated by the following
formula (2):
(1)
where
= (
);
x
i-1
, x
i
are consecutive counts for x axis;
∆y, ∆z are calculated in same way for y and z axles
The average activity time is the ratio of the total
activity time, which exceeds the average level by
10%, to the number of stages exceeding this level.
The level of 10% was chosen as the most informative.
After calculating all features for each subject, the
data was written into the matrix F by N, where F is
the number of features, and N is the result of
multiplication the number of stages by the number of
subjects.
3 RESULTS
The results of feature selection for EEG in different
data sets are shown in section 3.1.
In section 3.2 results of classification for EEG-
only feature, accelerometer-only feature and
integrated feature space are shown.
BIODEVICES 2018 - 11th International Conference on Biomedical Electronics and Devices
166
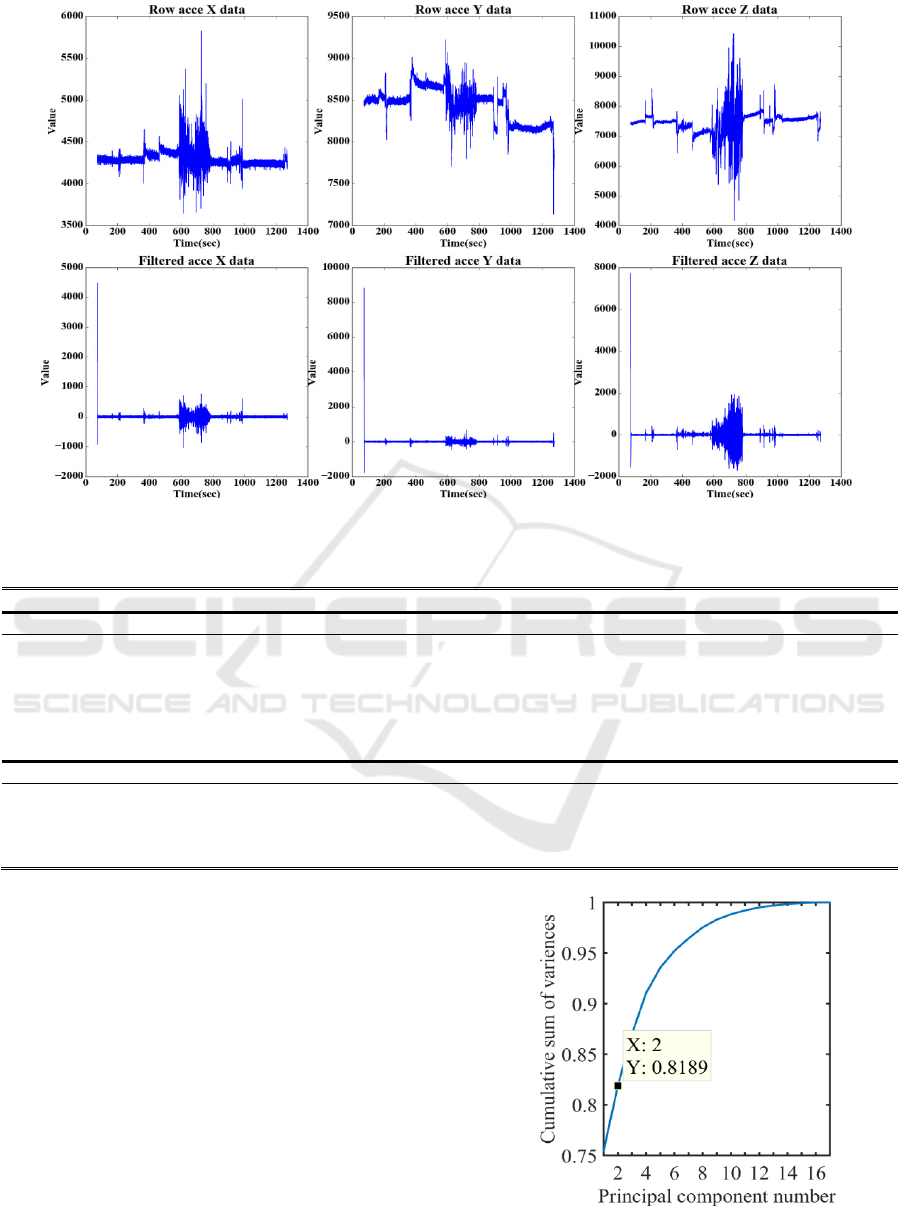
Figure 3: Accelerometer axes signal before and after filtering.
Table 2: MD features of the accelerometer signal.
MD feature
Description
Axis features
Max
Maximum value is the maximum acceleration value at a given time interval
Min
Minimum value is the minimum value of acceleration at a given time interval
Average value
The average value of acceleration at a given time interval
STD
Indicates the dispersion to the mean of the signal over time a given time interval
ZCR
Zero cross rate is the number of intersections by the zero signal.
Energy
Signal energy at a given time interval
Non axis features
Mean ZCR
Mean zero cross rate for three axes for current stage
Mean Energy
Mean energy for three axes for current stage
Activity
Characteristic of signal change
Average activity time
Mean time of high-level activity
3.1 EEG Feature Selection
Here we show the results for all subjects and
combination of stages in the following pair of data
sets:
1. HL and RS;
2. T1 and RS;
3. T1 and HL.
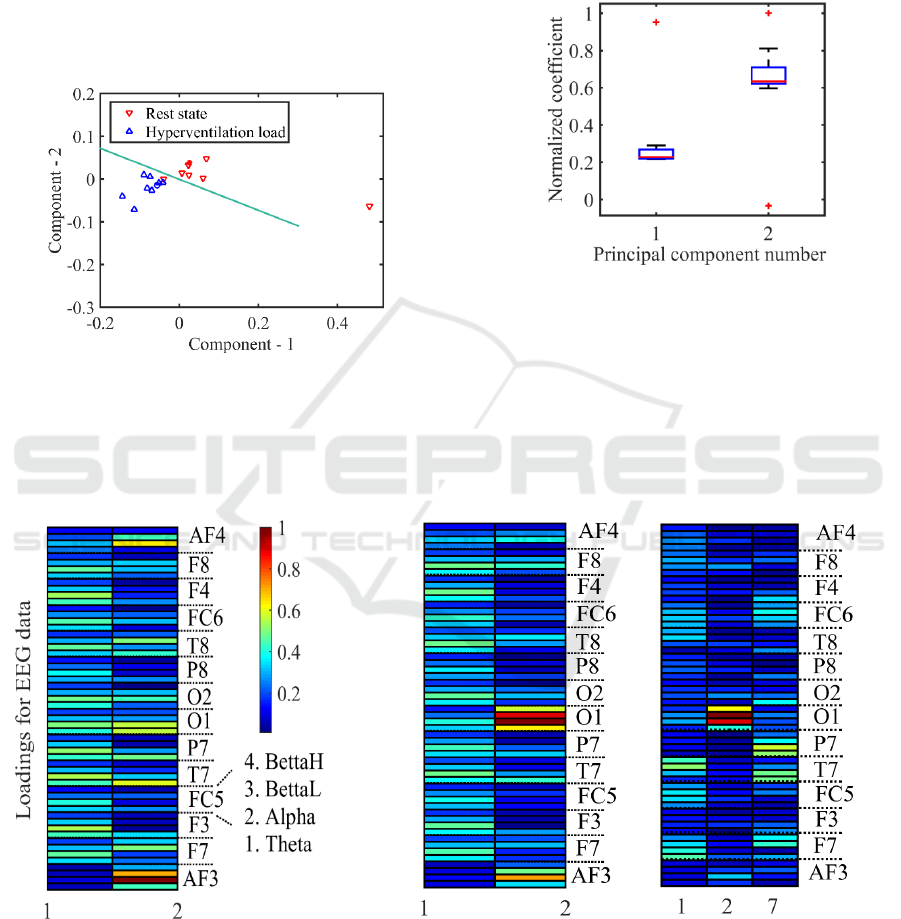
3.1.1 Hyperventilation Load and Rest Data
Set
Figure 4 depicted cumulative sum of variance for
principal components. The first two components
explained 82% of total variance.
Figure 4: Cumulative sum of variance for HL and RS.
Feature Extraction and Selection for EEG and Motion Data in Tasks of the Mental Status Assessing - Pilot Study using Emotiv EPOC+
Headset Signals
167
After that, a classification was performed using
LDA for component 1 and 2. Training data contains
9 subjects for two classes RS and HL (functional rest
and hyper ventilation load).
Next step we calculate the prediction accuracy
estimation on an independent data sets by doing
cross-validation. During iterative procedure, we
remove one of the subject in training set. Figure 5
shows the result of classification. The average
accuracy of classification 94%.
Figure 5: Classification of subjects for HL and RS.
We used the equation (2) for interpretation of
LDA linear coefficients, where K – vector of
constant, L – vector of linear coefficients, v – data
vector.
K + L*v = 0
(2)
Figure 6 presents stats boxes for normalized linear
coefficients L from (2) for independent sets for PCA
scores 1 and 2. Component N-2 more significant for
discrimination on data set with two classes of RS and
HL.
Figure 6: LDA’s linear coefficients boxes for HL-RS.
Figure 7 (a) represents image plot of PCA-
loadings. Loadings are structured along the channels
and rhythms of the EEG. For each channel, the values
for Theta, Alpha, Beta-low and Beta-High EEG-
rhythms are presented. The EEG-rhythms order is
shown in the figure. The values of the loading are
normalized and a color scale is introduced.
Component number
(a)
(b)
(c)
Figure 7: Normalized PCA-loadings image plots.
a) – image plot of PCA-loadings for HL and RS data set;
b) – image plot of PCA-loadings for T1 and RS data set;
c) – image plot of PCA-loadings for T1 and HL data set.
BIODEVICES 2018 - 11th International Conference on Biomedical Electronics and Devices
168
First component reflects variance caused by Theta
and Alpha frequency band activity. Its concerns all
EEG channel. Second component reflects variance
caused by changing loadings for AF3, P7, T7, O1, T8,
AF4 channels.
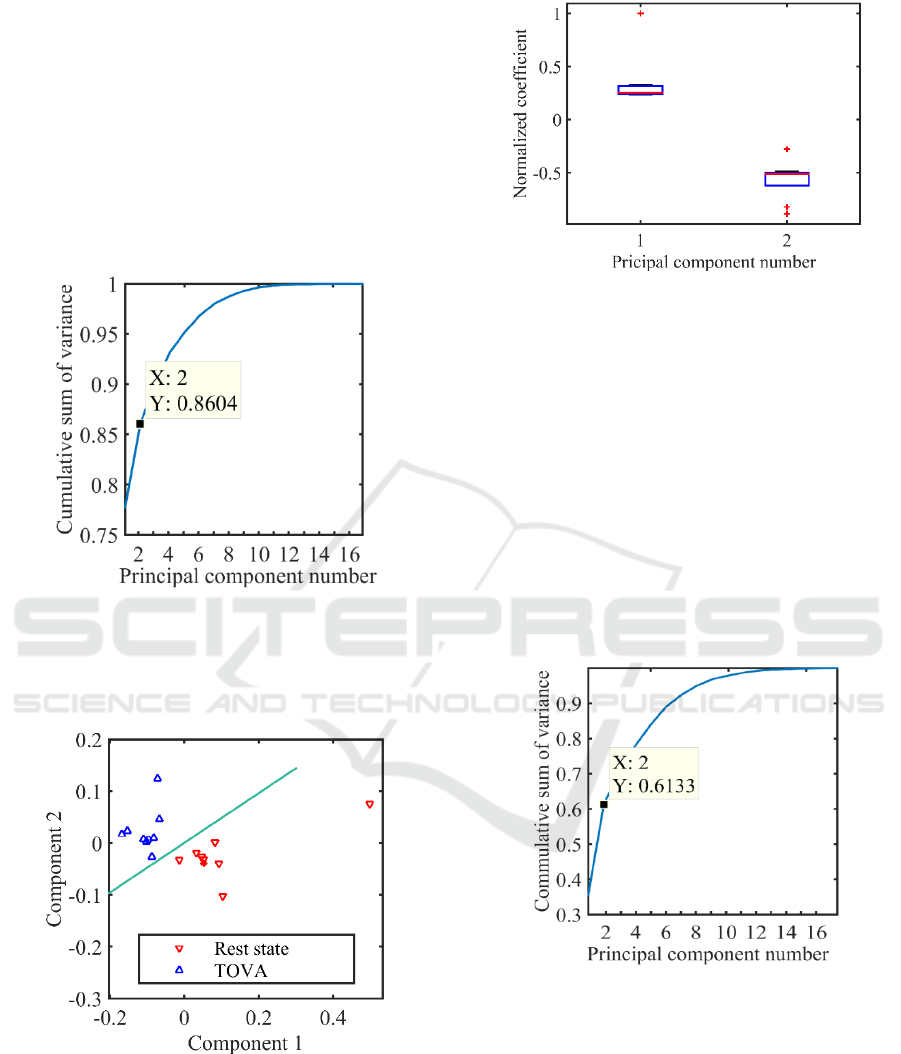
3.1.2 TOVA and Hyper Ventilation Data Set
Figure 8 depicted cumulative sum of variance for
principal components. The first two components
explained 86% of total variance.
Figure 8: Cumulative sum of variance for HL and T1.
In Figure 9 presented result of linear discriminant
analysis on training set for TOVA and rest data set.
The average accuracy of classification is 100%.
Figure 9: Classification of subjects for RS and T1.
Figure 10 depicts stats boxes for normalized linear
coefficients L form (2) for independent sets for
components 1 and 2.
As we can see, the both components are equally
significant for discrimination on data set with two
classes of RS and T1 load.
Figure 10: LDA’s linear coefficients boxes for T1-RS.
In Figure 7 (b) showed image plot of loadings.
First component reflects variance caused by Theta
and Alpha frequency band activity. Its concerns all
EEG channel. Second component reflects variance
caused by changing loadings for AF3 and O1
channels.
3.1.3 TOVA and Hyper Ventilation Data Set
Figure 11 presents cumulative sum of variance for
principal components. The first two components
explained 61 % of total variance. Sum of variances
for 1 and 2 components a sufficient less in
comparison with previous cases.
Figure 11: Cumulative sum of variance for HL and T1.
In this case, we try to classify subjects in spaces
for all pair combination of components with LDA.
The results with accuracy more than 70% depicted in
Table 3, where sum of variance for pair based on
Figure 12 data, weighted index is multiplication
accuracy and sum of variance for pair.
Feature Extraction and Selection for EEG and Motion Data in Tasks of the Mental Status Assessing - Pilot Study using Emotiv EPOC+
Headset Signals
169
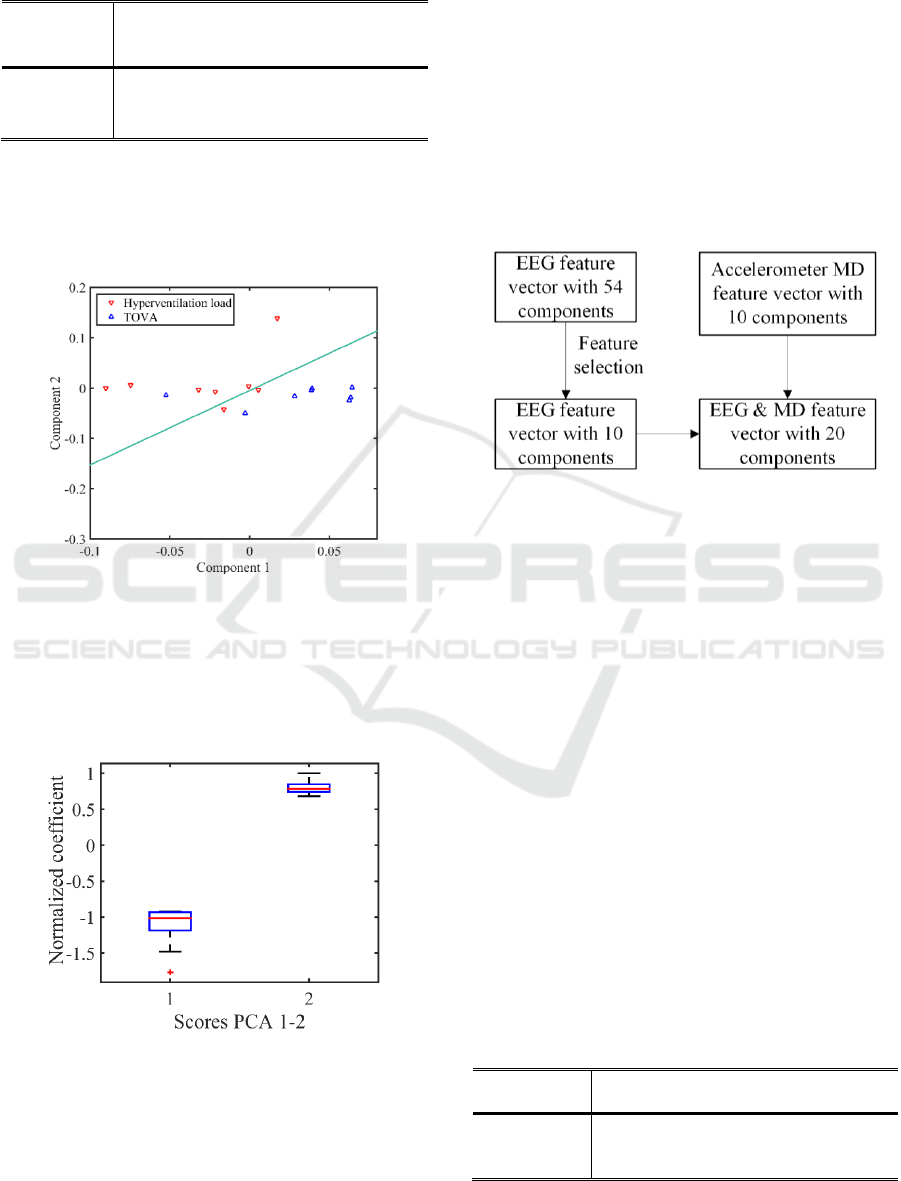
Table 3: Pairs of components, accuracy and sum of
variance.
Component
pair
Accuracy
Sum of
variance for
pair
Weighted
index
1-7
0.83
0.39
0.32
2-7
0.78
0.29
0.23
1-2
0.72
0.61
0.44
Perform classification using discriminant analysis
for 1, 2 components with maximum of weighted
index. Figure 13 depicted result of linear discriminant
analysis on training set for TOVA and
hyperventilation data set.
Figure 12: Classification of subjects for HL and T1.
Figure 13 shows stats boxes for normalized linear
coefficients L form (1) for independent sets for
components 1 and 2. As we can see, the both
components are equally significant for discrimination
on data set with two classes of RS and T1 load.
Figure 13: LDA’s linear coefficients boxes HL-T1.
Figure 7 (c) presented image plot of loadings.
Second component reflects variance caused primary
by Alpha and Betta frequency band activity for O1
channel. Channels P7, F7 appears with significant
less loadings weights.
3.2 Classification in Integrated Feature
Space
Initially EEG feature vector contained 54 components
for 14 channels their rhythms borders were: Theta (4-
7) Hz, Alpha (7-15) Hz, Beta-Low (15-25) Hz, Beta-
High (25-31) Hz. Based on results in section 3.1 AF3,
T7, O1, T8, AF4 channels with Theta and Alpha
frequency bound are selected for EEG feature space.
Integrated features space was created from EEG
selected features and accelerometer MD features as
showed on Figure 15.
Figure 14: Integrated feature vector.
Full feature space for accelerometer as described
in section 2 are used. It need to be mentioned we don’t
use any weighted coefficients for selected EEG
features in model generalization purpose (Wolpaw
and Wolpaw, 2012).
LDA, Naïve Bayes (NB) and Decision Trees (DT)
classification methods are used for EEG feature
space. LDA method applied to finding linear
combinations of features that best distinguish object
classes. NB method - special case of the Bayesian
classifier. The method based on the assumption that
the objects are described by the statistically
independent variables. DT are nonparametric
method. This method does not require any
assumptions about the distribution of the variables in
each class (Kublanov et al., 2017).
The prediction accuracy evaluated on an
independent sets by doing “leave one out” cross-
validation (Refaeilzadeh et al., 2009). Table 4
contains the mean accuracy for 10 test data sets for all
five stages.
Table 4: Accuracy for EEG and MD feature space.
Accuracy, %
Method
EEG-only
MD-only
Integrated
LDA
72.4
89.3
86.7
NB
68.9
89.3
86.7
DT
71.6
84.0
92.0
BIODEVICES 2018 - 11th International Conference on Biomedical Electronics and Devices
170

The best result for integrated feature space have
higher prediction accuracy 92.0%, in comparison
with EEG-only (72.4 %) mental status evaluation for
AF3, T7, O1, T8, AF4 channels. The best results for
MD-only data are 89.3% for LDA and NB methods.
4 DISCUSSION AND
CONCLUSION
According to the results of the of EEG data analysis
for various combinations of functional loads, the most
informative channels for Theta and Alpha rhythms in
the frontal, hip and occipital areas were identified.
For three different classifiers, the best accuracy of
classification of the five functional states in the EEG
generated characteristic space is at the level of 72.4%
for LDA method.
In turn, the classification in the attribute space of
the accelerometer, for the LDA and NB classifiers,
allows to reach 89.3% accuracy of identification of
five functional states. The processing of the joint
indicative space of the EEG –MD integrated core
features allowed to increase the classification
accuracy to 92.0% for DT method.
The results obtained in this paper reflect changes
in the power levels of the EEG indices in various
functional states, which makes it possible to
characterize the functional state of a person. The
decrease in the control effect of the cerebral cortex
(alpha-rhythm activity) increases the amplitude of the
average acceleration of the head movement. The
rather high classification accuracy obtained for the
signs of EEG signals isolated using the PCA method
suggests that changes in physiological processes
underlie these changes.
An increase in the accuracy of classification (on
19.6% in comparison with EEG-only feature), when
using the characteristics of both feature spaces can
mean that each of the signals carries information only
about a part of the changes in functional processes.
Thus, the task of determining the relationship
between EEG signals and the accelerometer on a
wider set of functional samples, when classifying
different mental states of a person at short time
intervals, is promising.
ACKNOWLEDGEMENTS
The work was supported by Act 211 Government of
the Russian Federation, contract № 02.A03.21.0006.
REFERENCES
Borisov, V., Syskov, A., Tetervak, V., Kublanov, V., 2017.
Mobile Brain - Computer Interface Application for
Mental Status Evaluation., in: Proceedings - 2017
International Multi-Conference on Engineering,
Computer and Information Sciences SIBIRCON.
Presented at the 2017 International Multi-Conference
on Engineering, Computer and Information Sciences
SIBIRCON, IEEE, Novosibirsk, Russia.
Danilov, Y.P., Tyler, M.E., Kaczmarek, K.A., 2008.
Vestibular sensory substitution using tongue
electrotactile display, in: Human Haptic Perception:
Basics and Applications. Birkhäuser Basel, pp. 467–
480. doi:10.1007/978-3-7643-7612-3_39.
David, H., Whitaker, K.W., Ries, A.J., Vettel, J.M.,
Cortney, B., Kerick, S.E., McDowell, K., 2014.
Usability of four commercially-oriented EEG systems.
J. Neural Eng. 11, 046018. doi:10.1088/1741-
2560/11/4/046018.
Egorova, D.D., Kazakov, Y.E., Kublanov, V.S., 2014.
Principal Components Method for Heart Rate
Variability Analysis. Biomed. Eng. 48, 37–41.
doi:10.1007/s10527-014-9412-7.
EMOTIV Epoc - 14 Channel Wireless EEG Headset
[WWW Document], n.d.. Emotiv. URL https://
www.emotiv.com/epoc/ (accessed 9.5.17).
Jolliffe, I., 2014. Principal Component Analysis, in: Wiley
StatsRef: Statistics Reference Online. John Wiley &
Sons, Ltd. doi:10.1002/9781118445112.stat06472.
Kublanov, V., Dolganov, A., Borisov, V., 2016.
Application of the discriminant analysis for diagnostics
of the arterial hypertension: Analysis of short-term
heart rate variability signals. Presented at the
NEUROTECHNIX 2016 - Proceedings of the 4th
International Congress on Neurotechnology,
Electronics and Informatics, pp. 45–52.
Kublanov, V.S., Dolganov, A.Y., Belo, D., Gamboa, H.,
2017. Comparison of Machine Learning Methods for
the Arterial Hypertension Diagnostics [WWW
Document]. Appl. Bionics Biomech.
doi:10.1155/2017/5985479.
Kutilek, P., Charfreitag, J., Hozman, J., 2010. Comparison
of Methods of Measurement of Head Position in
Neurological Practice, in: XII Mediterranean
Conference on Medical and Biological Engineering
and Computing 2010, IFMBE Proceedings. Springer,
Berlin, Heidelberg, pp. 455–458. doi:10.1007/978-3-
642-13039-7_114.
Lin, Y.-P., Jung, T.-P., 2017. Improving EEG-based
emotion classification using conditional transfer
learning. Front. Hum. Neurosci. 11.
doi:10.3389/fnhum.2017.00334.
Machado, I.P., Luísa, G., Gamboa, H., Paixão, V., Costa,
R.M., 2015. Human activity data discovery from
triaxial accelerometer sensor: Non-supervised learning
sensitivity to feature extraction parametrization. Inf.
Process. Manag. 51, 201–214.
doi:10.1016/j.ipm.2014.07.008.
Feature Extraction and Selection for EEG and Motion Data in Tasks of the Mental Status Assessing - Pilot Study using Emotiv EPOC+
Headset Signals
171

Mathie, M., 2003. Monitoring and Interpreting Human
Movement Patterns Using a Triaxial Accelerometer.
McLachlan, G.J., 1992. Discriminant Analysis and
Statistical Pattern Recognition: McLachlan/
Discriminant Analysis & Pattern Recog, Wiley Series
in Probability and Statistics. John Wiley & Sons, Inc.,
Hoboken, NJ, USA. doi:10.1002/0471725293.
Mueller, S.T., Piper, B.J., 2014. The Psychology
Experiment Building Language (PEBL) and PEBL Test
Battery. J. Neurosci. Methods 222, 250–259.
doi:10.1016/j.jneumeth.2013.10.024.
Okada, Y., Yoto, T.Y., Suzuki, T., Sakuragawa, S., Sugiura,
T., 2013. Wearable ECG recorder with acceleration
sensors for monitoring daily stress: Office work
simulation study. Presented at the Proceedings of the
Annual International Conference of the IEEE
Engineering in Medicine and Biology Society, EMBS,
pp. 4718–4721. doi:10.1109/
EMBC.2013.6610601.
Refaeilzadeh, P., Tang, L., Liu, H., 2009. Cross-Validation,
in: LIU, L., ÖZSU, M.T. (Eds.), Encyclopedia of
Database Systems. Springer US, pp. 532–538.
doi:10.1007/978-0-387-39940-9_565.
Silva, H.P. da, Fred, A., Martins, R., 2014. Biosignals for
Everyone. IEEE Pervasive Comput. 13, 64–71.
doi:10.1109/MPRV.2014.61.
So, W.K.Y., Wong, S.W.H., Mak, J.N., Chan, R.H.M.,
2017. An evaluation of mental workload with frontal
EEG. PLoS ONE 12. doi:10.1371/
journal.pone.0174949.
Sun, F.-T., Kuo, C., Cheng, H.-T., Buthpitiya, S., Collins,
P., Griss, M., 2012. Activity-aware mental stress
detection using physiological sensors. Lect. Notes Inst.
Comput. Sci. Soc.-Inform. Telecommun. Eng. LNICST
76 LNICST, 211–230.
Wolpaw, J., Wolpaw, E.W., 2012. Brain-Computer
Interfaces: Principles and Practice. Oxford University
Press, USA.
Wu, M., Cao, H., Nguyen, H.-L., Surmacz, K., Hargrove,
C., 2015. Modeling perceived stress via HRV and
accelerometer sensor streams. Presented at the
Proceedings of the Annual International Conference of
the IEEE Engineering in Medicine and Biology Society,
EMBS, pp. 1625–1628. doi:10.1109/
EMBC.2015.7318686.
Wu, Y., Miwa, T., Uchida, M., 2017. Using physiological
signals to measure operator’s mental workload in
shipping–an engine room simulator study. J. Mar. Eng.
Technol. 16, 61–69. doi:10.1080/20464177
.2016.1275496.
BIODEVICES 2018 - 11th International Conference on Biomedical Electronics and Devices
172
